
Before We Begin: The Peculiarity That Makes This Different From Every Other Paper in This Series

Every other white paper in this series addresses a situation where the primary income-generating asset is invisible to accounting — the uranium reserve that never appears on a balance sheet, the core deposit intangible carried at zero, the landfill airspace that sits at depleted historical cost while tipping fees rise. In each of those cases, the investor’s challenge is to find a valuation methodology that the accountant cannot provide, because the accounting standard simply refuses to recognise the asset at its economic value.
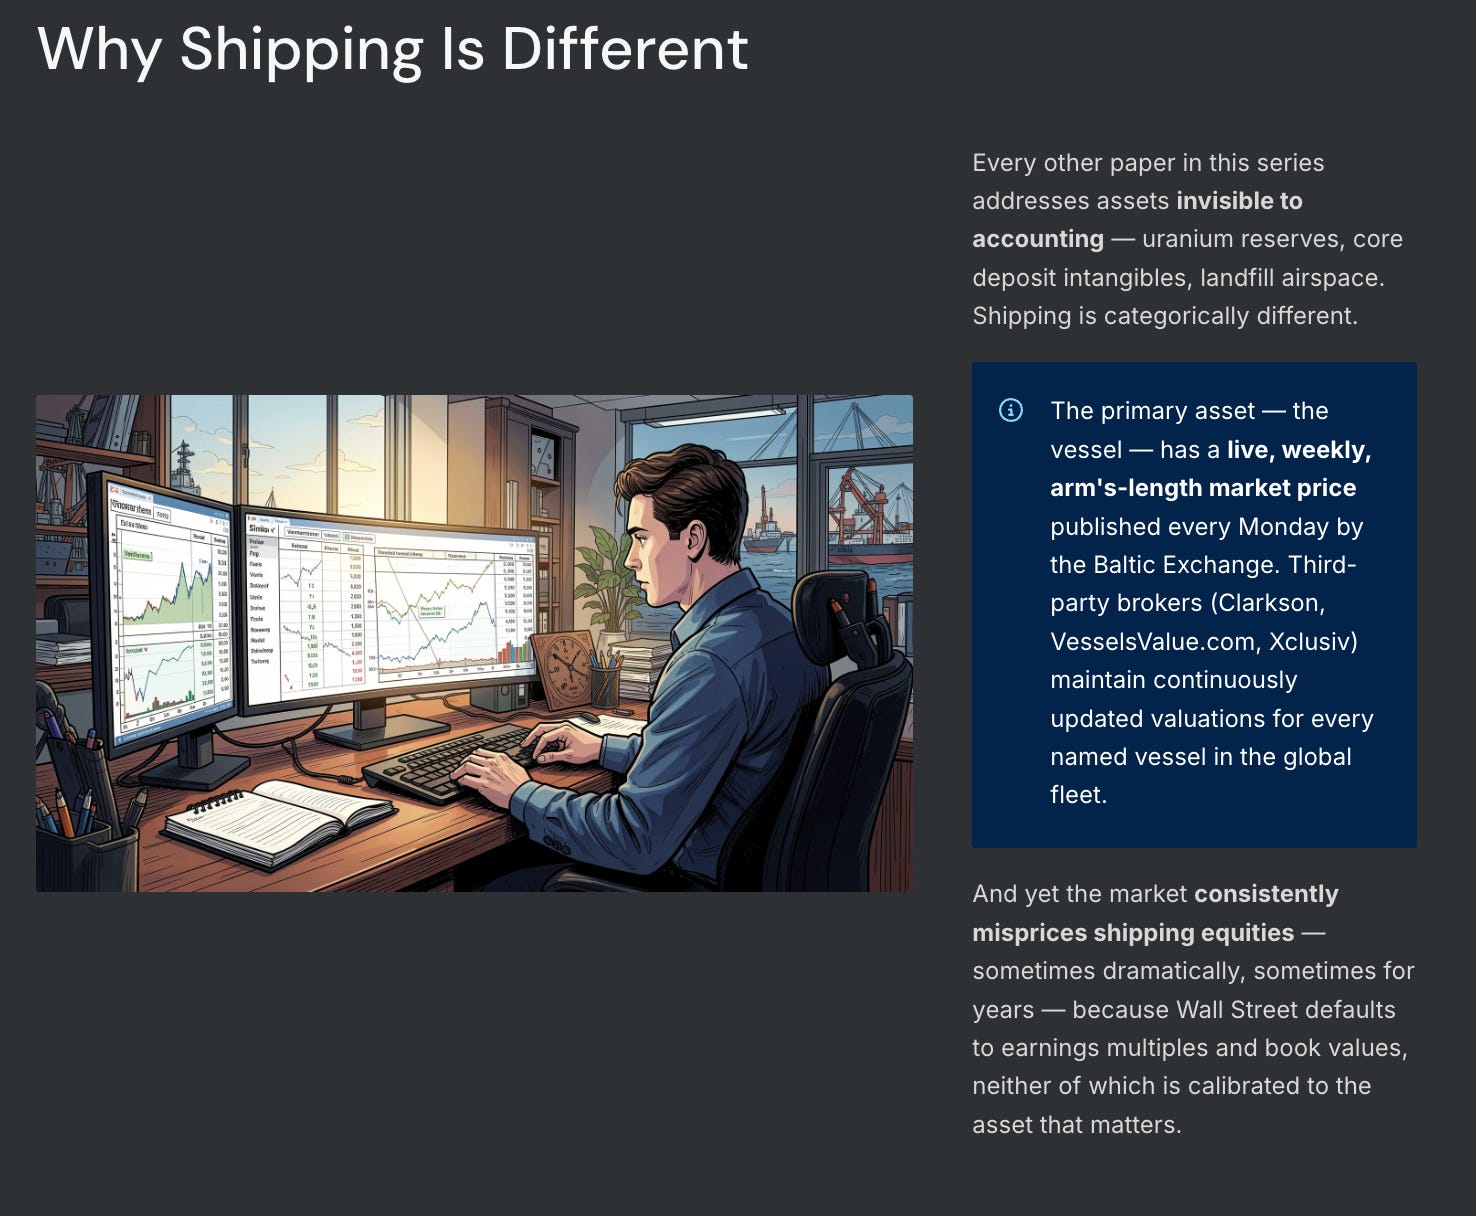
Maritime shipping is categorically different, and the difference is what makes it simultaneously the most straightforward and the most instructive case study in the series. In shipping, the primary asset — the vessel — has a live, weekly, arm’s-length market price published every Monday by the Baltic Exchange. Third-party brokers including Clarkson Research Services, VesselsValue.com, and Xclusiv Shipbrokers maintain continuously updated valuations for every named vessel in the global fleet, based on documented comparable sales transactions. The asset does not need a financial model. It does not need a geological report or a regulatory filing. It has a current market price, quoted in dollars per vessel, that any investor can look up in approximately thirty seconds.
And yet the market consistently misprices shipping equities — sometimes dramatically, sometimes for years at a time — because Wall Street’s default tools for valuing businesses are earnings multiples and book values, and neither of those tools is calibrated to the asset that matters in this industry. The vessel has a spot price. The P/E ratio ignores it. The Price-to-Book ratio misrepresents it. And the gap between what the secondhand market says a fleet is worth and what the equity market implies about the same fleet is where the returns have been made, repeatedly, by investors who understood what they were actually buying.
PART I: THE ASSET, PRECISELY DEFINED
Why the Ship Is Everything and Everything Else Is Nothing
A dry bulk shipping company — one that operates Capesize, Panamax, or Supramax vessels carrying iron ore, coal, grain, and fertiliser from producing nations to consuming ones — is the simplest conceivable business from a capital structure perspective. You own ships. You charter those ships to industrial customers who need to move large quantities of bulk commodities across oceans. The customer pays you a daily rate for the use of the vessel. At the end of the charter, the ship comes back to you and you charter it to someone else.
Every dollar of revenue this company generates flows directly from the physical vessel. There is no software. There is no brand. There is no customer relationship that survives the vessel being sold — if you sold the ship, the charterer would simply charter an equivalent vessel from another owner. The intellectual property is zero. The competitive moat, to the extent it exists, comes from the age, quality, and fuel efficiency of the fleet — all characteristics of the physical vessel — and the experience of the operating team in maintaining and chartering those vessels. But if you stripped out the vessels and left everything else, there would be nothing left that generates income.
This makes shipping unusually tractable for the owner’s valuation framework. There is no need to assess the value of a customer relationship, or a drug pipeline, or a regulatory franchise. You count the ships, look up their current market values in the secondhand broker database, subtract the debt, and you have what the business is worth to a liquidating buyer today.
The size of the gap between that number and the equity market price — and the reason that gap exists and periodically becomes enormous — is the subject of this paper.
The Ship Market That Wall Street Ignores
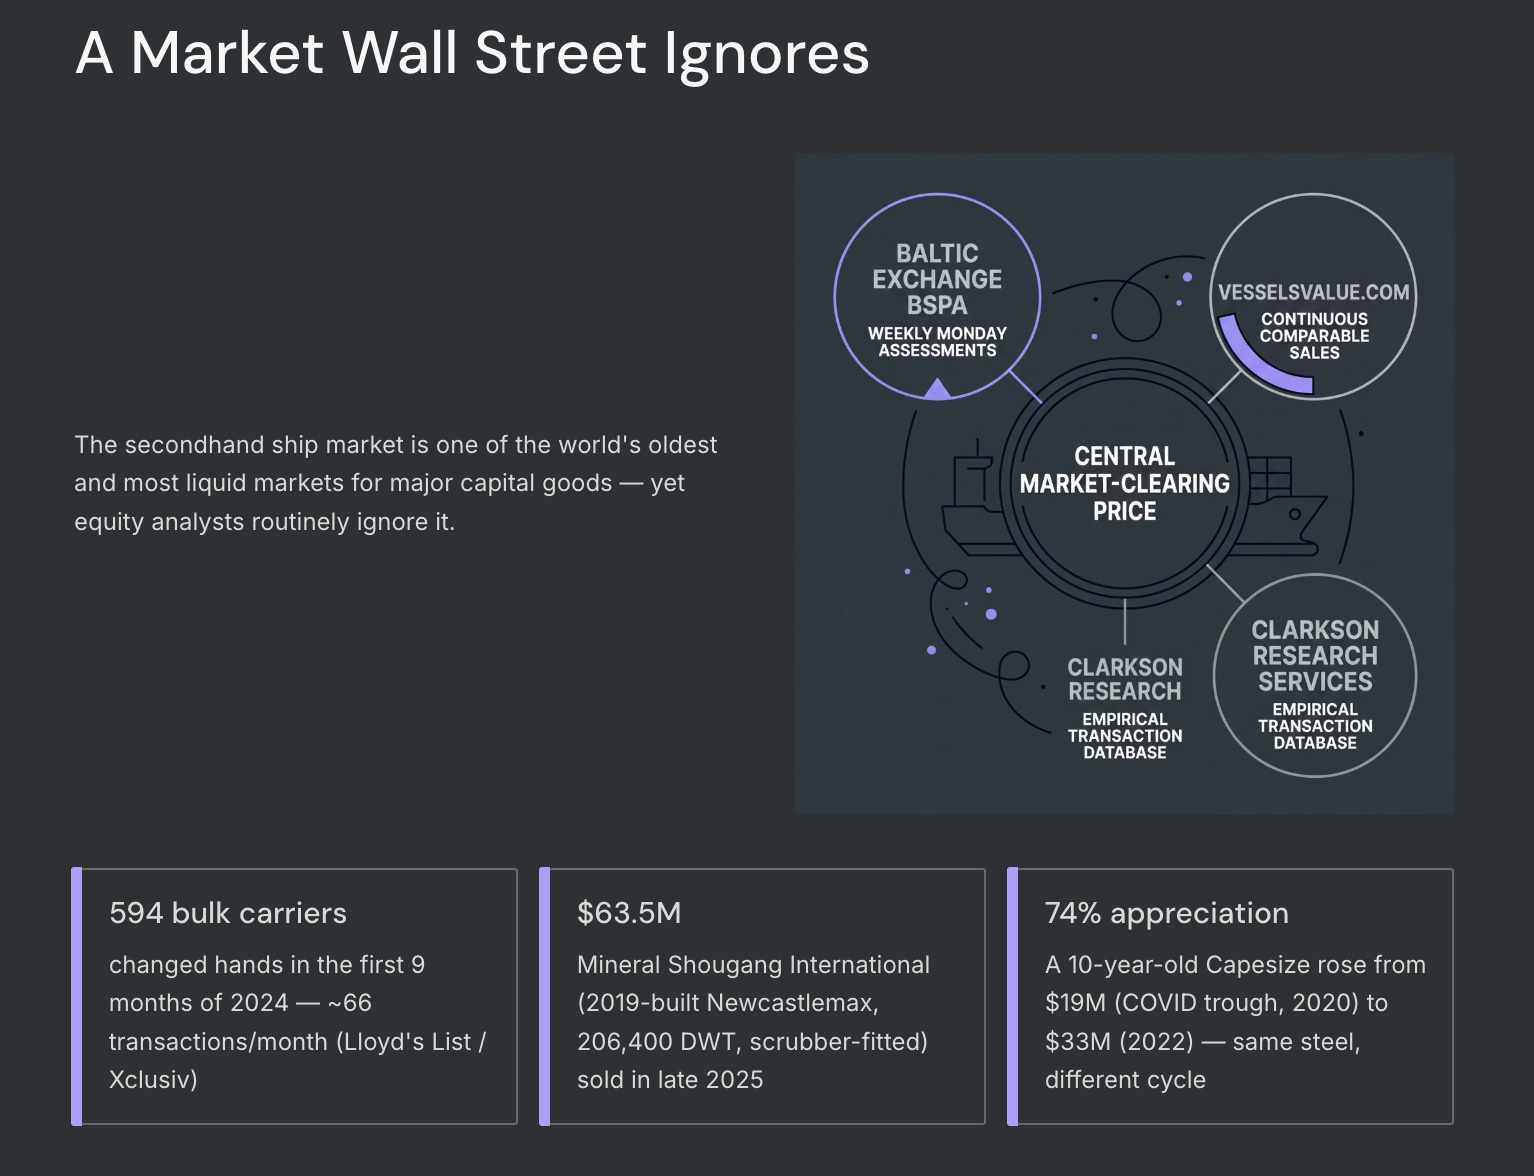
The secondhand ship market is one of the world’s oldest and most liquid markets for major capital goods. Ships have been bought and sold between owners for as long as there have been ships. The modern institutional version of this market — with professional shipbrokers intermediating transactions, the Baltic Exchange providing weekly reference valuations, and broker databases tracking every sale by IMO vessel number — is a mature, liquid, and transparent market that processes hundreds of transactions per year.
The Baltic Exchange Sale and Purchase Assessments, published every Monday, provide the definitive reference price for each major vessel class. The Monday assessment for a five-year-old Capesize bulk carrier (approximately 172,000 DWT) reflects transactions that brokers have observed, participated in, and recorded in the previous week. It is adjusted for the specific vessel’s attributes — fuel efficiency, installed equipment, survey status, flag, and class society certification — to arrive at individual valuations for specific named vessels. VesselsValue.com, Clarkson Research Services, and Xclusiv Shipbrokers each maintain their own methodologies, but all are rooted in the same empirical foundation: what have comparable vessels actually sold for recently?
In the first nine months of 2024 alone, approximately 594 bulk carriers changed hands in the secondhand market — an average of 66 transactions per month, per Lloyd’s List data citing Xclusiv Shipbrokers. This is not a thin, illiquid market where one or two transactions set a reference price. It is a market processing more transactions in a single month than most commercial real estate markets process in a year. The price it produces is as real and as current as the copper spot price.
The specific transaction record confirms this. In late 2025, a 2019-built Newcastlemax bulk carrier — the Mineral Shougang International, 206,400 DWT, scrubber-fitted — was reported sold for $63.5 million, per Lloyd’s List citing shipbroker reports. In 2023, Clarkson Research assessed a five-year-old Capesize at approximately $54.5 million, close to 90% of the then-prevailing newbuild price of $65 million. A ten-year-old Capesize traded at approximately $19 million at the COVID trough of early 2020, then surged to $33 million by 2022 as the freight market tightened. The same physical vessel — the same iron, steel, engine, and propeller shaft — was worth 74% more in 2022 than in 2020, not because anything changed about the ship, but because the supply-demand dynamics of the freight market had shifted and the cash flows the vessel would generate during the remainder of its operating life were now substantially higher.
PART II: THE ACCOUNTING TREATMENT AND THE PECULIAR WAY IT FAILS IN SHIPPING
Straight-Line Depreciation and a Market That Never Moves in a Straight Line
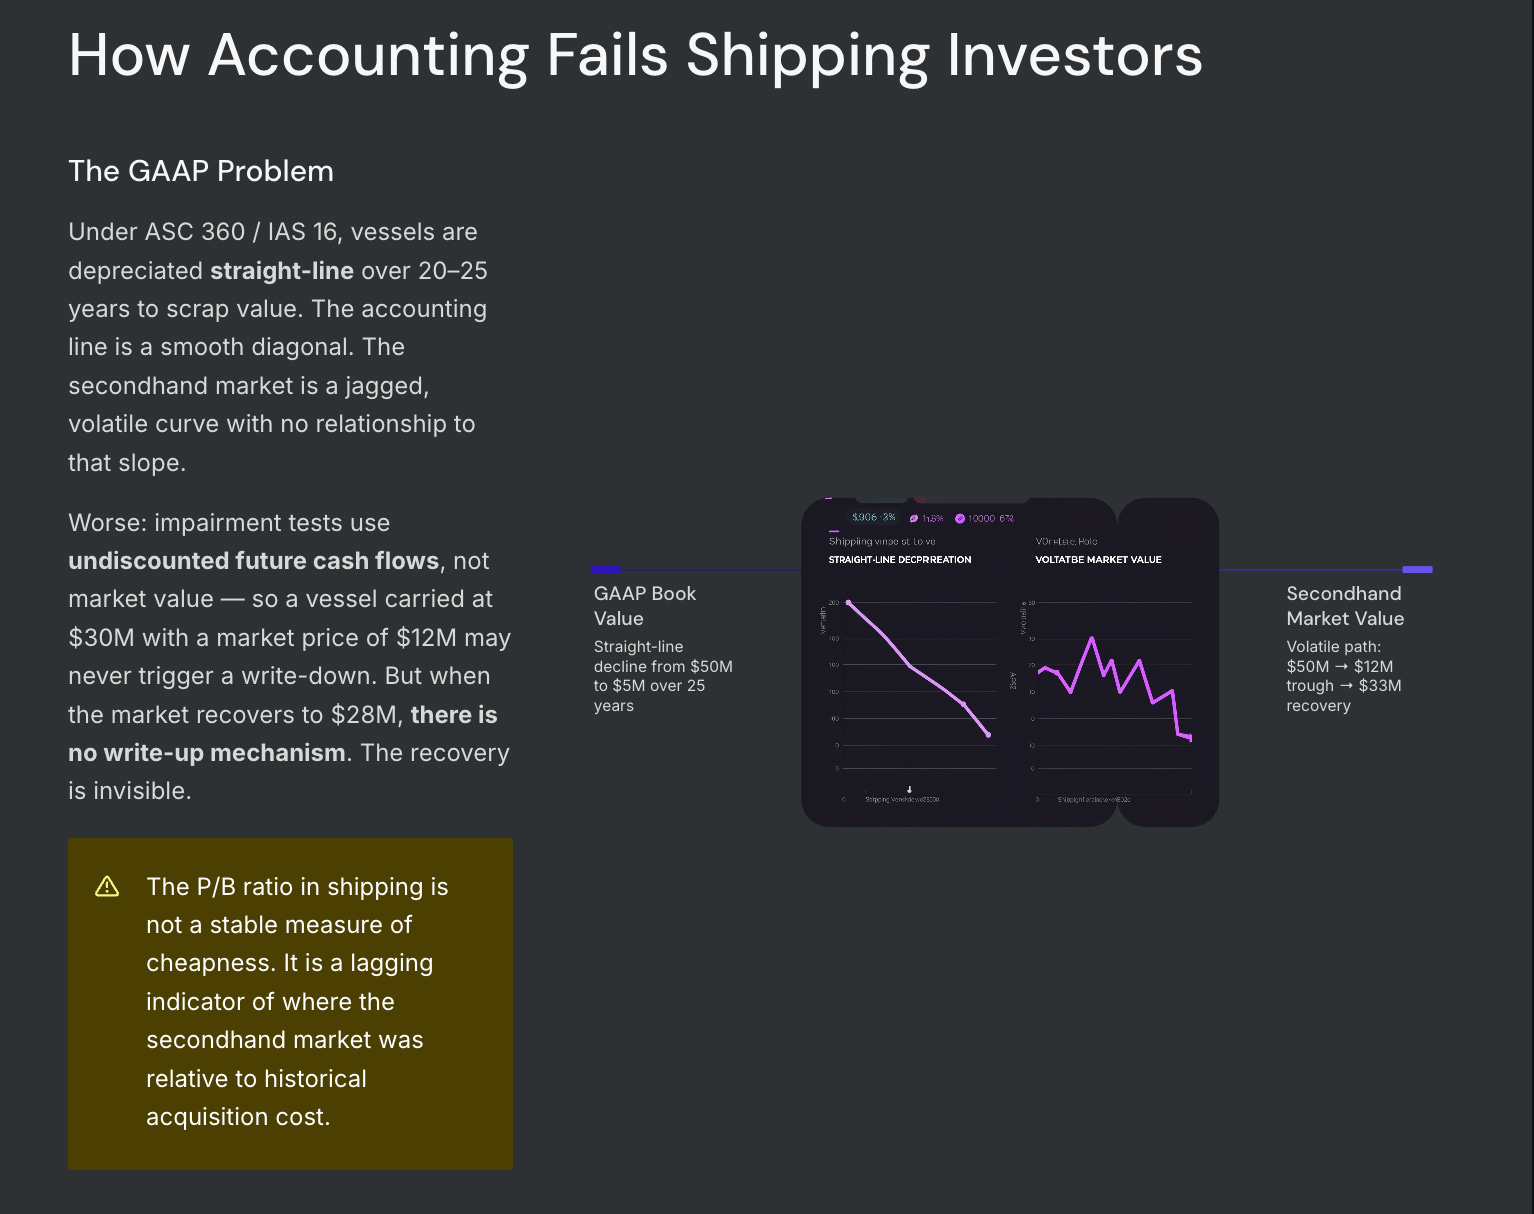
Under US GAAP (ASC 360) and IFRS (IAS 16 cost model, which virtually all listed shipping companies elect), vessels are capitalised at historical acquisition cost and depreciated straight-line over their estimated useful life — typically 20 to 25 years — to a residual scrap value. The mechanics are simple and consistent. A Capesize acquired in 2010 for $50 million, depreciated over 25 years to a $5 million scrap residual, produces an annual depreciation charge of $1.8 million. After 12 years of operation through 2022, the carrying value is $28.4 million. That number is completely unrelated to whether the secondhand market values a comparable 12-year-old Capesize at $8 million, as it did in 2016 during the dry bulk trough, or at $28 to $35 million, as it did in 2022 when the freight market recovered. The accounting balance sheet produces a straight diagonal line declining from $50 million to $5 million over 25 years. The secondhand market produces a jagged, volatile curve that bears no relationship to the accounting line’s slope, direction, or endpoint at any given moment.
This creates a specific and asymmetric problem that the GAAP framework handles in the worst possible way for investors trying to assess fleet value. The impairment rules under ASC 360 require companies to test vessels for impairment only when circumstances indicate that the carrying amount may not be recoverable — and the recovery test is done on an undiscounted cash flow basis, not on a market value basis. This means that during a severe market downturn, a vessel with a carrying value of $30 million but a secondhand market price of $12 million does not require an impairment if the undiscounted projected future cash flows from the vessel over its remaining life still technically exceed $30 million. The accounting does not have to acknowledge the market’s assessment. The balance sheet continues to show $30 million for something the market says is worth $12 million.
But there is no equivalent mechanism when the market recovers. If that same vessel’s secondhand price rises from $12 million back to $28 million as the freight cycle turns — as happened dramatically from 2020 to 2022 — there is no provision under GAAP or under the elected IFRS cost model for writing the vessel back up to reflect the recovery. The asset stays at its straight-line depreciated cost. The market says it is worth $28 million. The balance sheet says it is worth something between the original $30 million and the $5 million scrap residual, declining mechanically toward the latter. The recovery is invisible.
The consequence for investors is that the Price-to-Book ratio in shipping is not a stable measure of cheapness or expensiveness. It is, instead, a lagging indicator of where the secondhand market was relative to the historical cost of the fleet at the time it was acquired. When shipping stocks look expensive on a P/B basis, it often means vessels have been appreciating in the secondhand market while the GAAP book value has been declining through depreciation — the P/B multiple expands because the market price has risen while the book value has fallen. When shipping stocks look cheap on a P/B basis, it often means vessels were bought at peak prices and have since depreciated in the secondhand market faster than the accounting depreciation — the P/B looks low but it is a trap, because the book value overstates the asset’s actual market price.
This last point requires emphasis because it runs counter to every value-investing instinct applied to this sector by investors who do not understand the secondhand market. During the 2016 dry bulk trough, many shipping stocks were trading at or below 1.0x book value. Screens for “cheap” shipping equities produced long lists of companies with P/B ratios below 0.8x. This looked like value. In many cases, it was a trap. The book value was a phantom figure reflecting peak-cycle acquisition prices that had been insufficiently depreciated toward the trough-cycle market prices. The real “book value” — what the fleet was actually worth in the secondhand market — was dramatically below the GAAP figure, and the stock was not cheap; it was expensive relative to the true liquidation value of the asset.
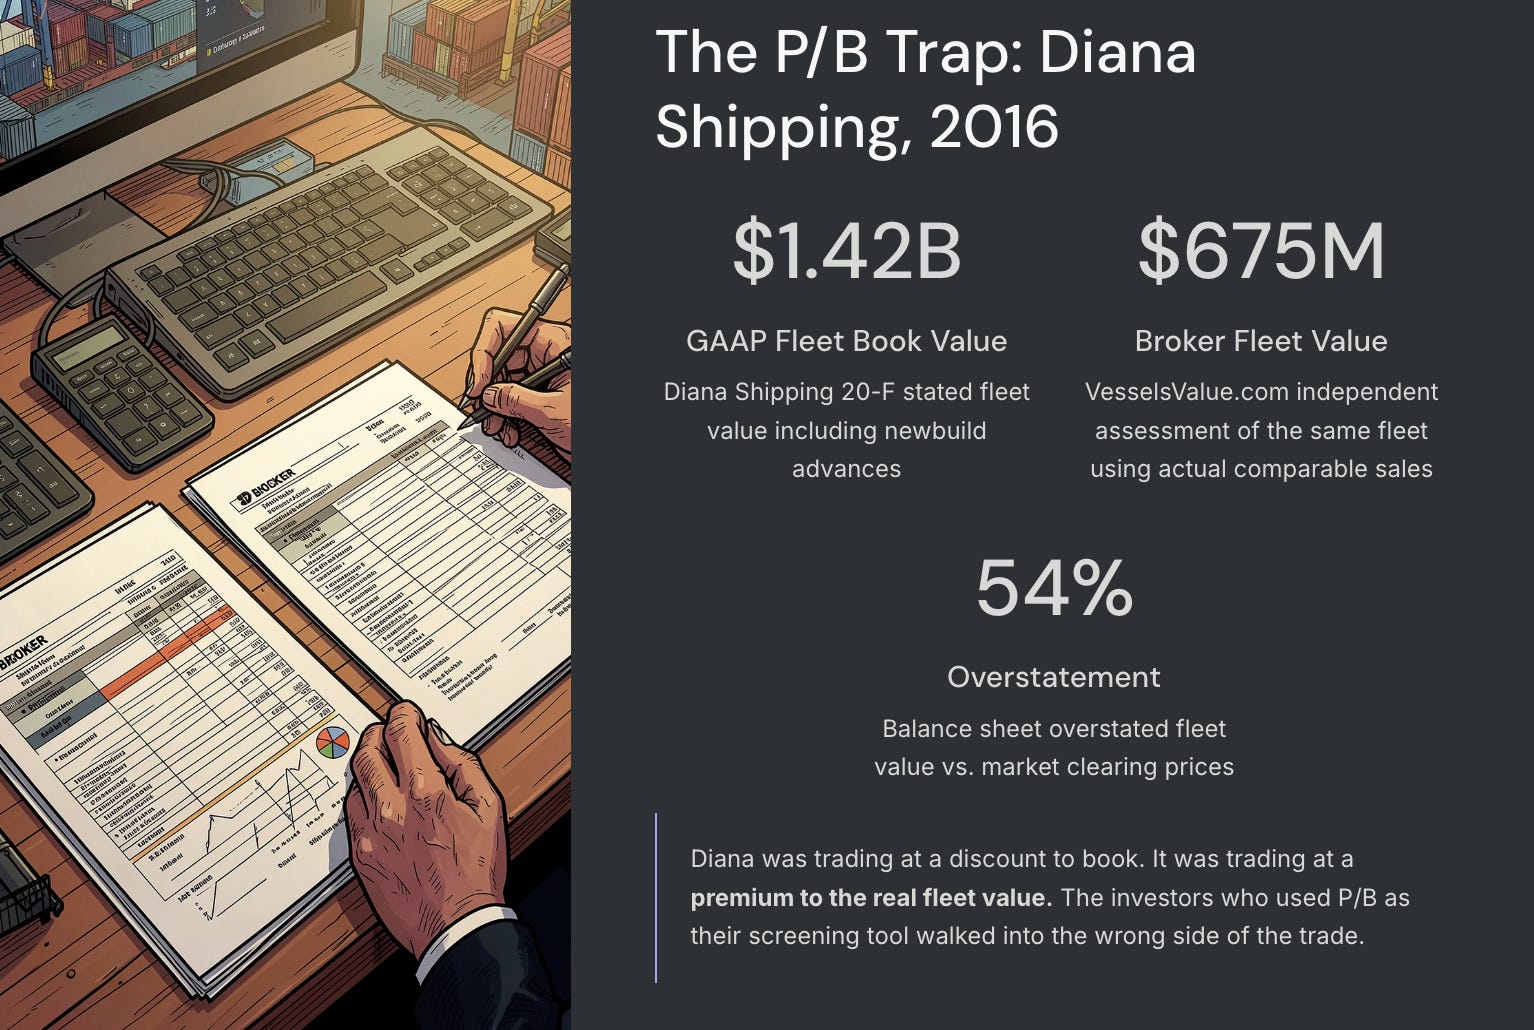
Value Investor’s Edge, using VesselsValue.com data in Q3 2016, documented this with precision for Diana Shipping (NYSE: DSX). Diana’s 20-F stated a fleet book value of approximately $1.42 billion including newbuild advances. The independent broker valuation of the same fleet using actual comparable sales data from VesselsValue produced an estimate of approximately $675 million — a 54% overstatement of fleet value on the balance sheet relative to market clearing prices. Diana was trading at a discount to book. It was trading at a premium to the real fleet value. The investors who used P/B as their screening tool walked into the wrong side of the trade.
PART III: THE OWNER’S VALUATION — A FRAMEWORK THAT ACTUALLY WORKS
Fleet NAV: The Five-Step Method That Requires No Model
The owner’s valuation of a shipping company is not merely simpler than conventional financial analysis — it is more accurate, because it starts from a directly observable market price rather than from an accounting artifact or an earnings forecast. The methodology has five steps, each of which requires only arithmetic applied to publicly available data.
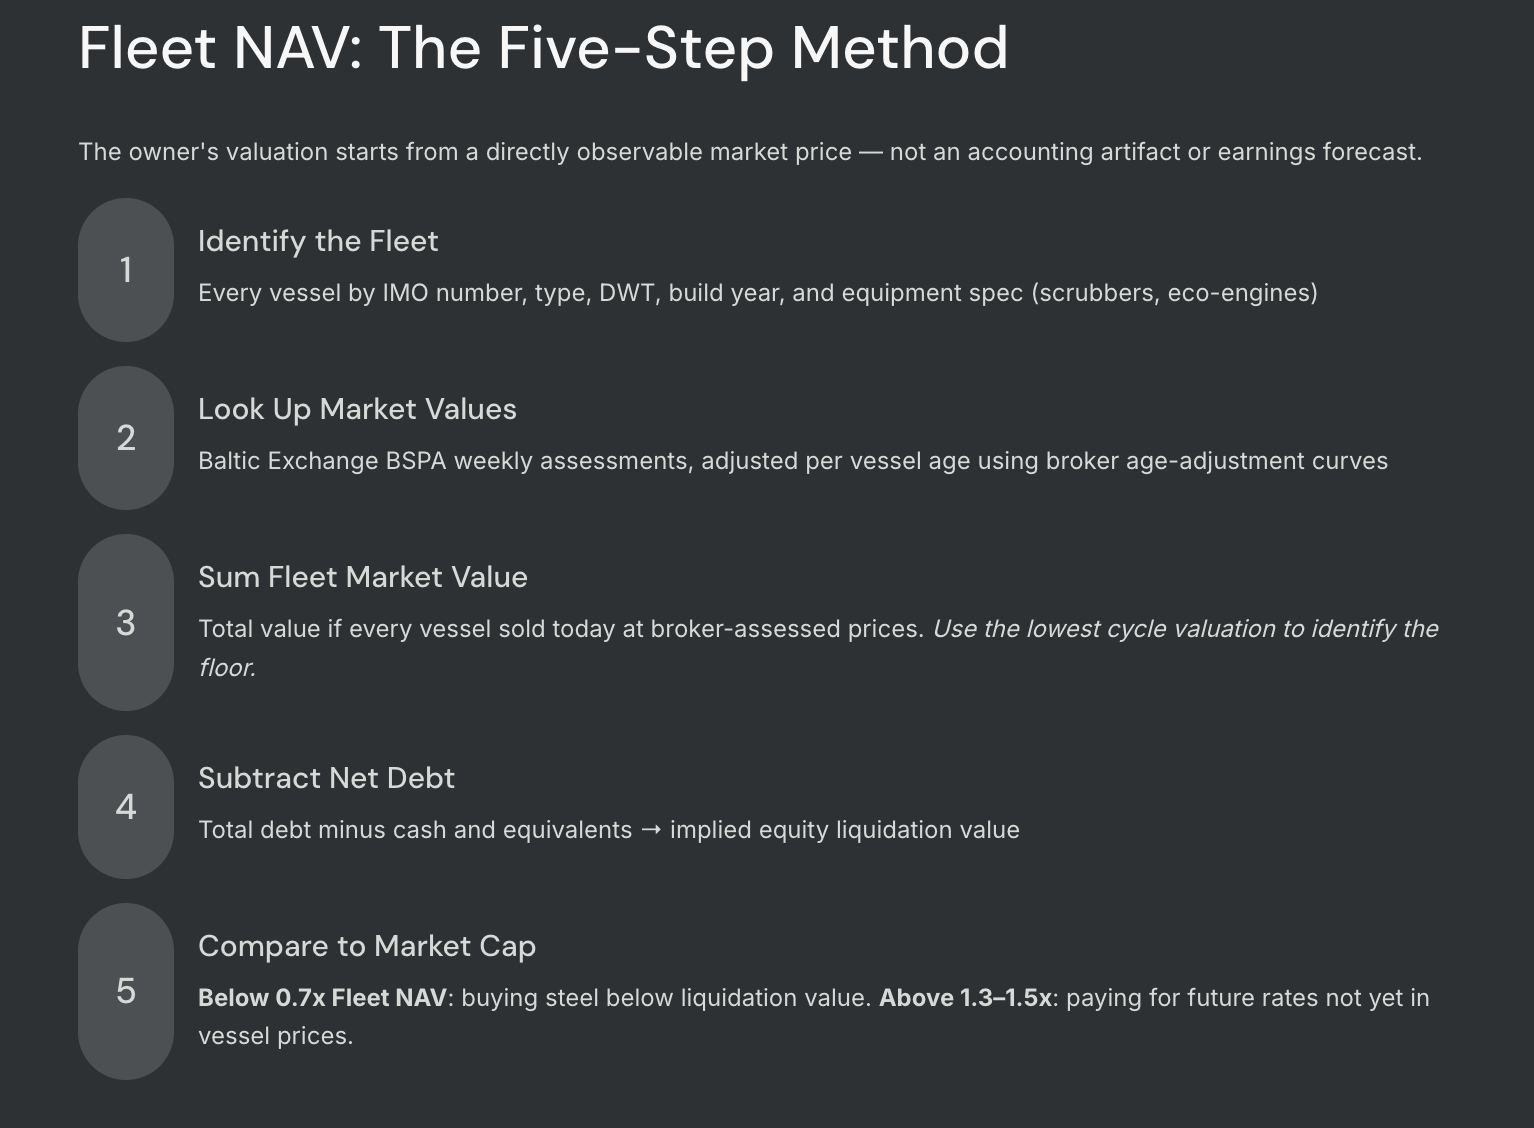
The first step is to identify every vessel in the fleet by IMO number, vessel type, deadweight tonnage, year of build, and equipment specification — scrubbers, eco-engines, fuel efficiency rating. This information is disclosed in the company’s annual reports and filings, and is also available from publicly accessible databases including Clarksons’ World Fleet Register and IHS Markit’s Maritime intelligence. For a company like Diana Shipping or Safe Bulkers, the fleet list is disclosed explicitly in the 20-F or annual report, often vessel by vessel.
The second step is to look up the current secondhand market value for each vessel type from the Baltic Exchange BSPA weekly assessments or other valuation/ brokerage sites, adjusted for each vessel’s specific age using broker age-adjustment curves. The Baltic publishes benchmark values for five-year-old vessels in each major class. The age adjustment — which reflects the decline in value per year of age, calibrated to the current market relationship between new and old vessel prices — converts the benchmark price to an estimated value for each specific vessel in the fleet.
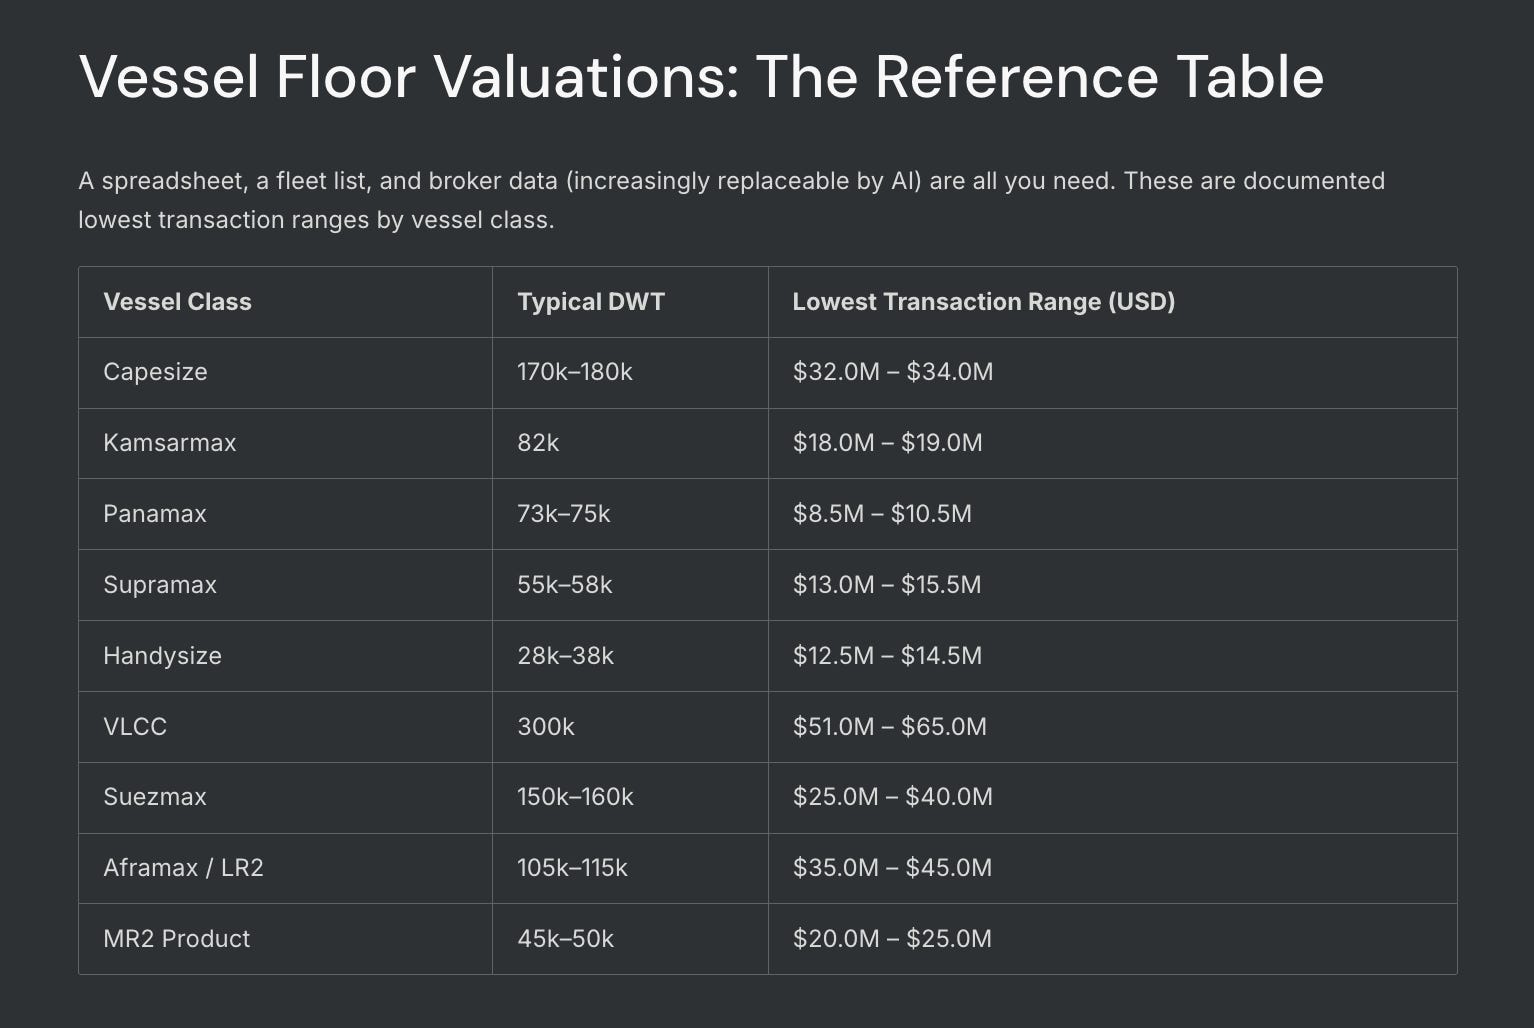
The third step is to sum the individual vessel valuations to produce the Fleet Market Value — the total value of the fleet if every vessel were sold in the current secondhand market at broker-assessed prices.
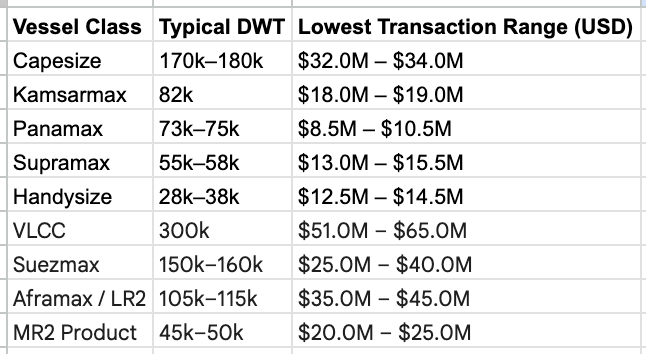
Note: it is important to take the lowest vessel valuation in a cycle as the valuation is dependant on market cycle as well. This helps us to identify the floor.
The fourth step is to subtract net debt — total debt minus cash and cash equivalents — to arrive at the implied equity value of the fleet on a liquidation basis.
The fifth step is to compare this Fleet NAV to the current market capitalisation of the equity. The ratio of market cap to Fleet NAV — the Price-to-Fleet-NAV multiple — is the single most informative metric available for evaluating shipping equity value. When this ratio falls below 0.7x, the market is pricing the equity at a discount to the immediate liquidation value of the fleet. This means: if you bought all the equity and all the debt at current prices, you could immediately sell every ship in the secondhand market, retire all the debt, and have money left over. The business itself — the management team, the chartering relationships, the operational history — has implied negative value in the market’s pricing. That condition has historically been temporary.
When the Price-to-Fleet-NAV ratio exceeds 1.3 to 1.5x, the opposite is true. The market is pricing the equity at a premium to the fleet’s immediate liquidation value, implying that the investor is paying for future charter rates not yet reflected in current vessel prices. This premium may be justified if freight markets are in an early upcycle and vessel prices are lagging. It is not justified if the freight market is near a peak and vessel prices already reflect cycle-high assumptions. The discipline is the same either way: look at the asset price, not the earnings multiple.
PART IV: STORIES FROM THE WATERLINE — THREE CASE STUDIES IN SHIPPING EQUITY MISPRICING
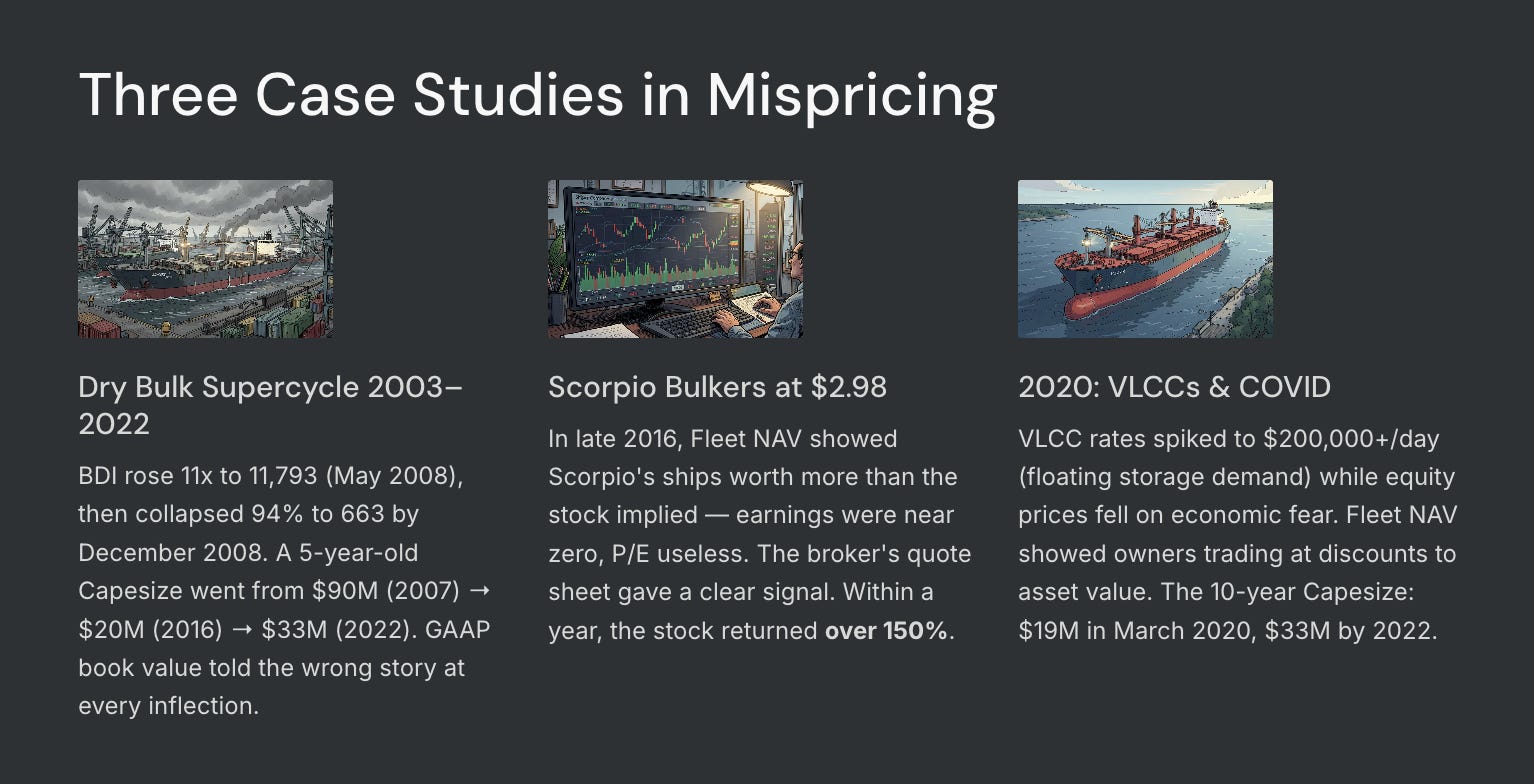
The Dry Bulk Supercycle and Its Aftermath: How the Same Ships Were Worth $90 Million, Then $12 Million, Then $30 Million
The dry bulk shipping cycle of 2003 to 2016 is the most dramatic and best-documented case study in shipping equity valuation history, and it illustrates the Fleet NAV framework with a clarity that no financial model can replicate.
In the years from 2003 to 2008, China’s industrial expansion created an unprecedented demand shock for seaborne dry bulk commodities. Iron ore and coal imports into China grew at double-digit annual rates. Every Capesize vessel in the world was fully employed, every day, at rates that were extraordinary by historical standards. The Baltic Dry Index, a composite of bulk carrier time charter rates, rose from approximately 1,000 points in early 2002 to a peak of 11,793 points in May 2008 — an eleven-fold increase in daily charter rates over six years. Vessel owners who had bought ships in 2001 and 2002 at depressed prices were generating cash flows that made the purchase price look trivial within a couple of years.
The secondhand market for vessels reflected this. A five-year-old Capesize that had been worth approximately $20 to $25 million in 2001 was worth $90 to $95 million by 2007 to 2008. Shipping companies that had bought vessels cheaply in the early 2000s were sitting on fleets that had appreciated 4 to 5 times in the secondhand market — appreciation that appeared nowhere on the GAAP balance sheet because there is no mechanism for writing vessels up to market value under the cost model. The earnings were high, the dividends were large, and shipping stocks traded at significant premiums to their GAAP book values. But Fleet NAV — the actual liquidation value of the fleet — was several times book value for companies with old, cheap vessels purchased in the prior trough.
Then the global financial crisis hit in late 2008. Chinese industrial growth slowed abruptly. Simultaneously, the newbuilding orders placed during the 2003 to 2008 boom began delivering — shipping companies and speculators had ordered thousands of new vessels at the height of the cycle, and those vessels arrived in 2009, 2010, and 2011 into a market with dramatically lower demand. The Baltic Dry Index fell from its May 2008 peak of 11,793 to 663 by December 2008 — a 94% collapse in daily charter rates over seven months. Vessel prices followed.
By 2016, a five-year-old Capesize that had been worth $90 million in 2007 was worth approximately $20 to $25 million. A ten-year-old Capesize — the vessels that had been five years old in 2011, purchased at the elevated prices of the 2007 to 2011 period — was worth approximately $8 to $12 million in the secondhand market. The companies that had taken on debt to acquire these vessels at 2007 to 2008 prices, and had financed them with loans against their elevated valuations, were in various states of financial distress. Their GAAP balance sheets showed vessel carrying values that were declining slowly through straight-line depreciation from their original high acquisition costs — values that were still well above the secondhand market, because the accounting depreciation had not been steep enough to track the collapse in vessel prices.
In this environment, the trap for conventional value investors was precisely described above: P/B ratios below 1.0x that appeared cheap were actually expensive relative to the real Fleet NAV. Diana Shipping’s $1.42 billion fleet book value versus $675 million broker valuation — a 54% overstatement — meant that a stock trading at 0.8x GAAP book was actually trading at 1.7x the true fleet value. Cheap by one measure. Expensive by the correct measure.
The Fleet NAV framework identified the distinction correctly. Companies with fleets whose GAAP book value had already been written down close to secondhand market values — either through impairments taken during the downturn or through operating histories that had built up significant accumulated depreciation — were trading at Fleet NAV multiples below 1.0x, and represented genuine value. Companies with overvalued legacy fleets at inflated GAAP book values were not cheap regardless of where their P/B appeared to be.
The cycle turned. From 2016 to 2019, freight rates recovered modestly. Then, in 2020 to 2022, a combination of COVID disruptions — which initially crushed demand but then created massive supply chain bottlenecks and demand surges as economies reopened — produced an extraordinary freight cycle. The BDI, which had been languishing below 1,500 for much of 2019 and early 2020, reached 5,650 by October 2021 — the highest in a decade. The ten-year-old Capesize that had been worth $12 million at the COVID trough in early 2020 was worth $33 million by 2022. The same iron and steel, the same engine, the same propeller — worth 175% more in 24 months because the market price of the freight service it provided had tripled.
The companies that survived the 2016 trough with manageable debt levels, rebuilt their balance sheets through the modest recovery of 2017 to 2019, and held their fleets through the pandemic disruption emerged into the 2021 to 2022 period with fleets trading at large premiums to their GAAP book values — premiums that the GAAP model could not show because there is no write-up mechanism. Fleet NAV told the story at every point in the cycle. GAAP book value told the wrong story at every critical inflection.
Scorpio Bulkers at $2.98: What the Broker’s Quote Sheet Said That the Earnings Model Could Not
In late 2016, J. Mintzmyer of Value Investor’s Edge published a fleet NAV analysis of Scorpio Bulkers (then NYSE: SALT, later renamed Scorpio Holdings) using VesselsValue.com broker data. The stock was trading at approximately $2.98 per share. The company had a fleet of Ultramax and Supramax bulk carriers — smaller than Capesize but more flexible, able to serve a wider range of ports and cargo types.
The analysis was not about earnings. Scorpio Bulkers was earning very little at 2016 freight rates — the Baltic Dry Index was near multi-decade lows, and a bulk carrier owner with fixed operating costs and minimal charter revenue was barely breaking even, if at all. P/E was either undefined or extremely high. EV/EBITDA was meaninglessly high. Any earnings-based valuation methodology produced either no output or a deeply uninviting number.
The Fleet NAV analysis produced a completely different picture. VesselsValue assessments for Scorpio’s specific fleet of modern Ultramax and Supramax vessels — adjusted for their individual ages, fuel efficiencies, and survey statuses — produced a total Fleet Market Value that, after subtracting net debt, implied a per-share Fleet NAV materially above the $2.98 stock price. The market was pricing Scorpio’s equity at a significant discount to the immediate liquidation value of the fleet. This meant that a buyer purchasing 100% of Scorpio at $2.98 per share could theoretically sell every ship in the secondhand market at current broker prices, retire all the debt, and recover more than the purchase price. The operating franchise itself — the management team, the chartering relationships, the future earnings potential of the fleet — was being offered for free, or at negative implied value.
The thesis was not that freight rates were about to recover immediately. The thesis was strictly about the asset value. The ships were worth more, in a documented and verifiable sense, than the market implied by the stock price. Shipping markets eventually reflect the value of the underlying assets through one of two mechanisms: either freight rates recover, improving earnings and causing the market to re-rate the equity higher; or the assets are sold in the secondhand market, directly realising the Fleet NAV. In either case, the investor who owned the equity at a discount to Fleet NAV was positioned to benefit.
Within a year of the $2.98 analysis, Scorpio Bulkers had returned over 150% as freight markets recovered and vessel values moved higher. The return was not predicted by any earnings model, because the earnings recovery itself was not predicted — freight rates are notoriously difficult to forecast. The return was produced by buying an asset below its immediately observable market value and waiting for the market to recognise that value. The broker’s quote sheet was right. The earnings model was useless.
2020: COVID Hits, VLCCs Spike, and the Asset Price Tells a Different Story From the Fear
In 2020, the COVID pandemic produced one of the strangest freight rate dynamics in modern shipping history, and it illustrates how the asset-price framework handles crisis conditions where the earnings model produces the most misleading signals.
When the pandemic began in early 2020, crude oil demand collapsed as the global economy shut down. OPEC+ production disputes, simultaneously, were pushing Saudi Arabia and Russia to flood the market with supply at exactly the moment demand was falling off a cliff. The result was a storage problem of historic proportions: the world had more crude oil than it had capacity to store onshore. The solution was floating storage — chartering Very Large Crude Carriers (VLCCs) to anchor offshore and hold crude oil until onshore storage became available. VLCC time charter rates, which had been approximately $30,000 to $40,000 per day in late 2019, spiked to over $200,000 per day in March and April 2020 — the highest rates in years, occurring simultaneously with the deepest economic contraction in decades.
For an investor running a conventional earnings model, this was completely uninterpretable. Earnings had spiked to extraordinary levels — but the reason was a distortion that would clearly not last once floating storage was released. A P/E multiple applied to peak-COVID VLCC earnings produced a valuation that no sane person would pay for a sustainable business. The spike in earnings was real but it was also obviously temporary, making the earnings metric actively misleading as a valuation input.
The Fleet NAV framework handled this correctly. A five-year-old VLCC in early 2020, before the storage spike, was worth approximately $80 to $90 million in the secondhand market. The storage spike caused some upward movement in vessel values as operators rushed to add capacity, but the structural valuation of the vessels was not changed fundamentally by a temporary rate spike. A Fleet NAV analysis in March 2020 — at the peak of the rate spike, when fear about the overall economy was simultaneously driving tanker equity prices down despite the high rates — would have shown VLCC owners trading at discounts to their Fleet NAVs because the equity market was pricing economic uncertainty while the asset market was pricing the vessel’s intrinsic value independently. The investors who used Fleet NAV rather than current earnings to evaluate tanker companies in April 2020 were buying the steel at a discount while everyone else was trying to decide whether the spike was real or fake.
The 10-year-old Capesize that was worth $19 million at the COVID trough in early 2020 and $33 million by 2022 is the simpler illustration of the same point. The fear that compressed vessel values at the COVID trough was real — demand uncertainty was genuinely high, and the secondhand market correctly reflected some of that uncertainty through lower prices. But the structural economics of the vessel — its ability to carry iron ore from Brazil to China at a daily rate that covers its operating costs with margin to spare — did not disappear because of COVID. The investor who looked at the $19 million vessel value in March 2020 and the enterprise value of the company holding it, and found that the market was pricing the equity below the fleet’s own assessment of what the ships could be liquidated for, was identifying a temporary mispricing — not a permanent impairment.
CONCLUSION: THE ASSET HAS A PRICE TAG — USE IT
Every other sector in this series of white papers requires the investor to do work that the accounting system has declined to do: count the uranium reserves, measure the copper in the ground, calculate the CDI on the deposit franchise, estimate the replacement cost of the transmission grid. In each case, the investor is building a measurement framework from scratch because the accounting system provides no useful starting point.
Shipping is different. The asset prices are transparent (just less accessible). VesselsValue.com and Clarkson Research will tell you, to the nearest million dollars, what each specific named vessel in the fleet sold for most recently and what comparable vessels are worth today. The market for your primary asset is as transparent, as liquid, and as continuously quoted as the market for crude oil or copper. You do not need a model. You need a spreadsheet, a fleet list, and a broker’s data subscription (which AI can replace now — in terms of what we need). As a guideline:
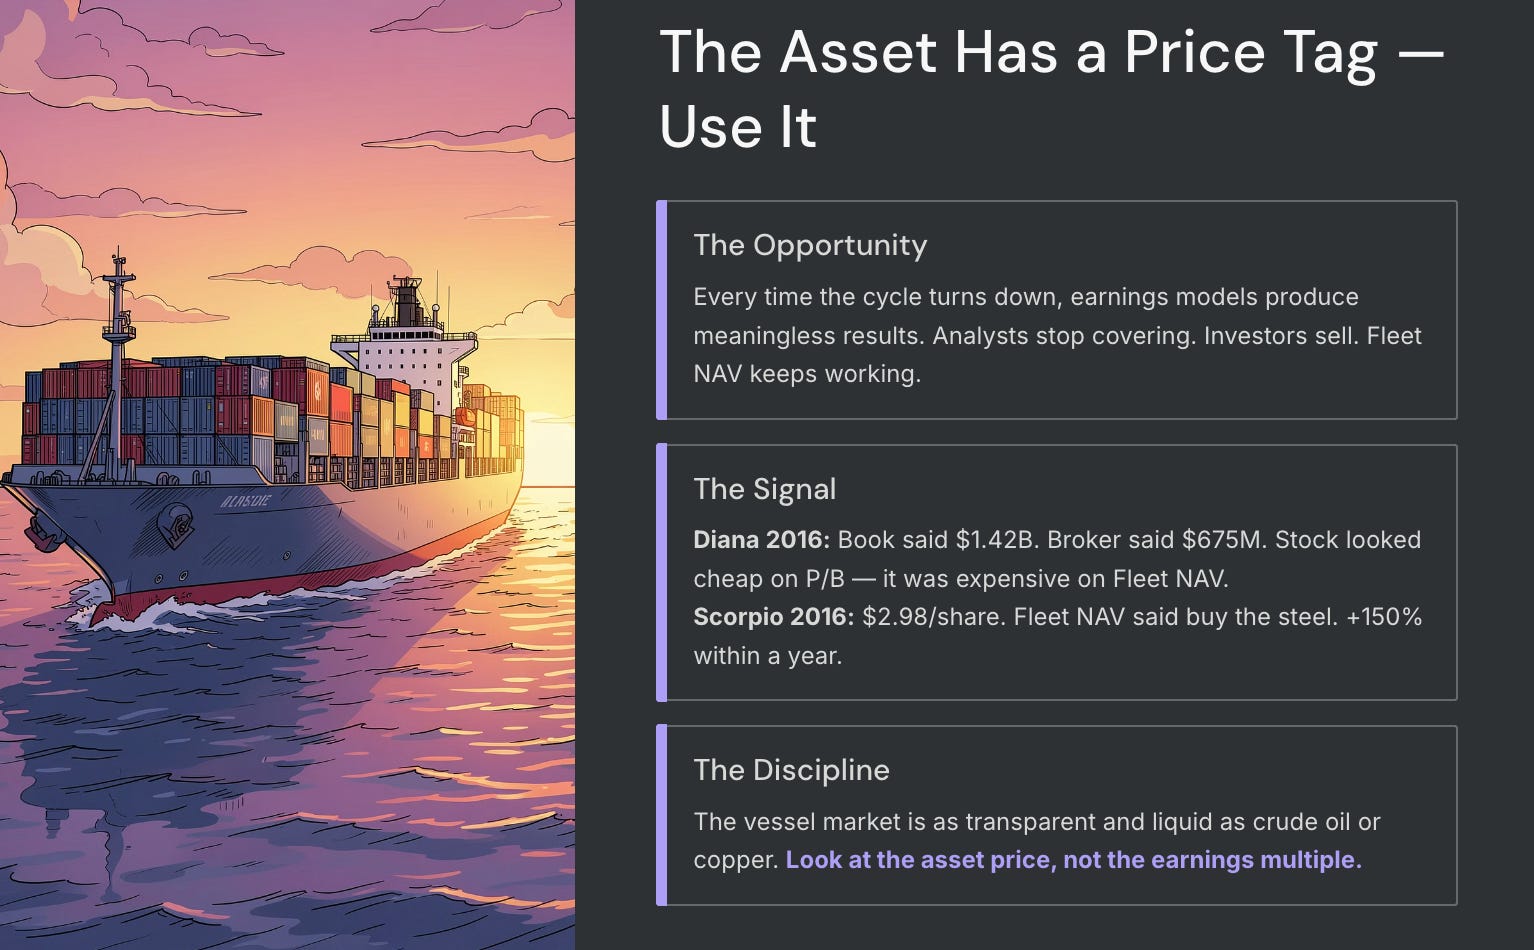
The market’s persistent failure to use this straightforward tool — and its preference instead for earnings multiples that are volatile, cyclically misleading, and anchored to an accounting system that reflects none of the vessel market’s dynamics — is what creates the opportunity. Every time the dry bulk or tanker cycle turns down, every time freight rates fall and earnings disappear, the earnings model produces either a meaningless or deeply uninviting result. Analysts stop covering the companies. Investors sell. The P/B screens light up with apparently cheap stocks that are, by the earnings model, unanalysable.
The Diana Shipping balance sheet said $1.42 billion in 2016. The broker’s quote sheet said $675 million. The stock looked cheap on P/B. It was expensive on Fleet NAV. And the investor who could distinguish those two numbers was the one who avoided the trap.
The Scorpio Bulkers stock was $2.98 in 2016. The Fleet NAV said the ships were worth more than the price implied. Earnings were near zero. The earnings model offered nothing. The Fleet NAV offered a clear signal: the market is selling you steel below its current market price. A year later, the stock had returned over 150%.
The ten-year-old Capesize was worth $19 million in March 2020. It was worth $33 million in 2022.
This white paper is for educational and informational purposes only. Fleet valuation data is sourced from Baltic Exchange Sale and Purchase Assessments, VesselsValue.com broker methodology, Clarkson Research Services, and Xclusiv Shipbrokers as cited in Lloyd’s List and Seatrade Maritime reporting. Diana Shipping fleet book value data is drawn from the company’s Form 20-F filings with the SEC for the relevant years. The Fleet NAV methodology and specific transaction prices cited are consistent with documented sources including Value Investor’s Edge and contemporaneous shipping industry publications. The Mineral Shougang International transaction price is sourced from Lloyd’s List citing shipbroker reports for late 2025. Nothing herein constitutes investment advice.
If you like this read, check out my other reads below 👇
Rust, Rigs, and the Recurring Revenue Hidden in Plain Sight: A Deep Dive into Beng Kuang Marine (SGX: BEZ)

The Old Steel and the Sea: Why You Should Care About a Ship Maintenance Company
Investment Reflection #2 — The Grand Play: 100 Years of the World’s Nations as Characters in the Greatest Story Ever Told

“The world is not a chessboard. It is a living organism, where every cell — every nation — eats, competes, cooperates, and occasionally tries to eat the others. Understanding it requires not just memorizing moves, but understanding hunger.”

The Tide Is Going Out: Commodity Houses, Private Credit, and the AI Debt Bomb

Start Here: What This Article Is About
Why I Passed on Graftech (EAF): Riding The Battery Hype, Or Perhaps Not...

There is a kind of company that is the most dangerous thing in investing. It is not the fraudulent company. It is not the obviously bad company with terrible products and incompetent management. Those are easy — you just avoid them. The truly dangerous company is the one with a
The Beautiful Trap: Why I'm Passing on The Hour Glass (SGX: AGS)

There’s a peculiar kind of investment that keeps you up at night — not because it’s bad, but because it’s genuinely good. Good enough to admire. Not good enough to buy.
The Diamond in the Rough That Isn't Quite Yours: Why I Passed on Boustead (SGX: F9D)

There is an old saying that investors have borrowed, bent, and quoted so many times it has nearly lost its sharpness: a bird in the hand is worth two in the bush. Warren Buffett, characteristically, gave it a precise mathematical form. The value of any investment, he wrote, is determined by three questions:
The Schoolteacher's Secret Insurer: Why Horace Mann (NYSE:HMN) Is Sitting on My Watchlist

“The stock market is a device for transferring money from the impatient to the patient.” — Warren Buffett

The Dormitory King That Couldn't Leave Home: Why I Passed on Centurion (SGX: OU8)

There is a deceptively simple question that Warren Buffett borrowed from Aesop’s ancient fable, and has repeated across decades of shareholder letters: “How many birds are in the bush? How sure are you they’re there? And how long until you get them out?”
The Children's Place: A $90 Million Bet on a Company That Used to Be Worth $2 Billion (NYSE: PLCE)

There is a classic scene in every heist movie. The detective walks into a room, sees the chalk outline, the scattered evidence, the broken window, and immediately knows something went terribly wrong long before anyone called the police. You do not need the full autopsy report to read the body.
World War 3 In Iran and Why Oil Price Will Continue Increasing — It Arrived Sooner Than Anyone Expected

This is Part 2 of a continuing analysis of California Resources Corp (CRC). Part 1 built the foundational investment case: a company trading at $44 per share against a conservative intrinsic value of $108–$156, built on 567 million barrels of proved developed oil reserves in California, and a management team spending hundreds of millions buying back its…
The Most Overlooked Oil Company in America — And Why That Might Be the Opportunity of the Decade

Date of analysis: 28 December 2025
The Art Of Saying No - MYPS: Playstudios Inc

PLAYSTUDIOS (MYPS) is a Las Vegas-based mobile gaming company that operates free-to-play social casino games and a loyalty platform called playAWARDS, which lets players redeem points for real-world rewards at places like MGM Resorts, Norwegian Cruise Line, and Wolfgang Puck restaurants. On the surface, this sounds like a clever moat. A loyalty program.…
The Art Of Saying No - UGP: Ultrapar Participacoes S.A (Part 2 of 2)

Question 2: How Certain Are You?
The Art Of Saying No - GLIBK: GCI Liberty Inc

Picture this: a single telecommunications company — the dominant one — serves over 200 communities scattered across the largest state in the United States. Alaska. A state with just over one person per square mile. A state where 39% of residents are underserved by broadband. A state where, until recently, some villages received internet via satellite li…

The Art Of Saying No - UGP: Ultrapar Participacoes S.A (Part 1 of 2)

The Setup: A Value Investor Dream?


The Art of Saying No - RIG: Transocean LTD

“The difference between successful people and really successful people is that really successful people say no to almost everything.” — Warren Buffett
The Art of Saying No - KPRX: Kiora Pharmaceuticals Inc

“The difference between successful people and really successful people is that really successful people say no to almost everything.” — Warren Buffett
The Art of Saying No - DNUT: Krispy Kreme Inc

“The difference between successful people and really successful people is that really successful people say no to almost everything.” — Warren Buffett

🎓 A Business Strategy Primer Part 7 - Learning From Great Companies

The Billion-Dollar Playbook: How Market-Based Management Powered Koch Industries’ Unstoppable Rise
The Art of Saying No - MRX: Marex Group PLC

“The difference between successful people and really successful people is that really successful people say no to almost everything.” — Warren Buffett


The Art of Saying No - SFIX: Stitch Fix Inc

“The difference between successful people and really successful people is that really successful people say no to almost everything.” — Warren Buffett
🎓 A Business Strategy Primer Part 2 - Brainstorming Solutions With Value At The Core

Creating An Irresistible Offer
The Art of Saying No - TDOC: Teladoc Health Inc

“The difference between successful people and really successful people is that really successful people say no to almost everything.” — Warren Buffett

The Art of Saying No - MDU: Mdu Resources Group Inc

“The difference between successful people and really successful people is that really successful people say no to almost everything.” — Warren Buffett


The Art of Saying No - AFCG: Advanced Flower Capital Inc

“The difference between successful people and really successful people is that really successful people say no to almost everything.” — Warren Buffett
The Art Of Saying No - VYX: NCR Voyix Corp

“The difference between successful people and really successful people is that really successful people say no to almost everything.” — Warren Buffett
The Art of Saying No - VSTS: Vestis Corp

“The difference between successful people and really successful people is that really successful people say no to almost everything.” — Warren Buffett

🛢️Basic Energy Primer Part 2 - Business and Competitive Landscape

The Man Who Bet Everything on Being Wrong
The Art of Saying No - CISS: C3is Inc

“The difference between successful people and really successful people is that really successful people say no to almost everything.” — Warren Buffett
The Art of Saying No - PSHG: Performance Shipping Inc

“The difference between successful people and really successful people is that really successful people say no to almost everything.” — Warren Buffett

The Art Of Saying No - MAGN: Magnera Corp

The Magnera Corporation Analysis Nobody Asked For (But Everyone Needs)
The Art of Saying No - CHR: Cheer Holding Inc

“The difference between successful people and really successful people is that really successful people say no to almost everything.” — Warren Buffett
The Art of Saying No - WIMI: WiMi Hologram Cloud Inc.

“The difference between successful people and really successful people is that really successful people say no to almost everything.” — Warren Buffett
⚡️Alternative Energy Primer Part 3 - Industry and Sector Technicals

The €2.2 Billion Mistake That Revealed Everything
⚡️Alternative Energy Primer Part 2 - Business & Competitive Landscape

The Shipwreck That Changed Everything

🏥 A U.S. Health Insurance (Managed Care Organizations) Sector Primer

1️⃣ Industry Fundamentals & Macro View

