
PART I: WHAT COPPER ACTUALLY IS, AND WHY IT CANNOT BE SUBSTITUTED AWAY
The Invisible Infrastructure of Civilisation
Before any valuation, you need to understand why copper is not a commodity in the same sense as soybeans or newsprint. Soybeans can be substituted with other oil seeds; newsprint has been replaced by digital media. Copper has not been replaced by anything in two thousand years of commercial use, and there is no credible candidate to replace it in the next two decades — precisely the period when demand is projected to grow most aggressively.
Copper is the second-best electrical conductor among practical metals, behind only silver. Silver is 70 times rarer and priced accordingly. Every wire that carries electricity in your home, your car, your phone, and the power grid connecting your city uses copper because nothing else performs the same function at a comparable cost. Copper is also the best thermal conductor in the price range that makes it useful for heat exchangers, motors, and industrial machinery. It does not corrode in water the way iron does. It can be drawn into extremely thin wire without breaking. It can be alloyed with zinc to make brass or with tin to make bronze. It has natural antimicrobial properties that make it useful in medical and food environments. The list of applications is not a marketing document — it is an engineering reality that has been tested and refined over two millennia.
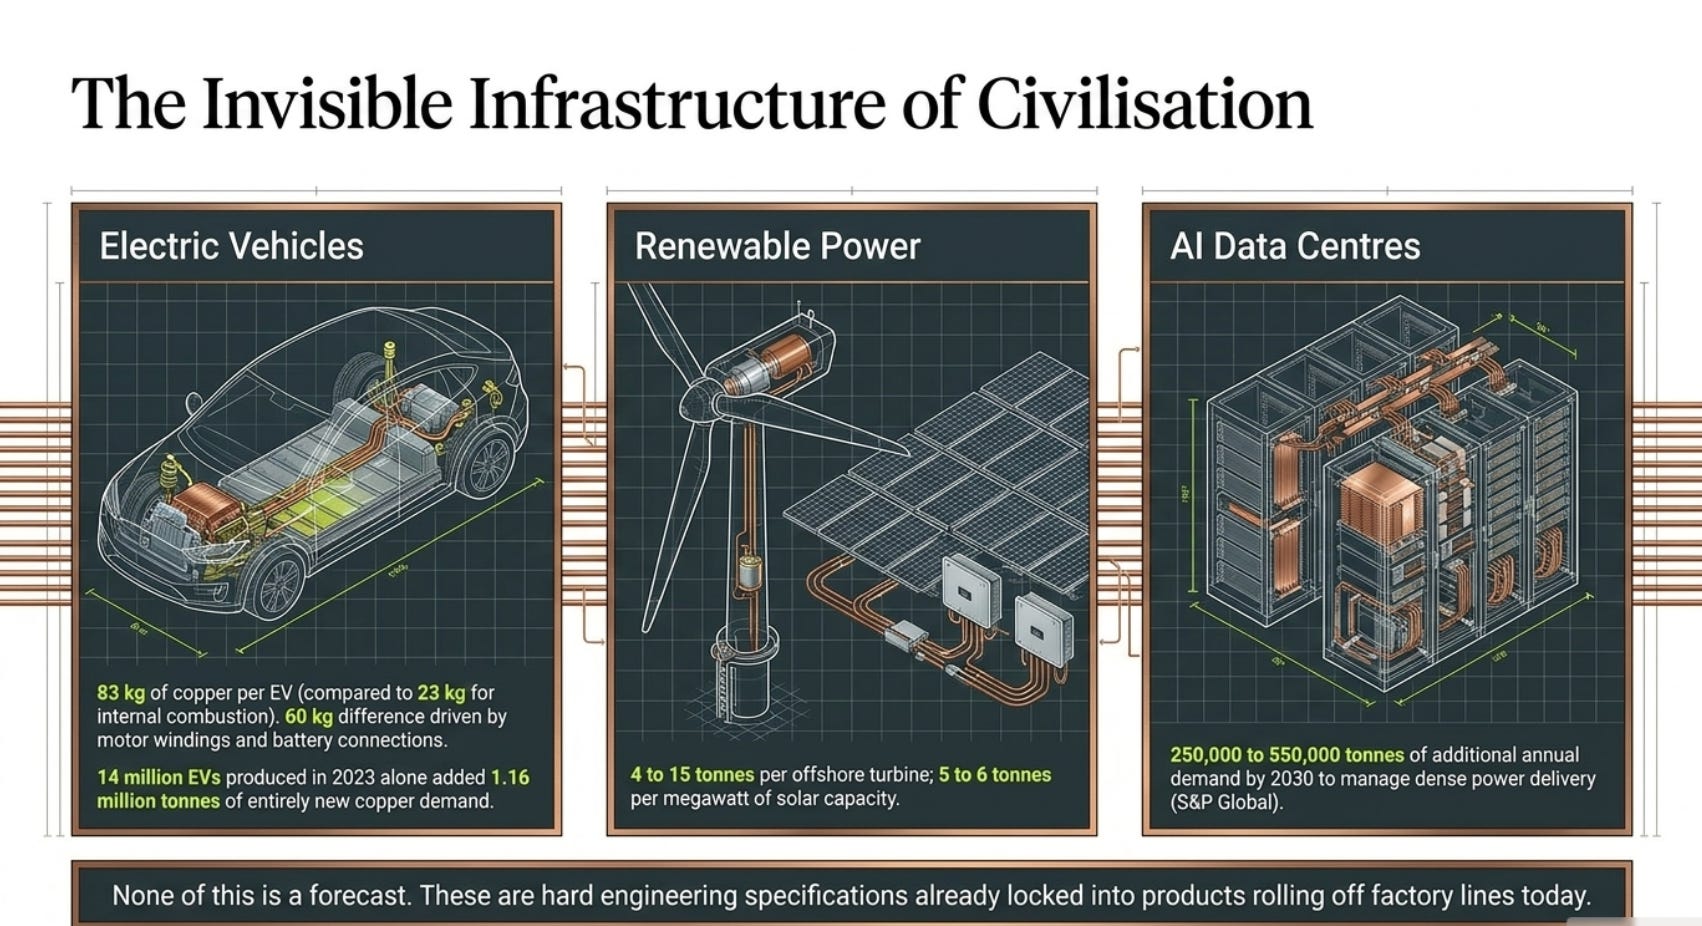
An electric vehicle contains approximately 83 kilograms of copper, compared to roughly 23 kilograms in a conventional internal combustion vehicle. The difference — 60 kilograms per vehicle — is driven by the copper in the electric motor windings, the battery pack connections, the onboard charger, the power electronics, and the wiring harness. A single offshore wind turbine requires approximately 4 to 15 tonnes of copper in its windings, cables, and transformer connections. A solar farm requires 5 to 6 tonnes of copper per megawatt of generating capacity. A grid-scale battery storage facility requires copper in its busbars, cables, and control systems. Artificial intelligence data centers, which require dense, reliable power delivery to thousands of processors, are estimated by S&P Global to need 250,000 to 550,000 tonnes of copper per year by 2030 — entirely additional demand that did not exist five years ago.
None of this is a forecast about the future. It is a description of specifications that are already locked into products being manufactured today. The EV that rolls off a factory line tomorrow contains its 83 kilograms of copper already. The offshore wind turbine ordered last year is being built with its 15 tonnes of copper now. The demand exists. The question is only whether the supply will be there to meet it.
The Discovery Problem Nobody Talks About
Here is the single most important structural fact about copper that financial analysts consistently under-weight, and that business owners who have spent time in the mining industry understand immediately: copper deposits are extraordinarily hard to find, and the industry has effectively stopped finding them.
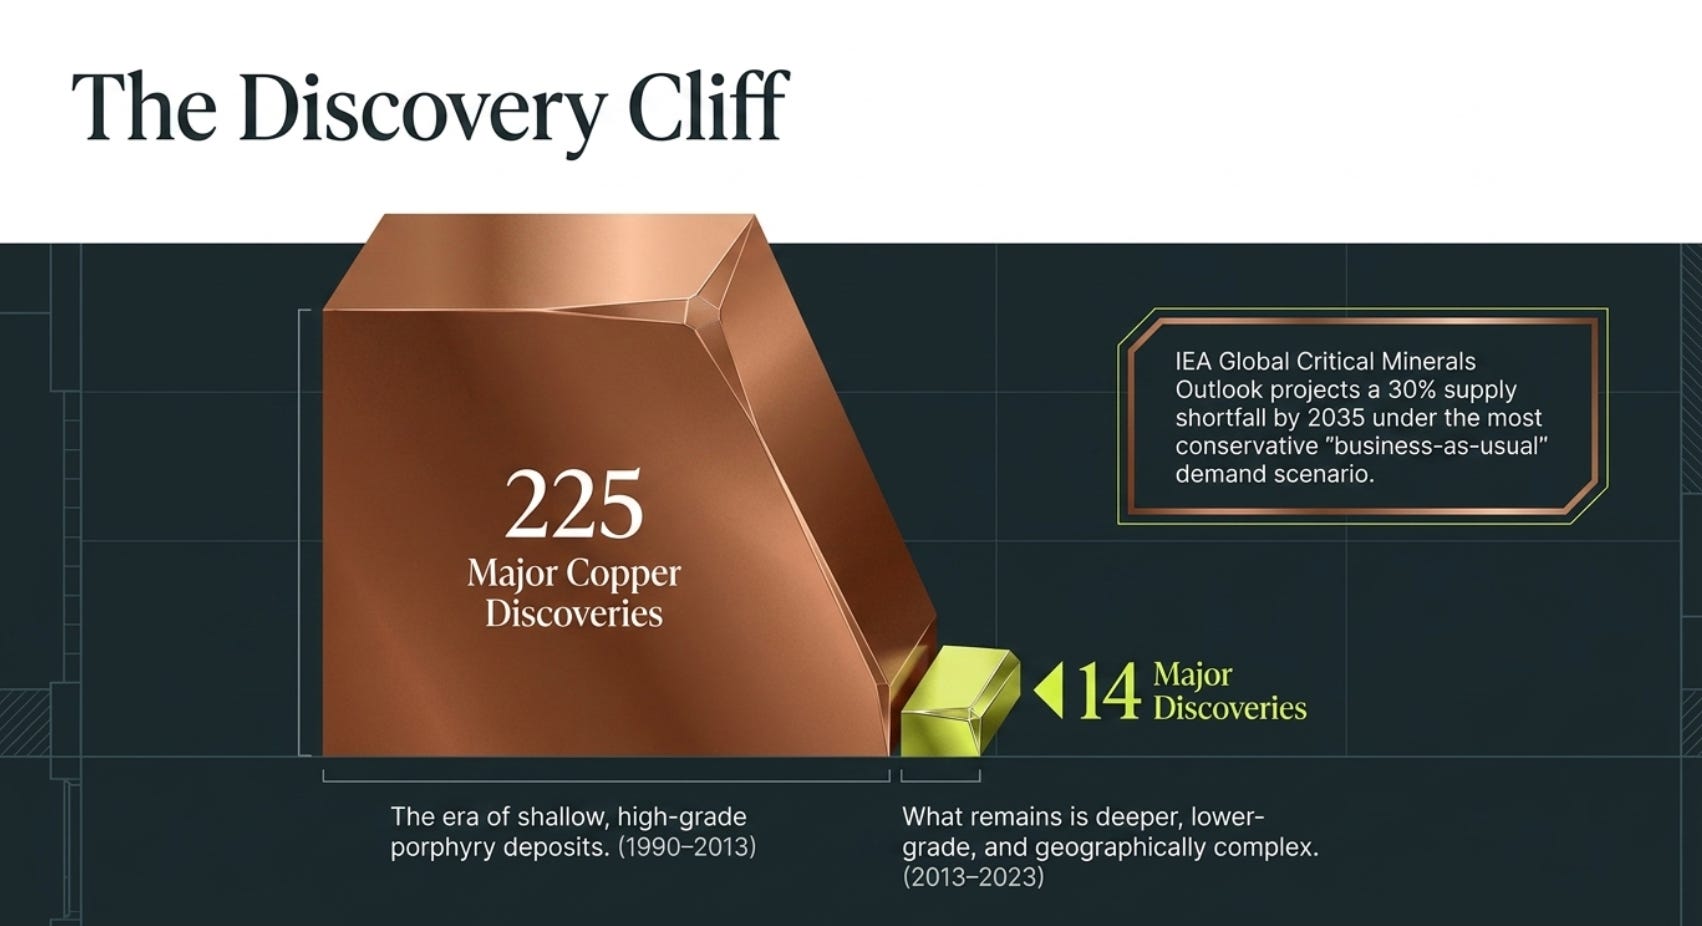
S&P Global Market Intelligence has tracked major copper discoveries for decades. Between 1990 and 2013 — a period of 23 years — the global mining industry made 225 major copper discoveries. In the decade from 2013 to 2023, the same industry made exactly 14 major discoveries. Not 14 per year. Fourteen total, in a decade. This is not a temporary statistical fluctuation. It reflects a fundamental reality: the accessible, high-grade porphyry copper deposits at shallow depths in politically stable jurisdictions were found and developed in the 20th century. What remains is harder to find, deeper, lower-grade, and more likely to sit under contested land or within environmentally sensitive terrain. The IEA’s Global Critical Minerals Outlook 2025 projects a 30 percent supply shortfall by 2035 under the Stated Policies Scenario — meaning the most conservative, business-as-usual demand case still produces a 30 percent deficit. The IEA’s executive director Fatih Birol stated plainly at the UK Critical Minerals Summit in late 2025: “Copper is the one we’re really concerned about. This is a really challenging mineral to ramp up supply quickly.”
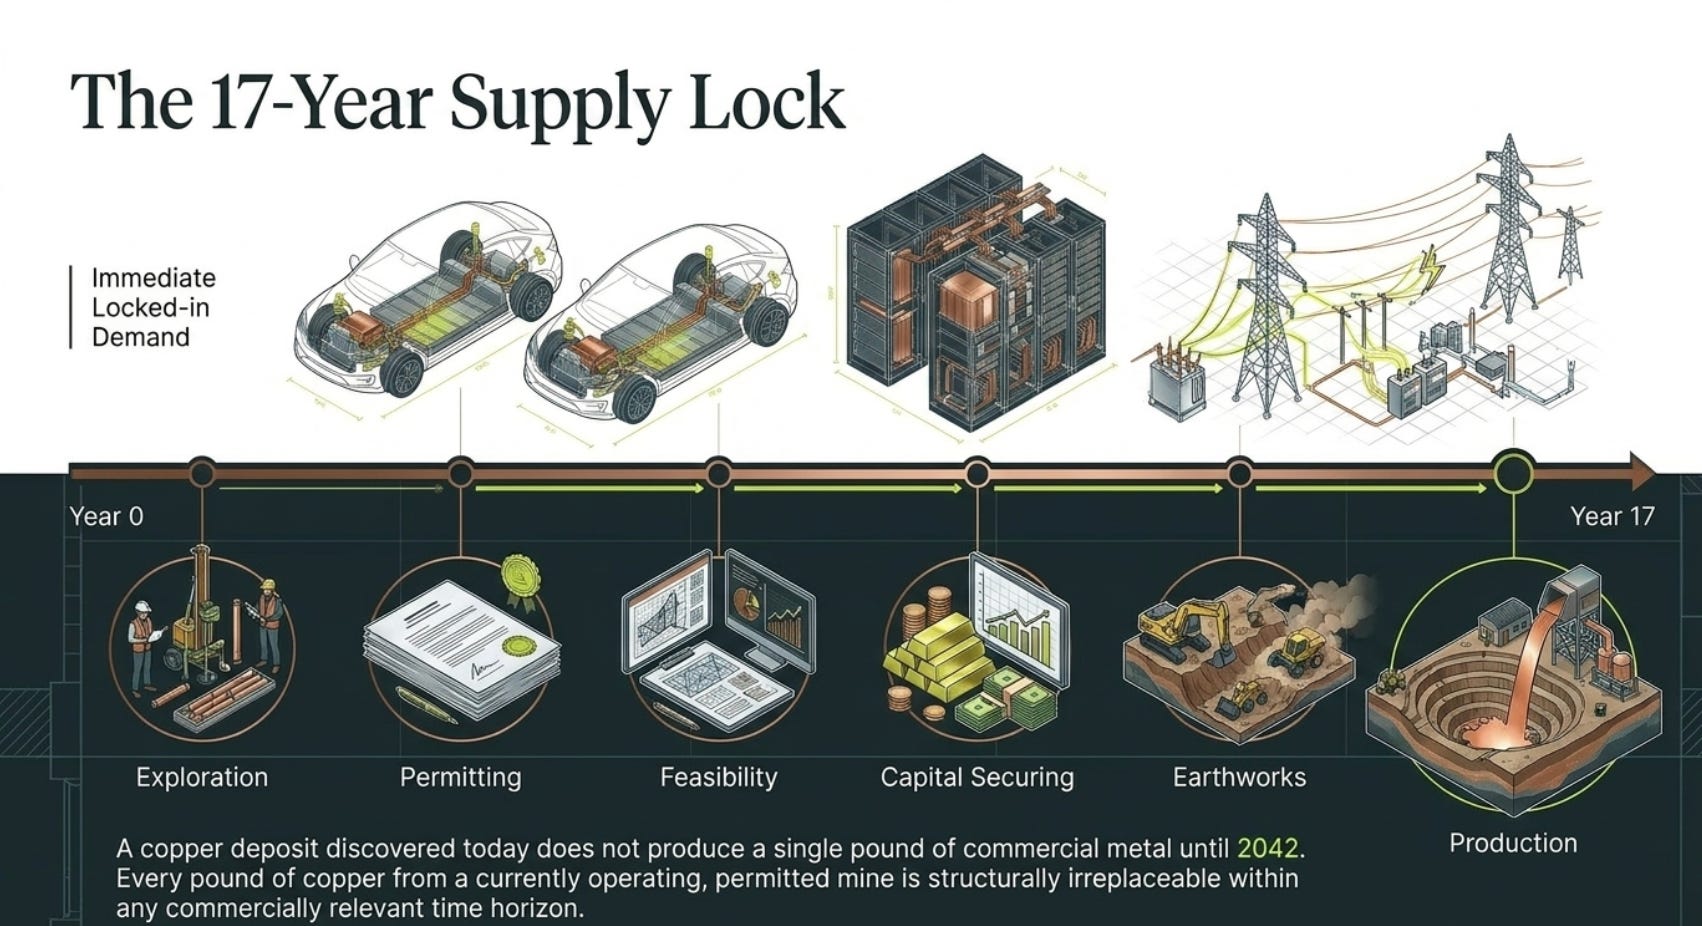
And from discovery to production, a new copper mine now takes an average of 17 years. That is not a guess — it is the documented average calculated from IEA data and cited separately by S&P Global, Sprott, and multiple independent analyses. A deposit found today does not produce a single pound of commercial copper until 2042. Every pound of copper from an existing, operating mine is therefore more valuable today than it would be in a world where new mines could be brought online quickly. It cannot be replaced quickly. The ore bodies that already exist — already drilled, already permitted, already producing — are, in a very precise sense, irreplaceable within any commercially relevant time horizon.
PART II: THE OWNER’S VALUATION — POUNDS IN THE GROUND AT TODAY’S PRICE
The Arithmetic a Geologist Understands and a Spreadsheet Misses
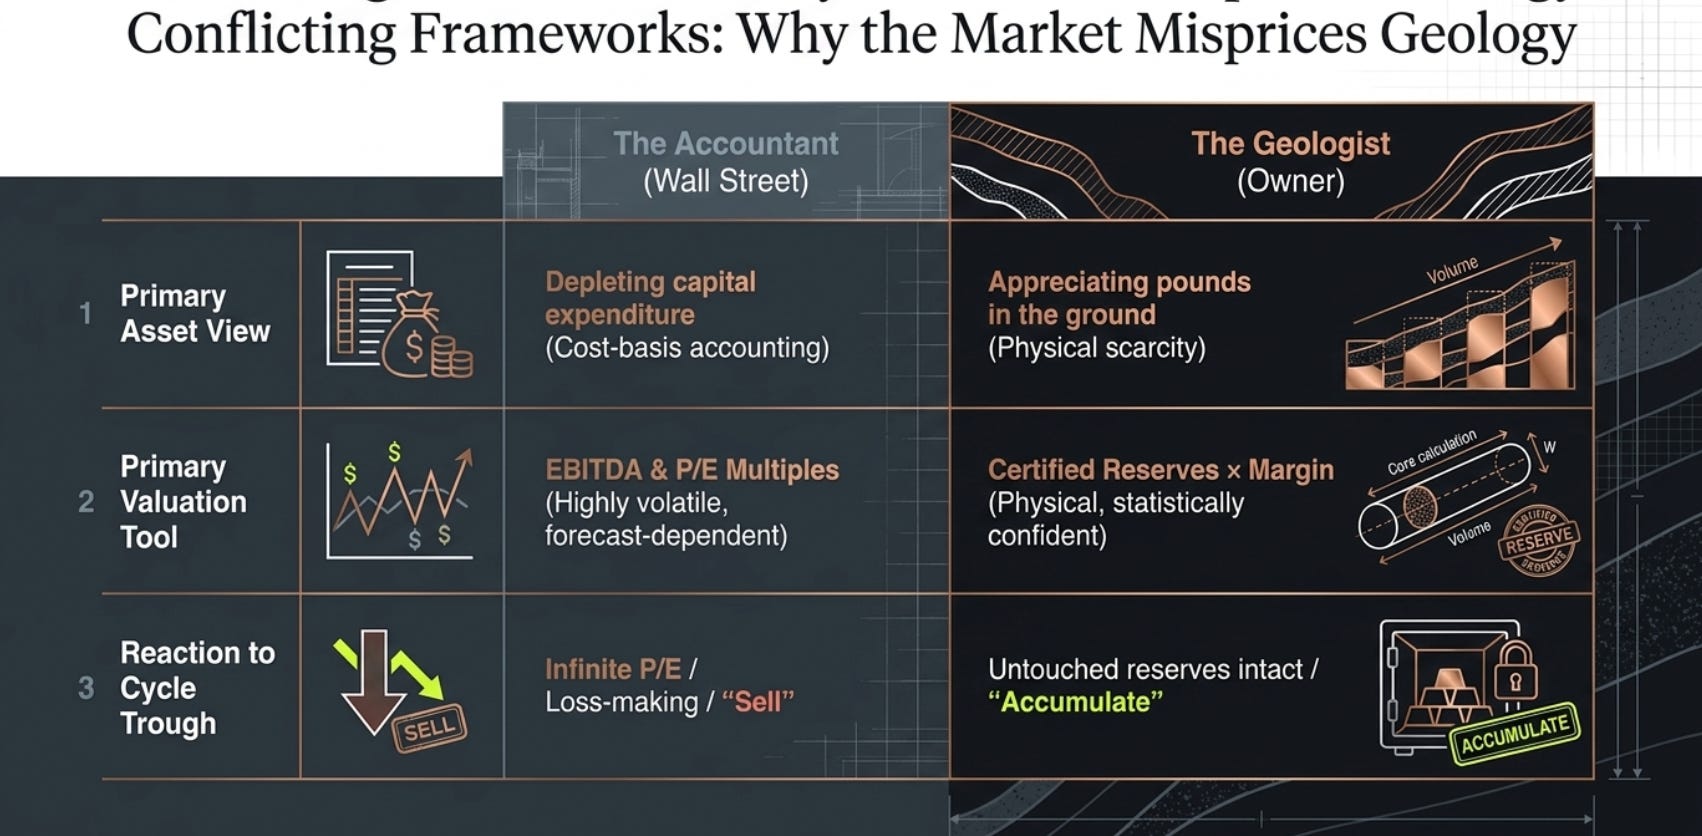
The owner’s valuation methodology for a copper mining company is not complicated. What makes it powerful is what it excludes: no forecast of future copper prices, no assumption about future demand growth, no model of what the stock “should” trade at relative to its peers. Just the existing certified reserve, the current cost to extract it, and the current price the market pays.
The four inputs:
The first input is the certified reserve base — proven and probable mineral reserves of copper, measured in pounds or tonnes of contained copper, certified by independent qualified persons under NI 43-101 (Canada), JORC (Australia), or SEC Industry Guide 7 (United States). These are not estimates or guesses. They are statistically confident calculations based on drill hole density, grade interpolation, and mine engineering, published in annual technical reports audited by independent geological firms.
The second input is the C1 cash cost per pound — the direct cost of mining, milling, and smelting copper to produce a saleable concentrate or refined metal, net of any gold or silver byproduct credits. For open-pit porphyry copper operations — the predominant mine type for large-scale producers — industry-disclosed C1 cash costs typically range from $1.50 to $2.00 per pound, based on disclosed All-In Sustaining Cost (AISC) figures from operating company annual reports. Lower-cost operations like Codelco’s El Teniente or Freeport’s Grasberg can operate below $1.50/lb. Higher-cost, lower-grade open-pit operations approach $2.50/lb before sustaining capital.
The third input is the current copper spot price. As of early 2026, copper was trading in the range of $4.20 to $4.50 per pound on the COMEX, with an all-time intraday high of $6.61 per pound reached on January 29, 2026 during a speculative surge. A business owner uses the mid-cycle, steady-state price — not the peak, not the trough, but what the market has consistently cleared at in recent years. Using $4.25/lb as a reference is conservative by 2026 standards.
The fourth input is the net margin per pound: price minus cash cost. At $4.25/lb price and $1.75/lb cost, the net margin is $2.50/lb.
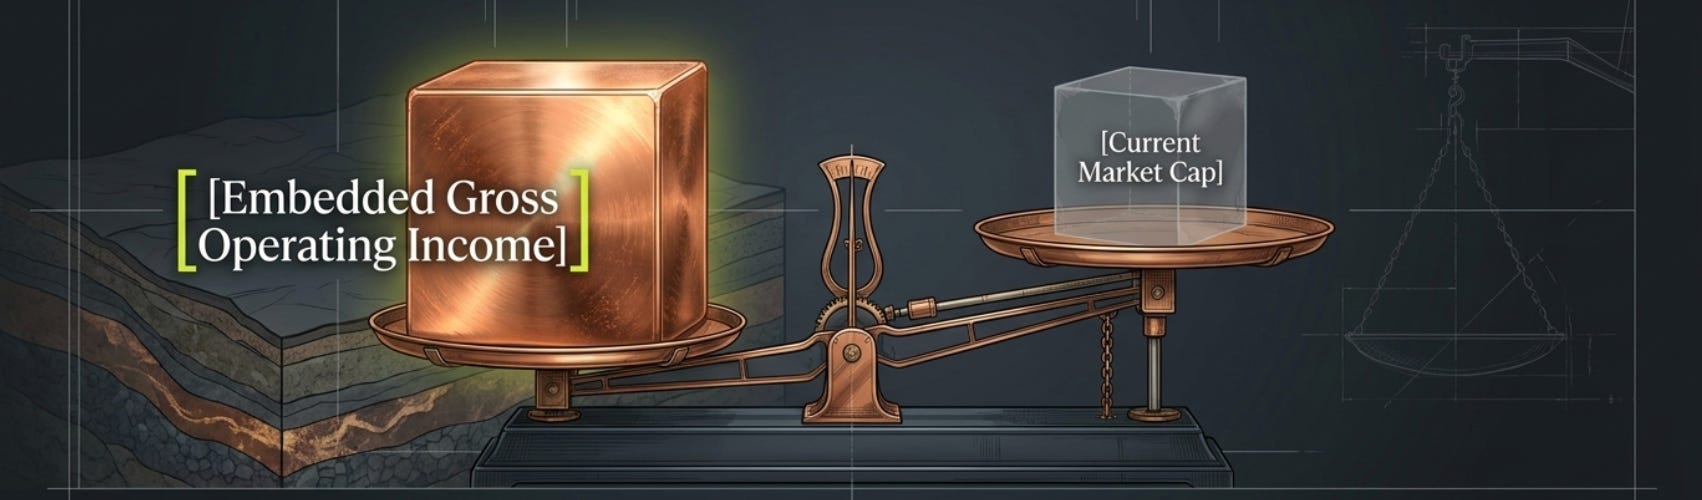
The calculation for Freeport-McMoRan: Freeport disclosed approximately 104 billion pounds of copper in proven and probable reserves in its 2023 10-K filing. Apply $2.50/lb net margin. The total gross operating income embedded in the existing reserve base is approximately $260 billion — calculated entirely at current prices, current costs, from mines already in production, without a single new exploration dollar. Freeport’s market capitalization as of early 2026 was approximately $55 to $65 billion. The arithmetic says: you are paying 25 cents for every dollar of gross operating income embedded in a certified, producing reserve base. The stock’s P/B ratio of approximately 4.18x makes it look expensive on a book value basis. But the book value has no relationship to the reserve value — it is the depreciated cost of building the mine, not the value of the copper in the ground.
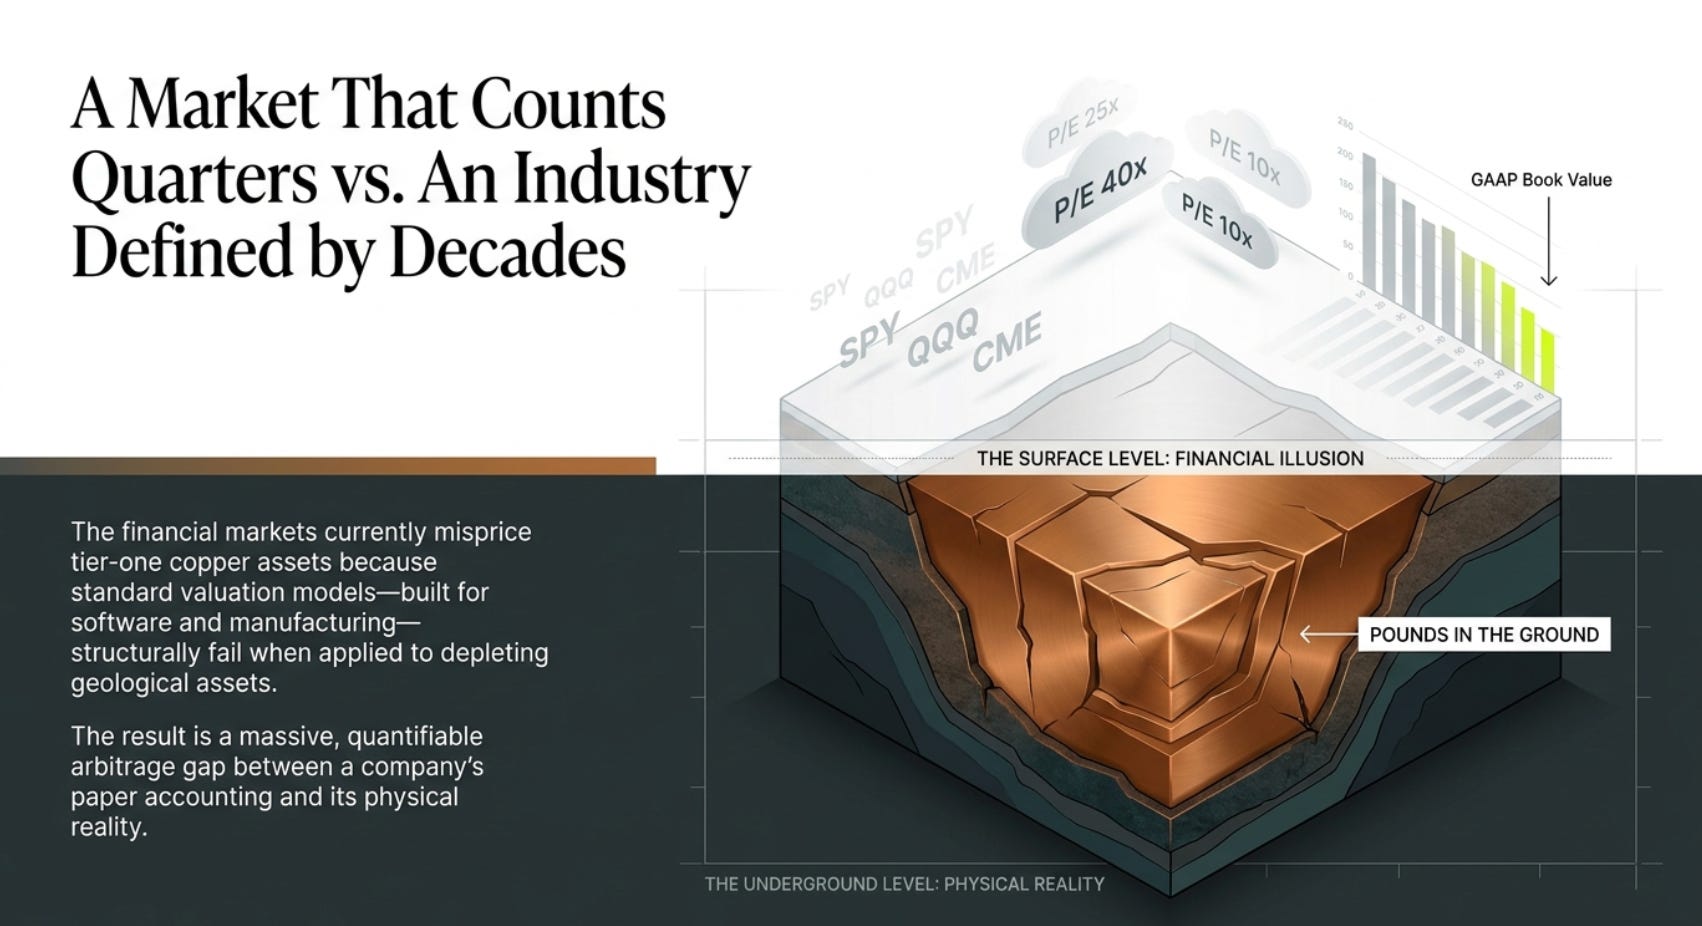
This is the gap. Not a forecast gap. Not a DCF gap. A gap between what is physically in the ground at current prices and what the balance sheet acknowledges. It is $260 billion versus a $60 billion market cap. The market is not pricing it literally — other factors, including discount rates, extraction sequencing, and the 25-year extraction timeline, explain much of the divergence. But the fundamental point holds: the accounting records the cost of building the mine, and the owner counts the value of what the mine contains.
For smaller producers, the gap is proportionally more acute and more exploitable. This is the real opportunity.
PART III: GAAP AND THE MINE THAT AGES BACKWARDS
What the Accountant Sees
Under US GAAP (ASC 360, PP&E with extractive industry guidance) and IFRS (IFRS 6 for exploration, IAS 16 for development assets), mineral reserves are never recognized as assets at fair value. The ore body — the billions of pounds of copper that an independent geological firm has certified through years of drilling and analysis — does not appear on the balance sheet as an asset. What appears instead is the cost of developing access to that ore body: the exploration drilling, the shaft sinking, the open pit earthworks, the processing plant, the infrastructure. These costs are capitalized as PP&E and then depleted against production using the Units of Production method.
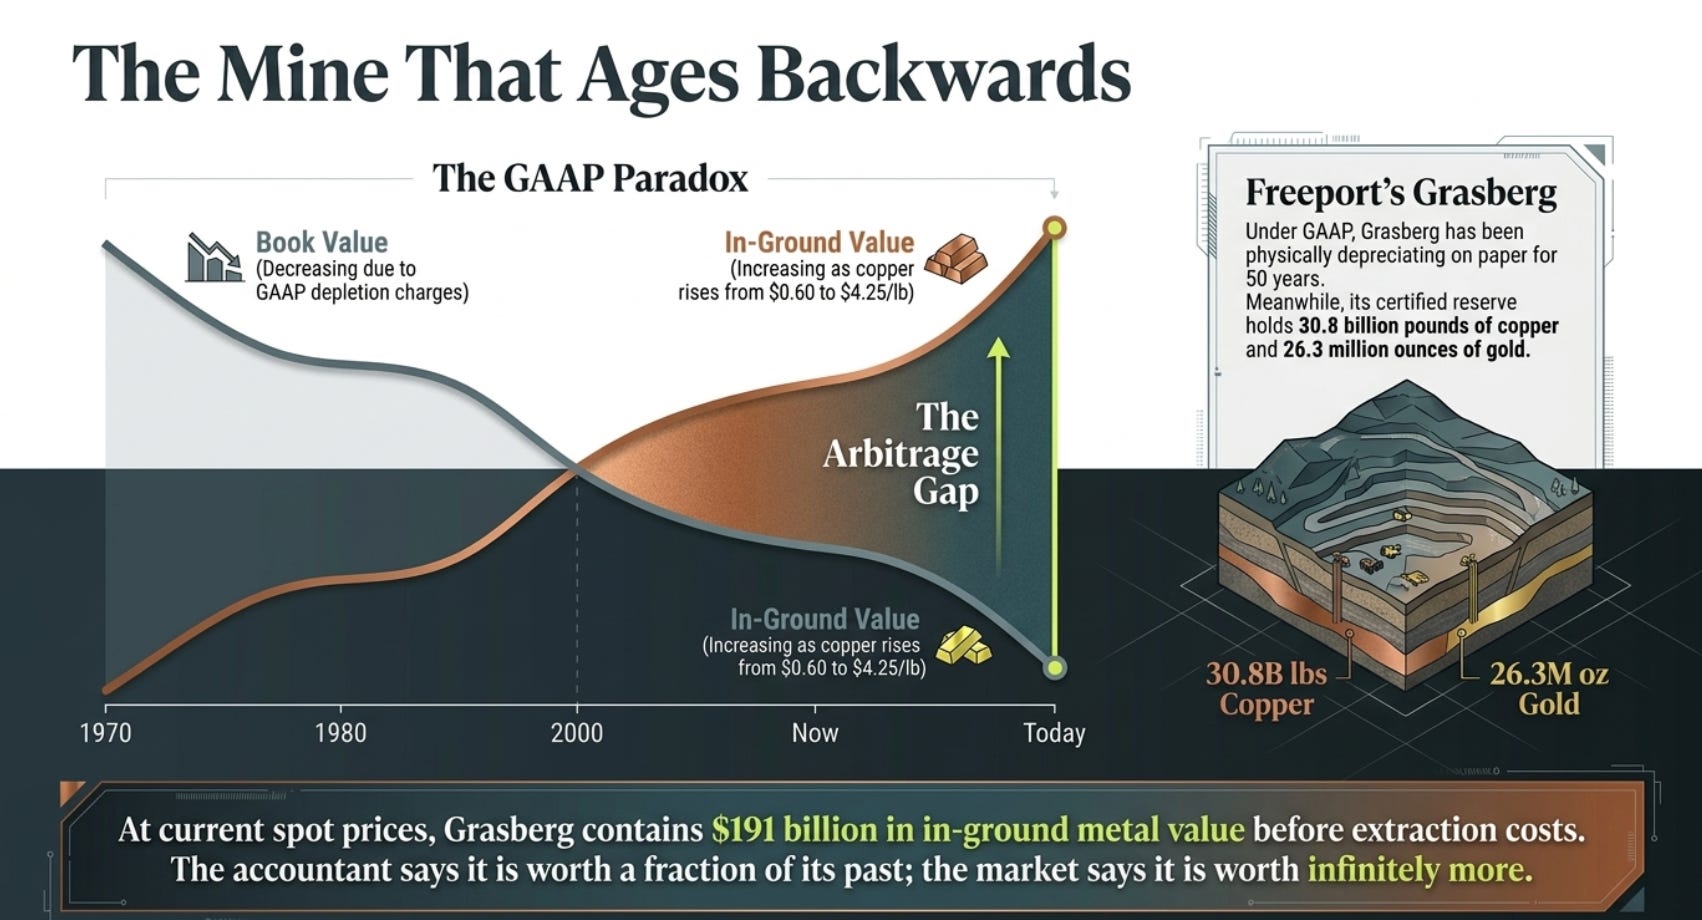
This creates an accounting paradox that every mining analyst knows but that financial models fail to handle properly. As production continues, the book value of the mine declines — because accumulated depletion charges reduce the carrying value of the capitalized development costs. But the ore body does not necessarily become less valuable as production progresses. If copper prices rise, the remaining ore becomes worth more per pound, not less. The mine is getting “cheaper” on the balance sheet precisely when the copper it contains may be getting more valuable in the market.
The Grasberg mine in Papua, Indonesia, illustrates this in almost comical terms. Freeport-McMoRan and its predecessor entities began developing Grasberg in the late 1960s and 1970s, at copper prices that were a fraction of current levels. The ore body’s current proven and probable reserves, as of December 31, 2022, included 30.8 billion pounds of copper and 26.3 million ounces of gold, per the Grasberg Wikipedia disclosure sourced from Freeport’s own filings. The current in-ground value of that copper at $4.25/lb — before deducting a single dollar of production cost — is approximately $131 billion. The current in-ground value of the gold at $2,300/oz is approximately $60 billion. Combined: roughly $191 billion in in-ground metal value at a single mine complex.
Freeport’s 48.77% interest in PT Freeport Indonesia (the operating entity) — secured through a decade-long negotiation with the Indonesian government that concluded in 2018, when Indonesia required a 51.23% divestment in exchange for a 20-year permit extension to 2041 — carries a net book value on Freeport’s consolidated balance sheet that is a fraction of the in-ground metal value. It reflects decades of partially depleted development cost at 1970s through 1990s capital expenditure levels. The mine has been physically depreciating on paper for 50 years. The ore body it accesses has been appreciating economically as copper prices rose from $0.60/lb in the 1990s to $4.25/lb today.
That is the GAAP paradox in its most extreme form. The accountant says the mine is worth less than it used to be. The copper market says it is worth more.
PART IV: THE MARKET’S PREFERRED TOOLS AND WHY THEY FAIL HERE
Why Earnings Multiples Cannot Measure a Mine
When a sell-side analyst publishes a price target on a copper producer, the mechanics are typically straightforward: take the forecast copper price for the next 12 months, build a revenue model, subtract estimated operating costs to get EBITDA, apply a sector multiple to EBITDA, and arrive at a valuation. This is how most industrial companies are priced, and in most industrial companies, it works reasonably well because the company’s primary assets — equipment, inventory, customer relationships — have some relationship to current earnings.
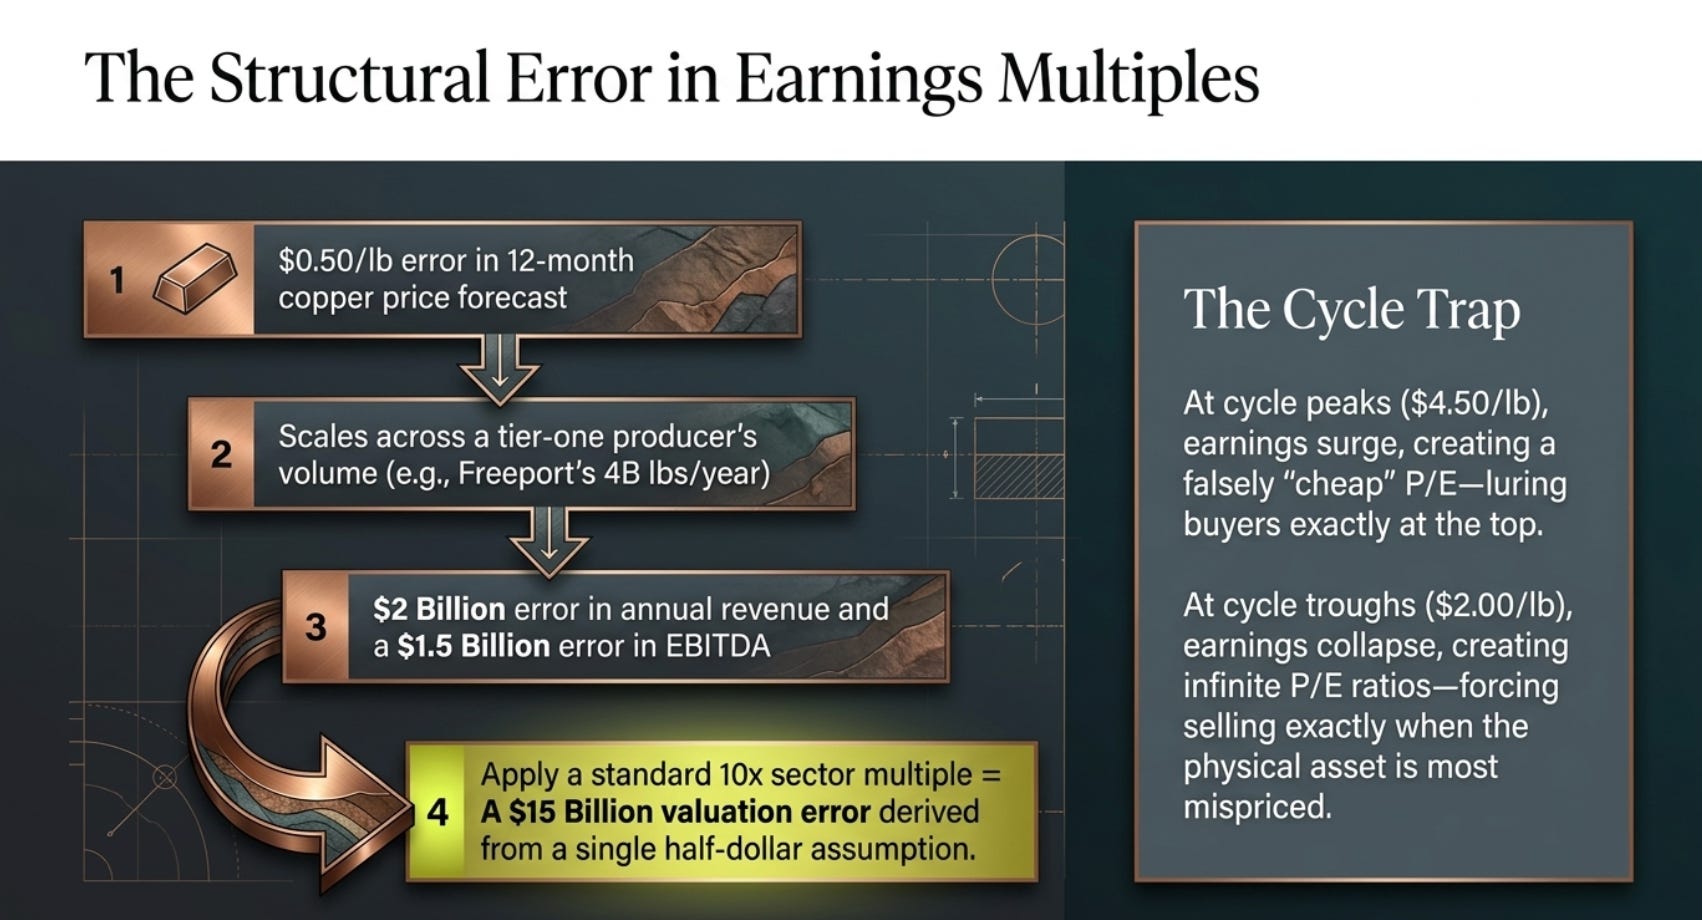
For copper miners, the methodology introduces a structural error that compounds with every step. The copper price forecast is the most uncertain variable in the model, and it is also the variable to which the output is most sensitive. A $0.50/lb error in the copper price assumption — well within the range of error in any 12-month commodity forecast — translates, at Freeport’s production scale of approximately 4 billion pounds per year, into a $2 billion error in annual revenue and roughly a $1.5 billion error in EBITDA. Apply a 10x EBITDA multiple and you have a $15 billion error in the valuation from a single half-dollar assumption on the copper price. The model’s precision — to two decimal places on the price target — vastly overstates its accuracy.
At a cycle peak, when copper is at $4.50/lb, the earnings model produces a low-looking P/E because earnings have surged. Investors believe the stock is cheap and buy. But the earnings at $4.50/lb are not sustainable at the same cost structure — when copper falls back to $3.00/lb, earnings collapse, and investors who bought the “cheap” P/E discover they were buying at a peak. The earnings multiple was a perfect contrary indicator.
At a cycle trough, when copper is at $2.00/lb, the earnings model shows losses or near-zero earnings. P/E is infinite or irrelevant. The consensus is bearish. The stock is sold. But an owner looking at the certified reserve base — 3 billion pounds of copper at a production cost of $1.75/lb, selling at $2.00/lb — sees a thin margin on a large volume, from an asset that will still be in the ground when prices recover. The trough earnings tell you nothing about the asset’s value. They tell you about the current commodity price, which is a temporary state that has historically lasted 18 to 36 months before reverting.
PART V: STORIES FROM THE GROUND — THREE CASE STUDIES IN COPPER VALUE ARBITRAGE
Case Study 1: The Mountain That Swallowed Freeport — The 2015 Crisis and What It Revealed
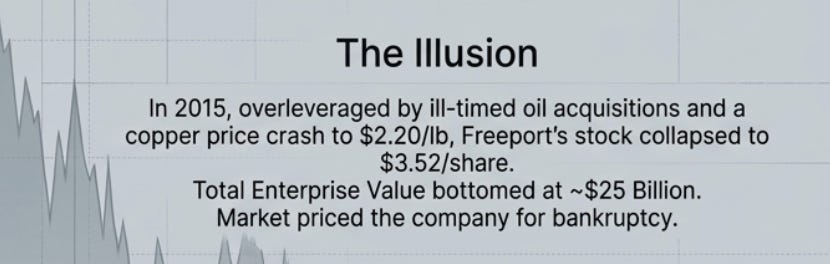
The year 2015 was, in many ways, the darkest in Freeport-McMoRan’s corporate history. In 2012 and 2013, at the height of the previous copper bull run, Freeport had made two large acquisitions — Plains Exploration & Production and McMoRan Exploration — for a combined $9 billion, adding oil and gas assets to its copper and gold portfolio. The acquisitions were timed at exactly the wrong moment, just as the commodity cycle was turning. By 2015, copper had fallen from its 2011 peak of $4.65/lb to below $2.20/lb. Oil had crashed simultaneously, compounding the damage to the newly acquired energy business. Freeport’s total debt had ballooned to approximately $20 billion. The stock, which had traded above $55 per share in 2011, fell to approximately $3.50 per share in January 2016. The market capitalization had collapsed from roughly $50 billion at its peak to approximately $5 billion. The company was being priced as if it might not survive.
At the nadir of $3.52 per share in early 2016, Freeport’s total enterprise value — market cap plus net debt — was roughly $25 billion. The company’s proven and probable copper reserves at that time were approximately 100+ billion pounds. Apply the owner’s arithmetic: at $2.00/lb copper and $1.75/lb cash cost, the net margin per pound was $0.25. Total operating income embedded in the reserve base at trough prices: approximately $25 billion. The market was pricing the company at exactly the cash-on-cash value of its entire certified reserve base at the absolute bottom of the copper price cycle — and assigning zero residual value to the oil and gas business, the gold production at Grasberg, the corporate franchise, the management team, and the future exploration inventory.
What did the ore body say in response? Nothing. It was unchanged. The same mountains in Papua, Arizona, New Mexico, and Peru contained the same copper they had always contained. The ore grades certified by independent engineers had not moved. The infrastructure to mine and process the ore was intact and operational. The only thing that had changed was the market price of copper — a temporary condition driven by Chinese growth concerns, a surging US dollar, and commodity fund liquidation, none of which had any bearing on the geology of the Grasberg district or the Morenci open pit in Arizona.
Freeport’s survival required asset sales, equity dilution, and the painful disposal of the oil and gas business at distressed prices. These were real costs imposed by overleveraging at cycle peak — a lesson in capital structure discipline that has nothing to do with asset quality. The copper ore bodies were not impaired. By 2022, when copper reached $4.65/lb again, Freeport’s stock had recovered to over $50 per share — a 14x return from the $3.52 trough. The copper was always there. The market had priced it as if it wasn’t.
The lesson here is not simply that copper prices recover — they do, and they always have. The lesson is more specific: the ore body, the physical asset, was never worth $3.50 per share. Not even close. The balance sheet, battered by debt and impairments, said one thing. The pounds in the ground said another. An owner who ignored the earnings and debt spiral and looked only at the certified reserves, the C1 cash cost, and the physical impossibility of replacing 100 billion pounds of tier-one copper geology in the current market — that owner was buying something real at a price that reflected temporary fear rather than permanent impairment.

Case Study 2: Taseko’s Gibraltar Mine — The Canadian Porphyry That the Market Forgot
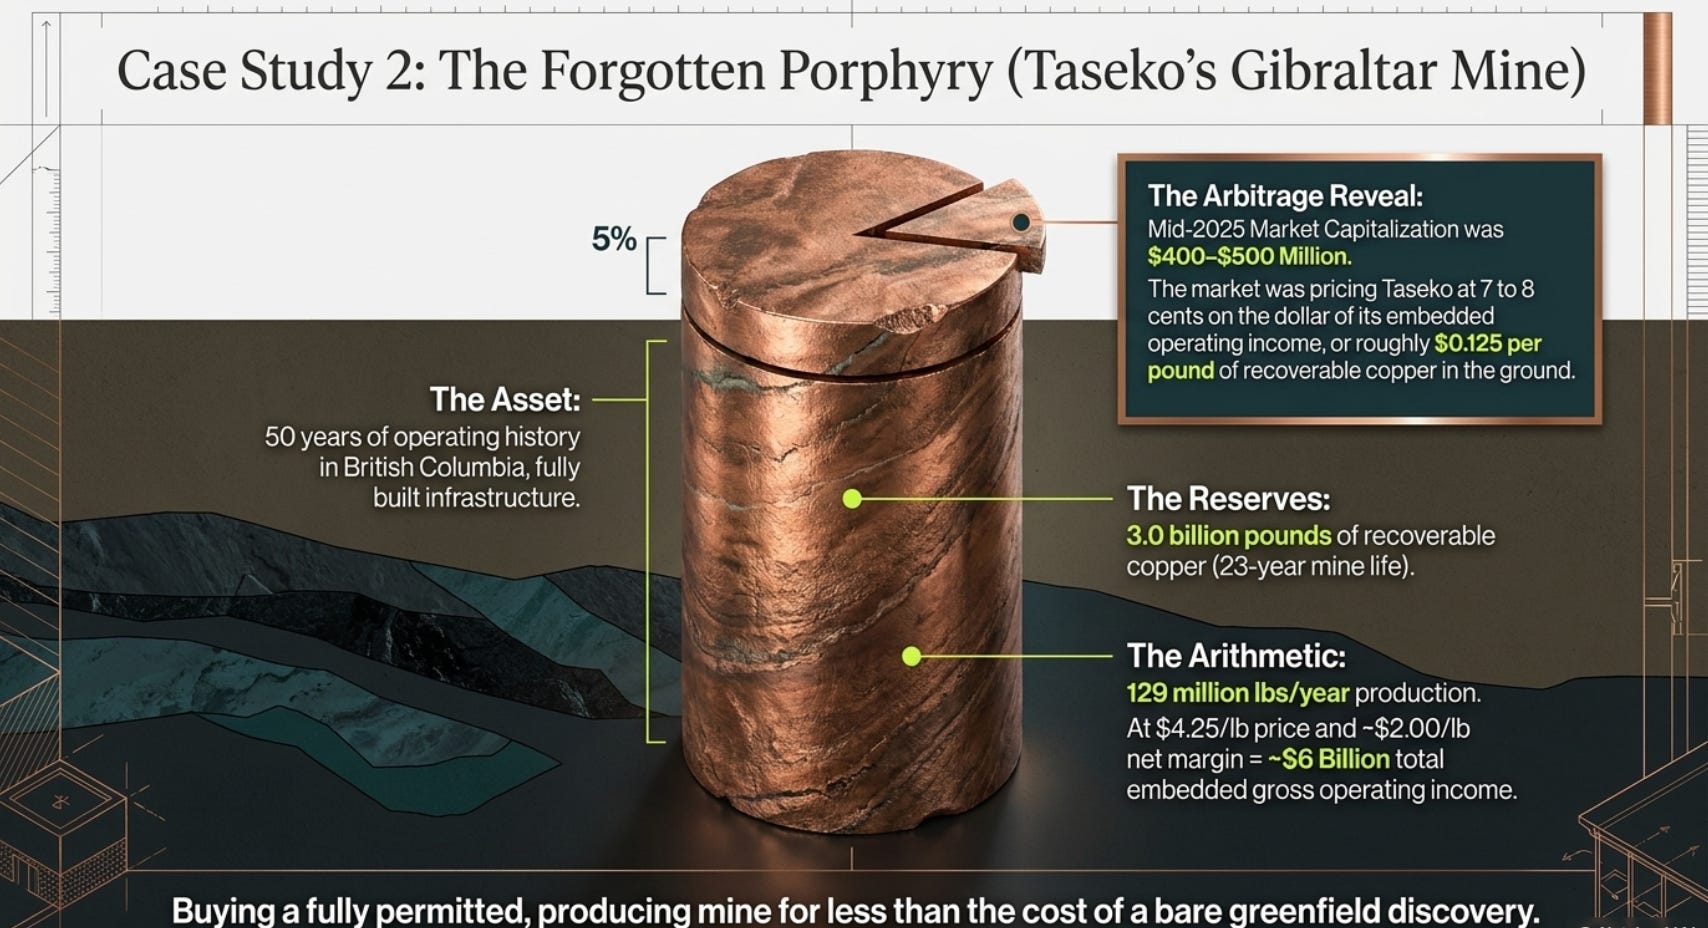
Taseko Mines Limited (NYSE: TGB) is not the kind of company that attracts front-page coverage. It operates the Gibraltar Mine near Williams Lake in British Columbia — a 75%-owned open-pit porphyry copper operation that has been producing since 1972. Gibraltar is not glamorous. It is not in a fashionable jurisdiction like Chile or the Democratic Republic of Congo. It is a British Columbia mine with 50 years of operating history, a reliable workforce, existing road and power infrastructure, and an ore body that, in 2022, was expanded through geological reanalysis to 706 million tonnes at 0.25% copper — yielding 3.0 billion pounds of recoverable copper with a 23-year mine life and average annual production of approximately 129 million pounds.
Pause on those numbers for a moment. Three billion pounds of certified, recoverable copper in a working mine. Twenty-three years of reserve life from infrastructure that already exists. One hundred and twenty-nine million pounds per year of production at operating costs that Taseko has publicly disclosed at approximately $2.00 to $2.30 per pound net of molybdenum byproduct credits.
Apply the owner’s arithmetic at $4.25/lb copper: 129 million pounds per year at approximately $2.00/lb net margin equals approximately $258 million per year in gross operating income from the Gibraltar mine alone. Three billion pounds at $2.00/lb net margin embedded in the certified reserve base equals approximately $6 billion in total gross operating income over the mine’s life, at current prices and current costs. Taseko’s market capitalization as of mid-2025 was approximately $400 to $500 million. The market was pricing the company at roughly 7 to 8 cents on the dollar of the operating income embedded in its certified reserve base, at today’s prices, at today’s costs.
A business owner buying 100% of Taseko’s 75% interest in Gibraltar at the mid-2025 market price of approximately $375 million was paying, on a per-pound basis, approximately $0.125 per pound of recoverable copper. At $0.125/lb for a functioning mine, the market is paying less than the cost of replicating the bare ore body discovery, and is assigning zero value to 50 years of operational infrastructure, the tailings management facility, the community relationships, and the institutional knowledge of a workforce that has been running this specific mine for half a century.
Case Study 3: Hudbay’s Constancia and the Quiet Power of a Peruvian Porphyry
Hudbay Minerals (NYSE: HBM) tells a slightly different story — one about how an ore body’s disclosed value interacts with a market that does not look past the income statement.
Hudbay operates its Constancia open-pit copper-molybdenum mine in the Cusco region of Peru, along with the Copper Mountain mine in British Columbia (acquired June 2023) and the Snow Lake underground operations in Manitoba. Constancia is the anchor asset. Its total proven and probable mineral reserves as of late 2023 included approximately 1.5 million tonnes of copper across 548 million tonnes of ore at 0.27% copper grade — or roughly 3.3 billion pounds of contained copper at Constancia alone.
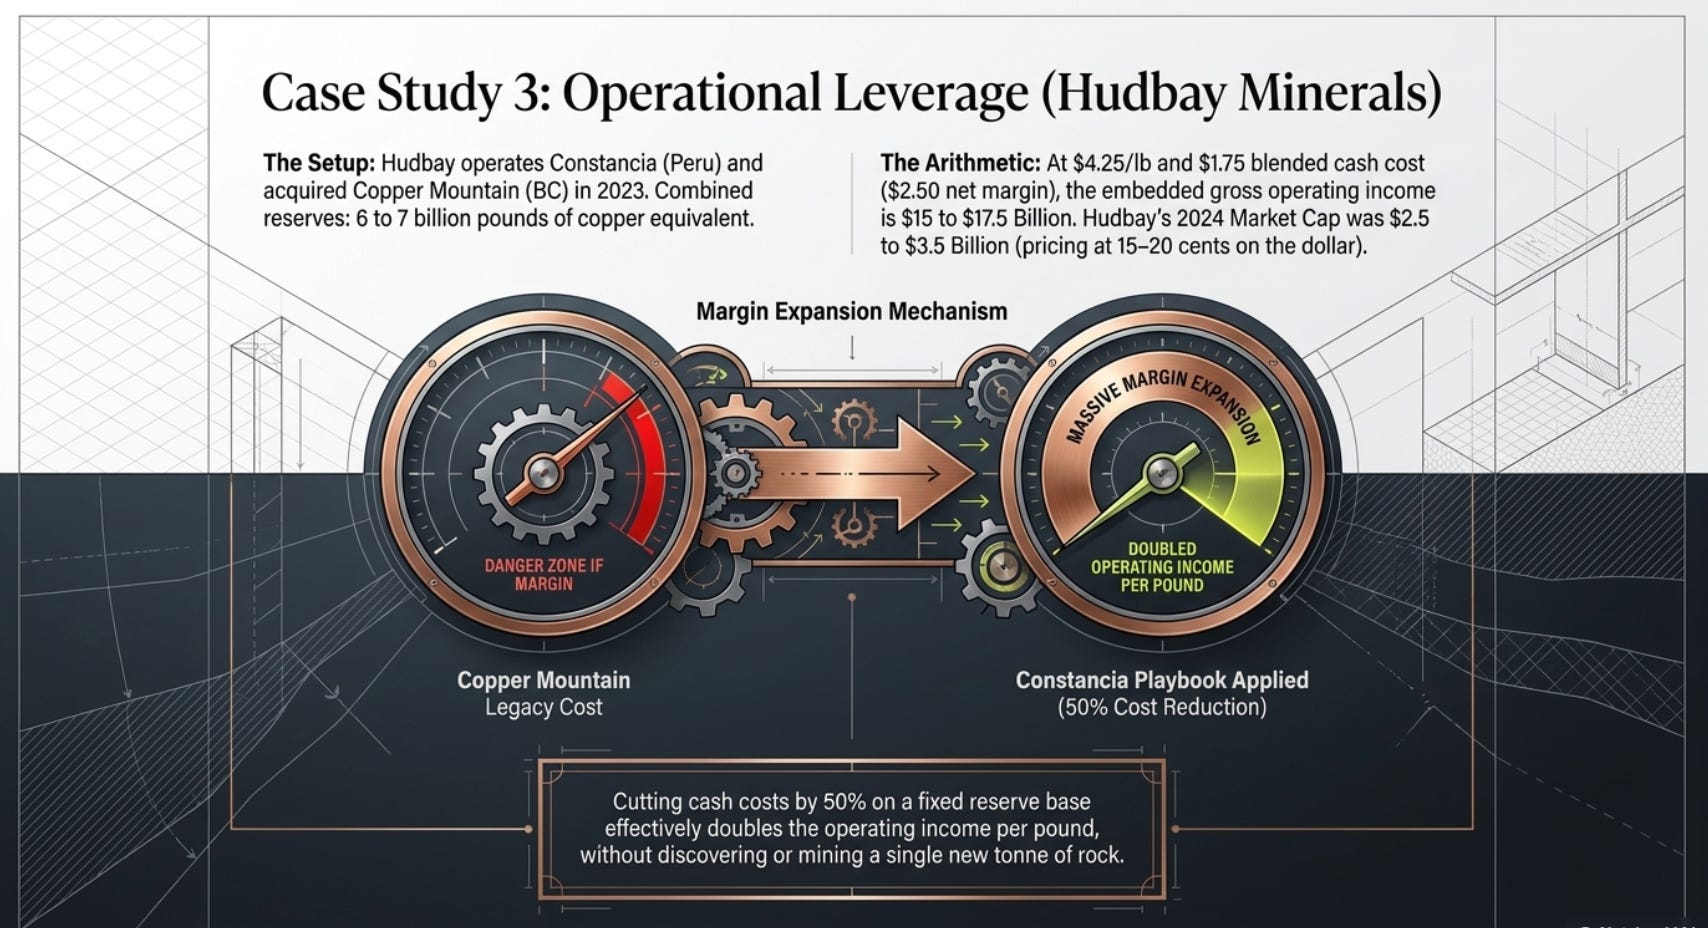
The Copper Mountain acquisition of June 2023 added 346 million tonnes at 0.25% copper — approximately 1.9 billion pounds of additional contained copper, with a 21-year mine life. Hudbay acquired Copper Mountain at a time when the previous operator’s cost structure had been elevated; Hudbay’s own disclosures indicated that their operational optimization at the site — replicating the processes they had implemented at Constancia — was expected to reduce Copper Mountain’s cash costs by approximately 50% over the first 10 years. A 50% reduction in cash costs from a certified reserve base means the operating income per pound roughly doubles, without changing a single tonne of the ore body.
The combined Hudbay reserve base — Constancia plus Copper Mountain plus Snow Lake — approached 6 to 7 billion pounds of copper equivalent in proven and probable reserves as of 2023 filings. At $4.25/lb copper and $1.75/lb blended cash cost, the net margin per pound across the portfolio was approximately $2.50/lb. Total gross operating income embedded in the reserve base: approximately $15 to $17.5 billion.
Hudbay’s market capitalization ranged from approximately $2.5 billion to $3.5 billion in 2024, with an enterprise value somewhat higher due to net debt. The market was pricing Hudbay at 15 to 20 cents on the dollar of the operating income embedded in its certified reserves, at current prices and current costs. The balance sheet explanation for this discount is familiar: the reserves are not assets under GAAP. What appears on Hudbay’s balance sheet is the net book value of mines at historical development cost less accumulated depletion — a number that bears no relationship to the value of 6 billion pounds of copper in already-producing mines.
The story at Copper Mountain also illustrates something important about how the market prices operational challenges. The mine had been struggling with production variability and elevated costs under its previous operator, generating negative headlines and disappointing quarterly results. The market, anchored to trailing earnings and recent production metrics, priced the asset accordingly. Hudbay’s acquisition thesis was simpler: this is a porphyry copper deposit with 21 years of certified reserve life in a tier-one Canadian jurisdiction, and its operating problems are fixable through standard operational discipline. The ore body does not care about its operating history. It cares about the C1 cost achievable from its geology, which Hudbay’s own Constancia experience gave them reason to believe could be substantially lower than the previous operator had achieved.
PART VI: CONFIRMED CATALYSTS — EVENTS ALREADY IN MOTION
The 17-Year Lock
Every confirmed catalyst for copper ultimately derives from one physical fact: the discovery-to-production timeline of 17 years creates a rigid upper bound on how much new copper supply can enter the market between now and the early 2040s. You can confirm this number independently: Sprott Asset Management, S&P Global, the IEA, and the UNCTAD have all published versions of the same figure, ranging from 15 to 17 years as the average discovery-to-production period. A copper deposit found today cannot produce commercial copper until approximately 2041 or 2042. Every copper mine that is currently in production is therefore structurally irreplaceable for the next 15 to 17 years, regardless of what happens to copper prices in the interim.
This is the lock. It makes currently producing, permitted, infrastructure-equipped copper mines categorically more valuable than they would be if new supply could respond quickly to price signals — as agricultural commodities can, or as oil shale can through relatively rapid well drilling. Copper cannot respond quickly. The geology and the permitting timeline will not allow it.
Catalyst 1: The EV Copper Demand is Already in the Supply Chain — Not a Forecast
Global EV production is not a forecast. It is current factory output. In 2023, the global EV fleet grew by approximately 14 million vehicles, bringing the total to roughly 40 million EVs on the road globally. Each new EV contains approximately 83 kilograms of copper. Fourteen million new EVs consumed approximately 1.16 million tonnes of additional copper demand in a single year — purely from the EV increment. At current global primary mine production of approximately 22 to 23 million tonnes per year, this single demand category added approximately 5 percent of additional consumption above the baseline, from a standing start. The IEA projects global refined copper demand to grow from 27 million tonnes in 2024 to 33 million tonnes by 2035 — an increase of 6 million tonnes, or 22 percent, in a decade. Against primary mine production that the IEA projects will peak in the late 2020s and potentially decline thereafter, the arithmetic of deficit is not speculative. It is the intersection of confirmed demand growth and documented supply constraints.
Catalyst 2: Grid Modernisation — The Invisible Copper Demand Nobody Models
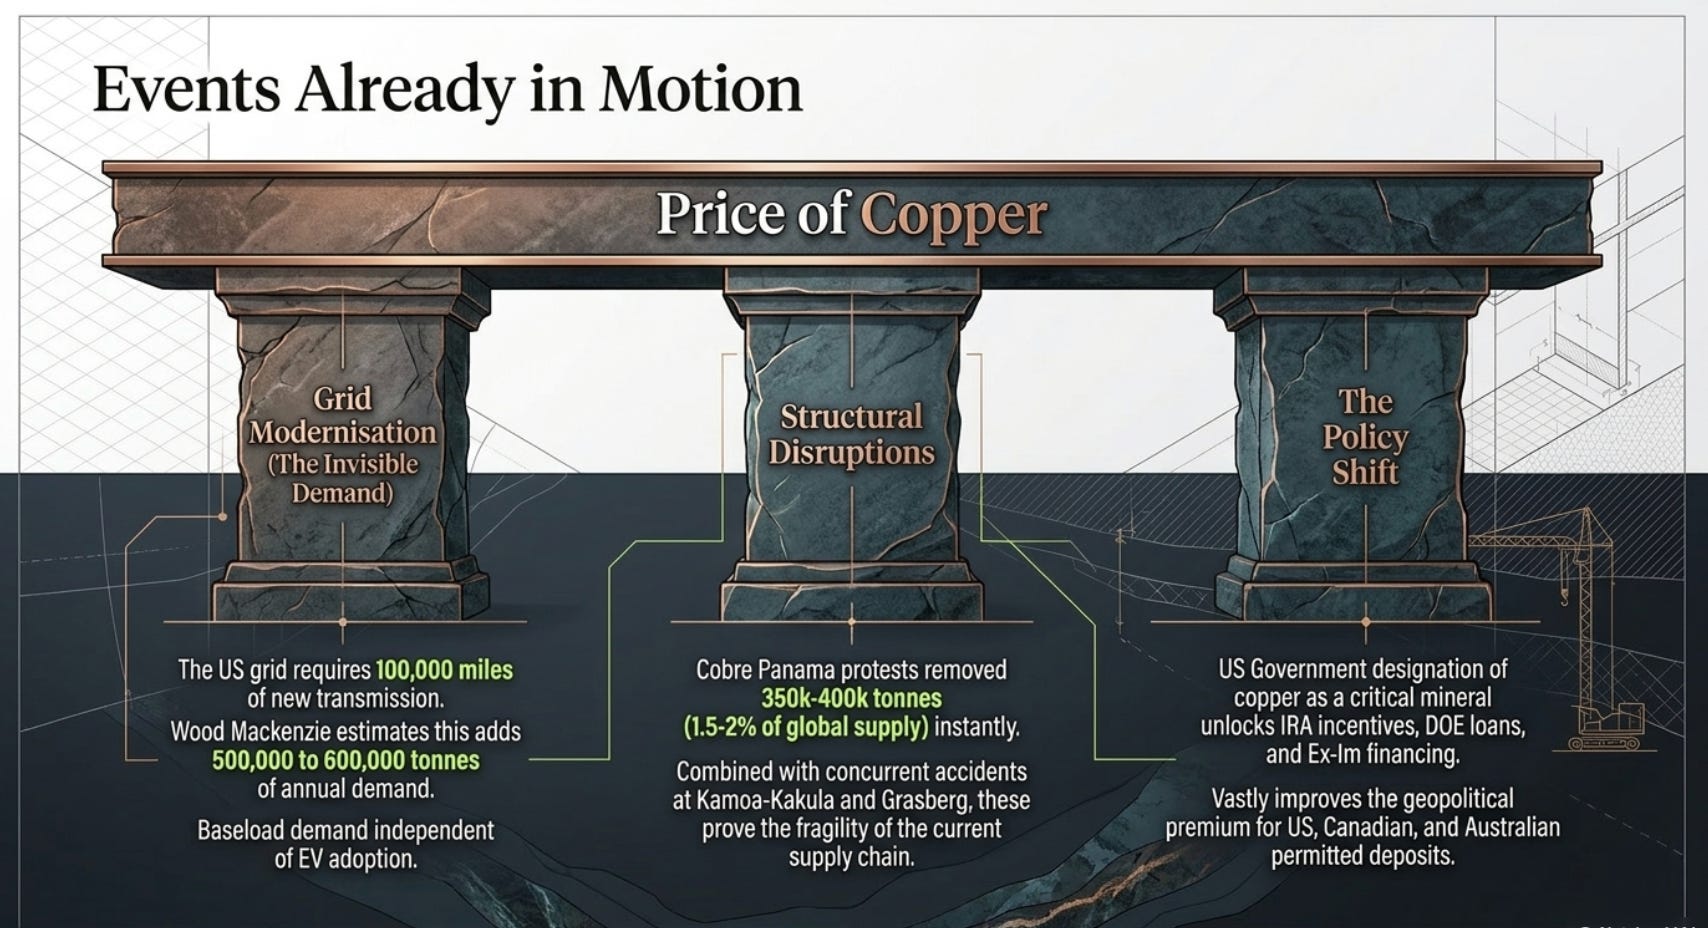
The electricity grid is copper-intensive in a way that most demand models undercount. The US electrical grid alone — often described as one of the most overdue infrastructure upgrades in any developed economy — requires an estimated 100,000 miles of new transmission lines over the next decade, plus the transformation of distribution infrastructure to accommodate bidirectional power flow from distributed solar generation. Transmission lines are copper. Distribution transformers are copper. The switchgear, substation equipment, and industrial cables connecting new renewable generation to existing grids are copper.
Wood Mackenzie has estimated that US grid modernisation alone could require an additional 500,000 to 600,000 tonnes of copper per year above current baseline demand, sustained for at least a decade. Europe’s equivalent grid investment programme, mandated under the EU’s Green Deal and REPowerEU frameworks, represents a comparable additional demand. China’s continuing grid expansion — the country adds more transmission capacity in a single year than the entire existing US transmission system — sustains the largest single increment of copper demand in the global market.
None of this is a projection about consumer behaviour or technology adoption. It is infrastructure investment mandated by governments, contracted by utilities, and funded by regulatory frameworks that are already in place. The copper for this grid modernisation will be consumed whether or not EV adoption exceeds expectations, whether or not battery technology evolves, and whether or not AI data centre demand grows as fast as currently projected. Grid copper is the baseload demand that makes every other copper demand story more secure.
Catalyst 3: The Ore Grade Decline — A Structural Cost Floor That Supports Price
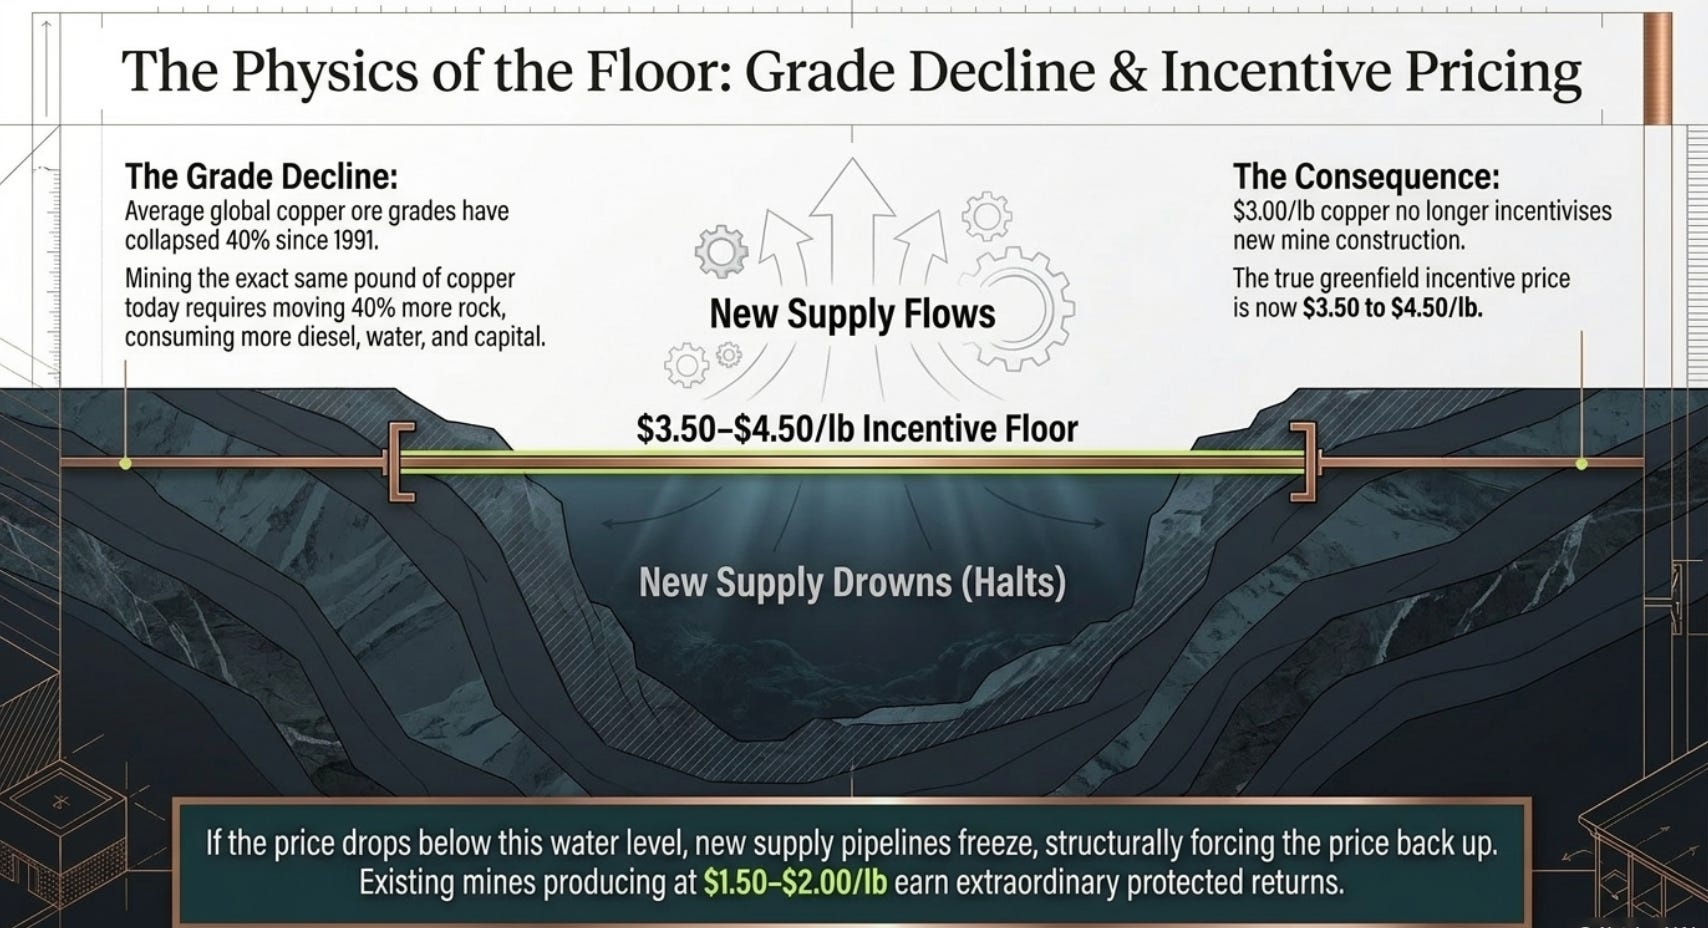
Average copper ore grades globally have declined approximately 40 percent since 1991, per IEA data. In practical terms, this means that mining the same pound of copper today requires processing roughly 40 percent more rock than it did 35 years ago, consuming more diesel, more water, more grinding media, and more personnel. Capital costs for new mine development in Latin America have increased approximately 65 percent since 2020, approaching levels previously associated only with greenfield projects, according to IEA analysis. The consequence is that the minimum copper price required to incentivise new mine construction — the “incentive price” — has risen structurally, not cyclically.
When copper periodically falls below $3.00/lb, the market tends to interpret this as a return to normal. But $3.00/lb does not incentivise new mine construction at current capital and operating cost levels. The incentive price for a new greenfield copper mine in Chile or Peru today is estimated at $3.50 to $4.50/lb, accounting for current construction costs, energy costs, and financing requirements. Any copper price below this range does not generate the returns required to justify the 10 to 15 year investment horizon of a new mine. This means that when copper falls below $3.50/lb, new mine investment slows or stops — reducing future supply — which, after the 10 to 17 year development lag, pushes prices back above the incentive level. The incentive price is a structural floor, not a ceiling. Existing mines with production costs of $1.50 to $2.00/lb earn extraordinary returns at any price above the incentive level, because they were built when costs were lower and their capital is already sunk.
Catalyst 4: The Supply Disruptions Are Structural, Not One-Off Events
The copper market experienced three significant supply disruptions in 2023 to 2025 that are worth examining not as individual events but as a pattern. First Quantum Minerals was forced to shut its Cobre Panama mine in November 2023 following widespread Panamanian public protests over environmental concerns, removing approximately 350,000 to 400,000 tonnes of annual copper production from the market — roughly 1.5 to 2 percent of global supply. Then, in 2025, accidents at Ivanhoe Mines’ Kamoa-Kakula complex in the DRC and at Freeport’s Grasberg mine in Indonesia disrupted production at two of the world’s largest copper operations simultaneously. Copper prices, which had already been supported by structural supply concerns, responded by reaching an all-time high of $6.61/lb on January 29, 2026.
Catalyst 5: The US Critical Minerals Policy Shift — Already Active
The US government has formally designated copper as a critical mineral, making domestic and allied-country copper producers eligible for Inflation Reduction Act incentives, Department of Energy loan guarantees, and Export-Import Bank financing. The CHIPS and Science Act creates further semiconductor manufacturing investment that will drive domestic copper demand for advanced electronics. The bipartisan support for critical minerals policy — with both parties agreeing that Western supply chain security requires domestic and allied-country mineral production — creates a policy environment in which US-permitted copper projects are more likely to advance through the permitting process more quickly than the historical 17-year average.
This is not a guarantee of specific projects or specific timelines. It is a confirmed shift in the regulatory posture of the largest economy in the world toward favouring the production of copper from Western, allied, and domestic sources. For companies with permitted copper deposits in the United States, Canada, Australia, and allied Latin American jurisdictions, the policy environment has materially improved, reducing the permitting risk that has historically been a primary discount factor for development-stage assets.
CONCLUSION: THE OWNER’S ADVANTAGE IN A MARKET THAT COUNTS QUARTERS
The copper investment case, stripped to its essentials, runs as follows.
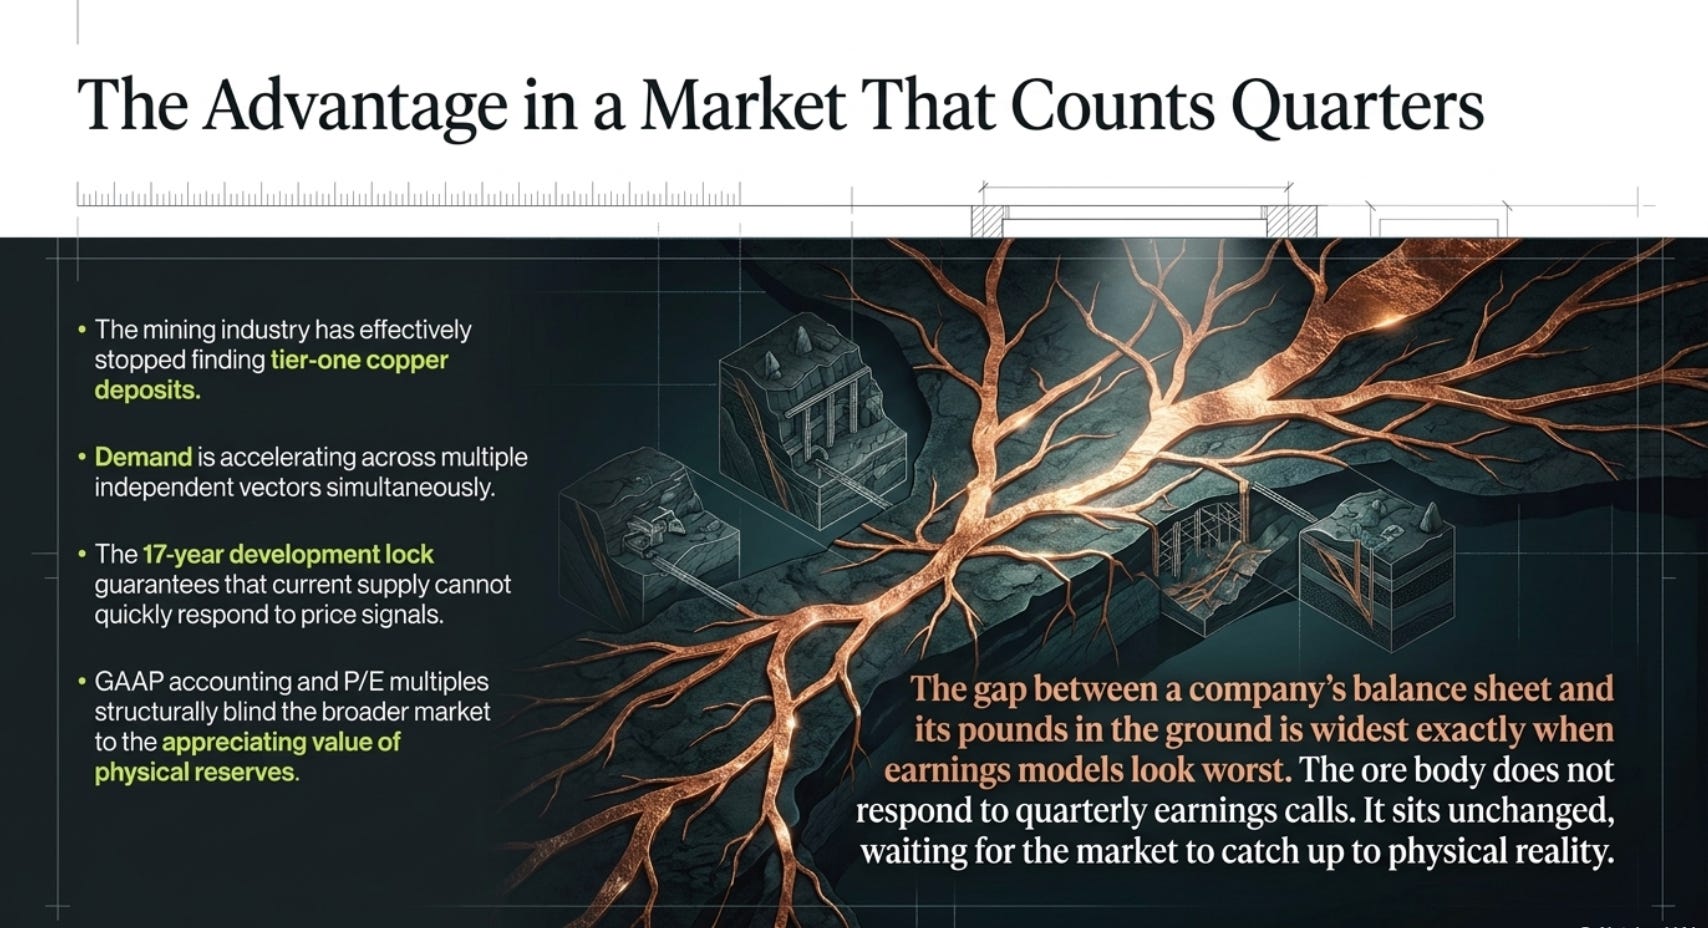
An industry that makes its living finding and digging up copper has essentially stopped finding new deposits. Fourteen major discoveries in the last decade. Two hundred and twenty-five in the preceding 23 years. The deposits being mined today — the ore bodies that Freeport, Hudbay, Capstone, Sandfire, Ero, Taseko, and MMG have certified in their annual technical reports — are largely not being replaced. They are being depleted. And depletions, unlike earnings, are permanent.
At the same time, the demand for copper is growing from multiple independent directions simultaneously. Electric vehicles. Grid modernisation. Renewable energy. AI data centres. None of these demand sources requires the others to succeed; they each independently add copper demand, and they all depend on the same scarce supply.
A new copper mine that is discovered today takes 17 years to produce its first commercial pound. The incentive price to build it is $3.50 to $4.50/lb — well above what the market averaged for much of the previous decade. The ore grades in any hypothetical new deposit will likely be lower than the existing producing mines, making it more expensive to operate. The political and environmental permitting environment in every major mining jurisdiction is more challenging than it was 20 years ago.
Against this backdrop, the certified reserve base of an existing, producing copper mine has a value that GAAP does not record and that earnings models structurally understate. The accounting says: “This property is worth what we spent building it, minus what we’ve already depleted.” The owner says: “This property contains X billion pounds of copper, which generates Y net margin per pound at today’s prices and today’s costs. Multiply X by Y and that is the operating income embedded in this asset. No new mine needed. No discovery required. No 17-year wait.” That is the arbitrage.
The companies that exploit it are not making a forecast. They are reading a geological report, checking the current copper price, doing arithmetic on a production cost statement, and comparing the result to a share price. The gap between those two numbers — the owner’s value and the market’s price — is widest at exactly the moments when the earnings models are most negative and the consensus is most bearish. It is widest when copper is near its trough, when producers are reporting losses or minimal earnings, when the financial press is writing stories about China’s slowdown or the end of the commodity cycle.
It is, in other words, widest precisely when it is most uncomfortable to act on.
The ore body does not read the financial press. It does not respond to quarterly earnings calls. It sits in the ground, unchanged, waiting — exactly as it has been doing since before the mine was built, and exactly as it will continue to do until the mining industry finally, slowly, catches up to the demand that is already visible in the world being built around it.
This white paper is for educational and informational purposes only. All reserve figures, production cost data, market statistics, and company financial data are drawn from publicly available sources including company annual reports (10-Ks, 40-Fs, 20-Fs), NI 43-101 and JORC technical reports, IEA publications, S&P Global Market Intelligence data, and documented market transactions as cited throughout. Nothing herein constitutes investment advice.
If you like this read, check out my other writings 👇
Rust, Rigs, and the Recurring Revenue Hidden in Plain Sight: A Deep Dive into Beng Kuang Marine (SGX: BEZ)

The Old Steel and the Sea: Why You Should Care About a Ship Maintenance Company
Investment Reflection #2 — The Grand Play: 100 Years of the World’s Nations as Characters in the Greatest Story Ever Told

“The world is not a chessboard. It is a living organism, where every cell — every nation — eats, competes, cooperates, and occasionally tries to eat the others. Understanding it requires not just memorizing moves, but understanding hunger.”

The Tide Is Going Out: Commodity Houses, Private Credit, and the AI Debt Bomb

Start Here: What This Article Is About
Why I Passed on Graftech (EAF): Riding The Battery Hype, Or Perhaps Not...

There is a kind of company that is the most dangerous thing in investing. It is not the fraudulent company. It is not the obviously bad company with terrible products and incompetent management. Those are easy — you just avoid them. The truly dangerous company is the one with a
The Beautiful Trap: Why I'm Passing on The Hour Glass (SGX: AGS)

There’s a peculiar kind of investment that keeps you up at night — not because it’s bad, but because it’s genuinely good. Good enough to admire. Not good enough to buy.
The Diamond in the Rough That Isn't Quite Yours: Why I Passed on Boustead (SGX: F9D)

There is an old saying that investors have borrowed, bent, and quoted so many times it has nearly lost its sharpness: a bird in the hand is worth two in the bush. Warren Buffett, characteristically, gave it a precise mathematical form. The value of any investment, he wrote, is determined by three questions:
The Schoolteacher's Secret Insurer: Why Horace Mann (NYSE:HMN) Is Sitting on My Watchlist

“The stock market is a device for transferring money from the impatient to the patient.” — Warren Buffett

The Dormitory King That Couldn't Leave Home: Why I Passed on Centurion (SGX: OU8)

There is a deceptively simple question that Warren Buffett borrowed from Aesop’s ancient fable, and has repeated across decades of shareholder letters: “How many birds are in the bush? How sure are you they’re there? And how long until you get them out?”
The Children's Place: A $90 Million Bet on a Company That Used to Be Worth $2 Billion (NYSE: PLCE)

There is a classic scene in every heist movie. The detective walks into a room, sees the chalk outline, the scattered evidence, the broken window, and immediately knows something went terribly wrong long before anyone called the police. You do not need the full autopsy report to read the body.
World War 3 In Iran and Why Oil Price Will Continue Increasing — It Arrived Sooner Than Anyone Expected

This is Part 2 of a continuing analysis of California Resources Corp (CRC). Part 1 built the foundational investment case: a company trading at $44 per share against a conservative intrinsic value of $108–$156, built on 567 million barrels of proved developed oil reserves in California, and a management team spending hundreds of millions buying back its…
The Most Overlooked Oil Company in America — And Why That Might Be the Opportunity of the Decade

Date of analysis: 28 December 2025
The Art Of Saying No - MYPS: Playstudios Inc

PLAYSTUDIOS (MYPS) is a Las Vegas-based mobile gaming company that operates free-to-play social casino games and a loyalty platform called playAWARDS, which lets players redeem points for real-world rewards at places like MGM Resorts, Norwegian Cruise Line, and Wolfgang Puck restaurants. On the surface, this sounds like a clever moat. A loyalty program.…
The Art Of Saying No - UGP: Ultrapar Participacoes S.A (Part 2 of 2)

Question 2: How Certain Are You?
The Art Of Saying No - GLIBK: GCI Liberty Inc

Picture this: a single telecommunications company — the dominant one — serves over 200 communities scattered across the largest state in the United States. Alaska. A state with just over one person per square mile. A state where 39% of residents are underserved by broadband. A state where, until recently, some villages received internet via satellite li…

The Art Of Saying No - UGP: Ultrapar Participacoes S.A (Part 1 of 2)

The Setup: A Value Investor Dream?


The Art of Saying No - RIG: Transocean LTD

“The difference between successful people and really successful people is that really successful people say no to almost everything.” — Warren Buffett
The Art of Saying No - KPRX: Kiora Pharmaceuticals Inc

“The difference between successful people and really successful people is that really successful people say no to almost everything.” — Warren Buffett
The Art of Saying No - DNUT: Krispy Kreme Inc

“The difference between successful people and really successful people is that really successful people say no to almost everything.” — Warren Buffett

🎓 A Business Strategy Primer Part 7 - Learning From Great Companies

The Billion-Dollar Playbook: How Market-Based Management Powered Koch Industries’ Unstoppable Rise
The Art of Saying No - MRX: Marex Group PLC

“The difference between successful people and really successful people is that really successful people say no to almost everything.” — Warren Buffett


The Art of Saying No - SFIX: Stitch Fix Inc

“The difference between successful people and really successful people is that really successful people say no to almost everything.” — Warren Buffett
🎓 A Business Strategy Primer Part 2 - Brainstorming Solutions With Value At The Core

Creating An Irresistible Offer
The Art of Saying No - TDOC: Teladoc Health Inc

“The difference between successful people and really successful people is that really successful people say no to almost everything.” — Warren Buffett

The Art of Saying No - MDU: Mdu Resources Group Inc

“The difference between successful people and really successful people is that really successful people say no to almost everything.” — Warren Buffett


The Art of Saying No - AFCG: Advanced Flower Capital Inc

“The difference between successful people and really successful people is that really successful people say no to almost everything.” — Warren Buffett
The Art Of Saying No - VYX: NCR Voyix Corp

“The difference between successful people and really successful people is that really successful people say no to almost everything.” — Warren Buffett
The Art of Saying No - VSTS: Vestis Corp

“The difference between successful people and really successful people is that really successful people say no to almost everything.” — Warren Buffett

🛢️Basic Energy Primer Part 2 - Business and Competitive Landscape

The Man Who Bet Everything on Being Wrong
The Art of Saying No - CISS: C3is Inc

“The difference between successful people and really successful people is that really successful people say no to almost everything.” — Warren Buffett
The Art of Saying No - PSHG: Performance Shipping Inc

“The difference between successful people and really successful people is that really successful people say no to almost everything.” — Warren Buffett

The Art Of Saying No - MAGN: Magnera Corp

The Magnera Corporation Analysis Nobody Asked For (But Everyone Needs)
The Art of Saying No - CHR: Cheer Holding Inc

“The difference between successful people and really successful people is that really successful people say no to almost everything.” — Warren Buffett
The Art of Saying No - WIMI: WiMi Hologram Cloud Inc.

“The difference between successful people and really successful people is that really successful people say no to almost everything.” — Warren Buffett
⚡️Alternative Energy Primer Part 3 - Industry and Sector Technicals

The €2.2 Billion Mistake That Revealed Everything
⚡️Alternative Energy Primer Part 2 - Business & Competitive Landscape

The Shipwreck That Changed Everything

🏥 A U.S. Health Insurance (Managed Care Organizations) Sector Primer

1️⃣ Industry Fundamentals & Macro View

