
A Note on Method Before We Begin
This paper applies the same discipline used throughout this (sector value arbitrage) series: identify the primary income-generating asset of the business, value it the way a business owner would — at what it produces today without a financial model — and then compare that to what the accountant records on the balance sheet. The gap between those two numbers is the arbitrage.
In banking, this discipline requires us to ask a question that almost nobody who covers bank stocks asks: what is the liability side of the balance sheet worth as an asset?
That sounds paradoxical. Deposits are liabilities. A bank owes its depositors money. How can a liability be an asset?
The answer is the core of this paper, and once you see it clearly, you cannot look at a community bank balance sheet the same way again. A deposit is a liability in accounting terms. In economic terms, it is a funding source — the raw material the bank uses to make loans. And like every raw material, it has a cost. The difference between what a bank pays for its deposits — sometimes zero, for non-interest-bearing checking accounts — and what it would cost to fund itself from the open market is real money, earned every single day, from an asset that shows up on the balance sheet at exactly zero.
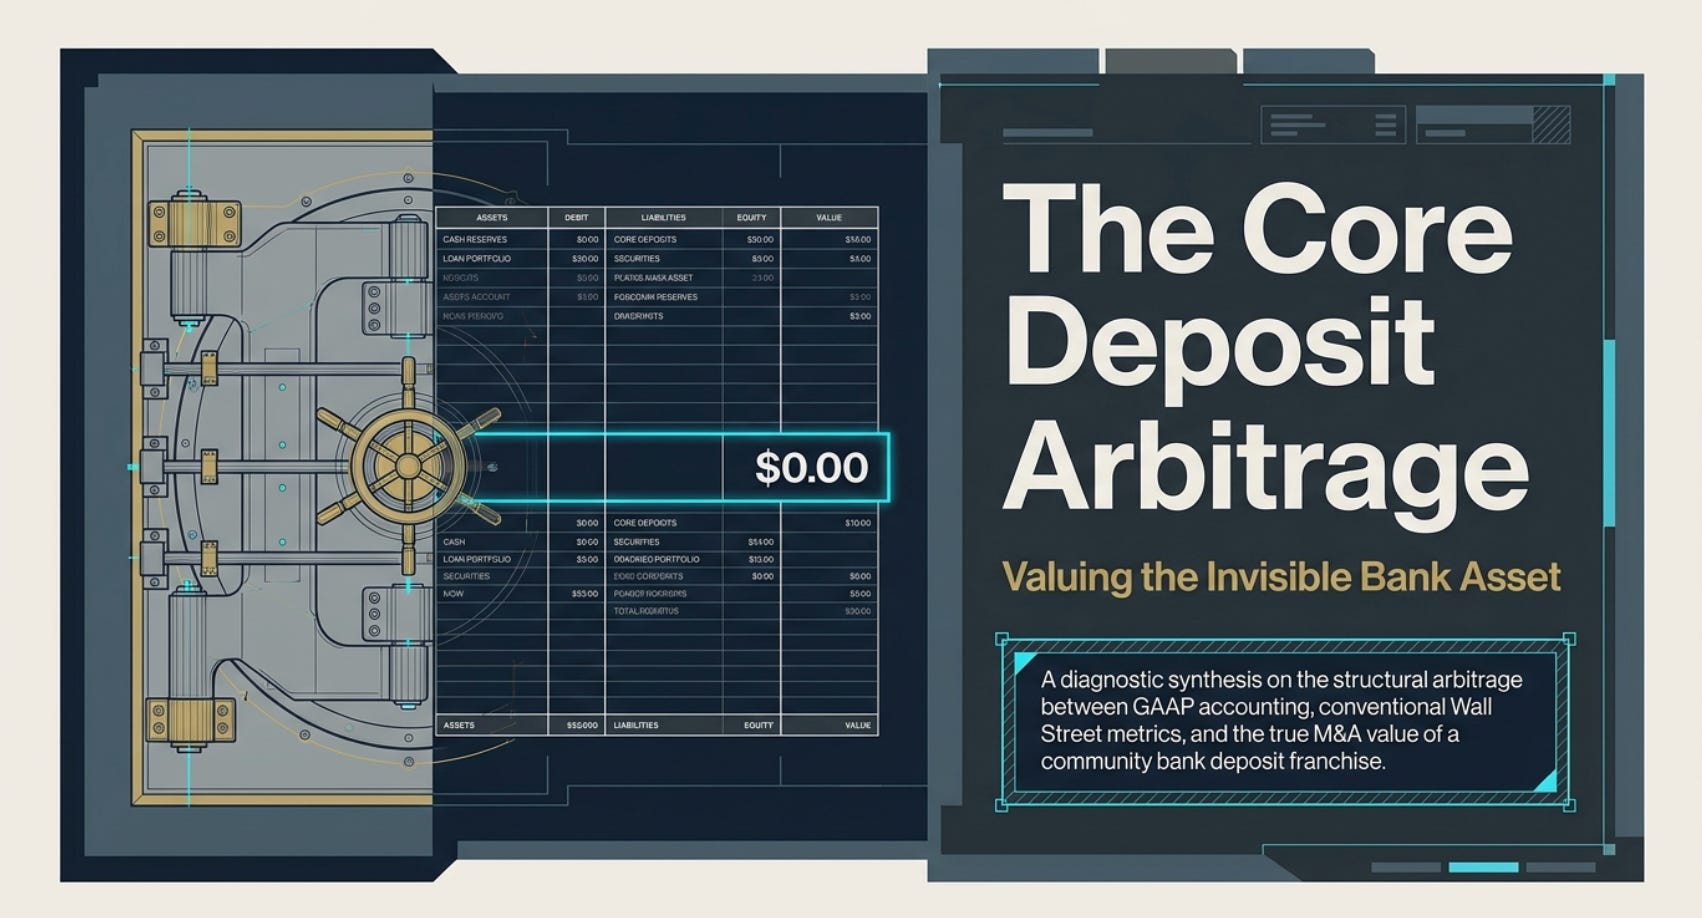
That zero is where the arbitrage lives.
PART I: THE BUSINESS OF BANKING, STRIPPED TO ITS ESSENTIALS
Where a Bank’s Income Actually Comes From
To understand the deposit as an asset, you first need to understand what banking actually is as a business. Strip away the branches, the ATMs, the digital apps, and the marketing campaigns, and a bank is doing one thing: borrowing money at one rate and lending it at a higher rate. The difference — the spread — is the net interest margin, and it is the source of almost all the income a traditional commercial bank generates.
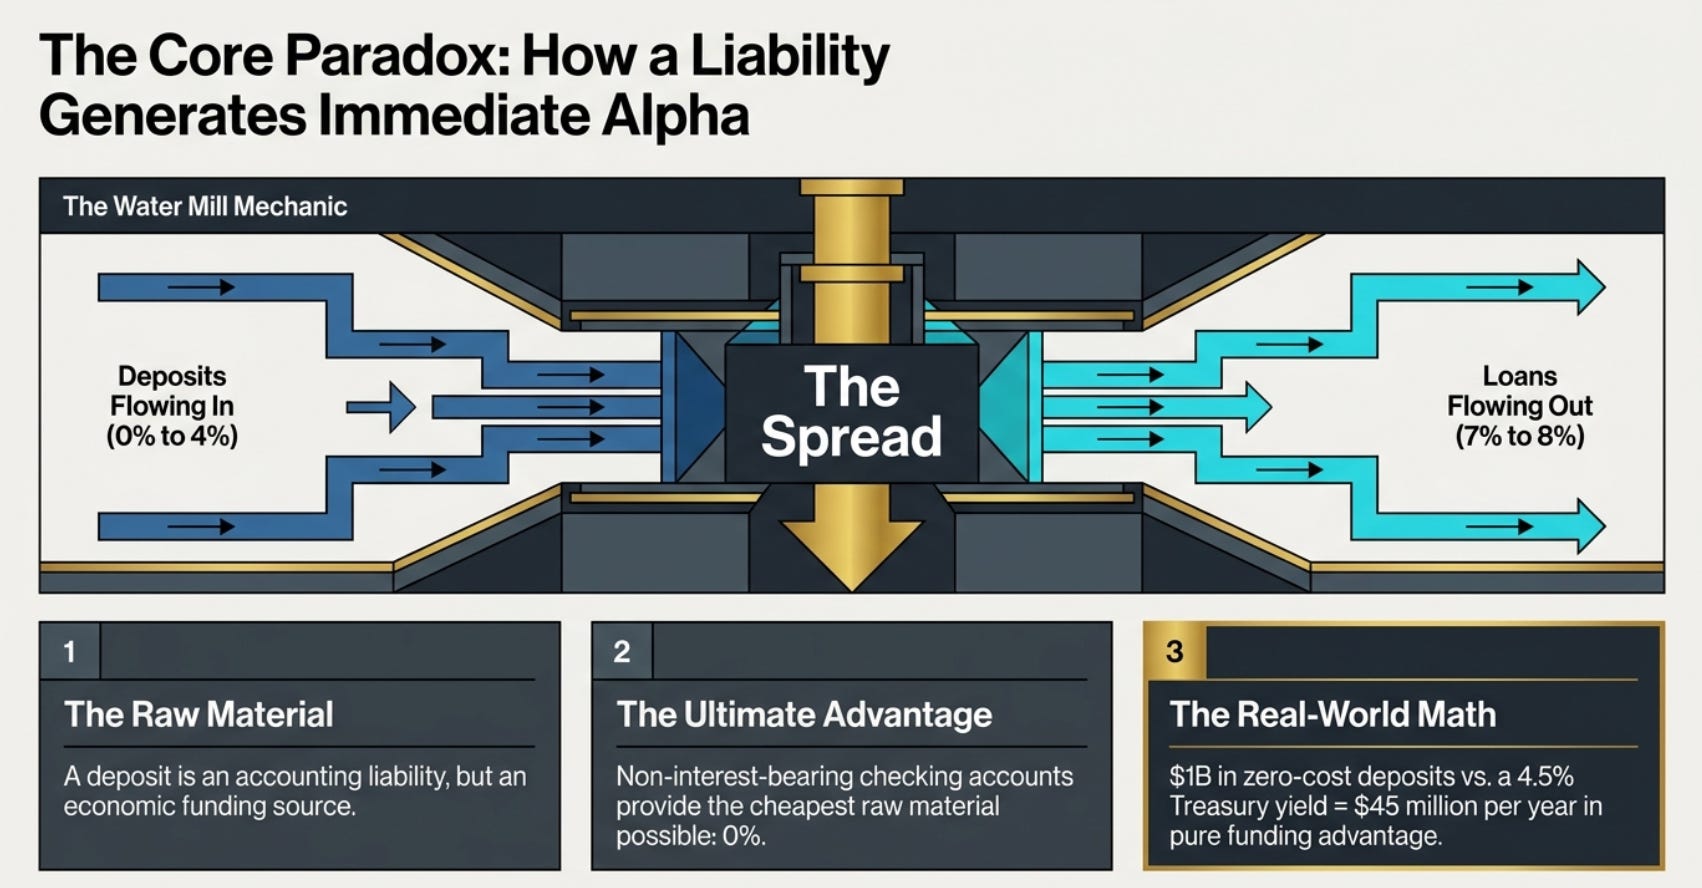
A community bank in rural Ohio gathers deposits from its customers. Mrs Johnson deposits her savings at 4% per year. Mr Chen deposits his business operating account — a checking account — earning nothing at all, because business checking accounts rarely pay interest. The bank takes those funds and makes loans: mortgages at 7%, business loans at 8%, agricultural loans at 7.5%. The spread between what the bank pays for deposits and what it earns on loans flows through the income statement as net interest income. This is the bank’s operating revenue. It is as simple and as mechanical as a water mill: money flows in one side at one price, flows out the other side at a higher price, and the difference is what the bank earns.
Now here is the question a business owner asks before any other: of all the different types of deposits a bank holds, which one costs the least? And the answer is so obvious that it barely registers as a strategic insight, but its implications are enormous. The cheapest deposit is the one that pays nothing. The non-interest-bearing checking account — the business operating account, the personal current account, the payroll processing account — where the customer deposits money and earns 0% interest in return.
If a bank holds $1 billion in non-interest-bearing checking accounts, it is funding $1 billion of its loan book at a cost of exactly zero. If the 5-year US Treasury note yields 4.5%, then the bank’s $1 billion in zero-cost deposits is generating a funding advantage of $45 million per year over what it would cost to fund the same $1 billion by issuing medium-term notes in the wholesale market. Forty-five million dollars per year in funding advantage. From deposits that cost nothing. From customers who are not going anywhere because they have had their business accounts at this bank for twenty years and switching is a hassle and the banker knows their name.
This is the core deposit intangible. It is not a theoretical concept. It is forty-five million dollars per year falling from the sky, from a relationship asset that the balance sheet records at zero.
PART II: THE ASSET THE ACCOUNTANT REFUSES TO RECOGNISE
Why GAAP Records the Value of This Franchise at Exactly Nothing
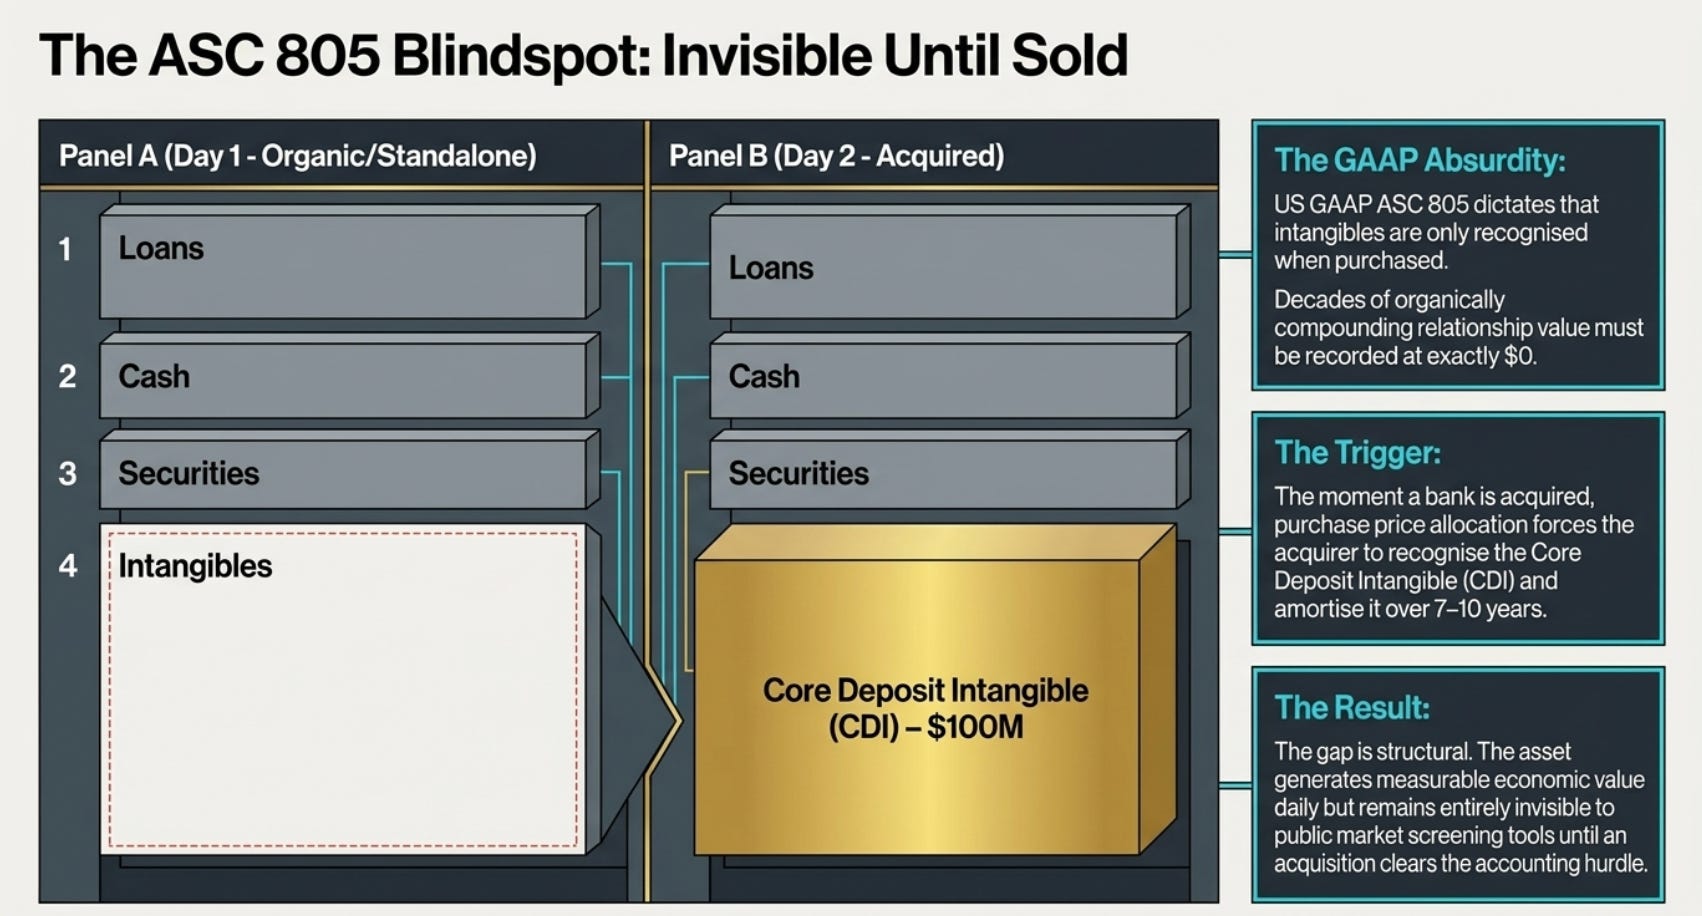
Under US GAAP — specifically ASC 805 (Business Combinations) and the broader framework governing intangible asset recognition — a company can only recognise an intangible asset on its balance sheet when it has purchased that asset from a third party in an arm’s-length transaction. This is called the “purchased intangible” rule, and it has a sensible rationale: intangibles created internally are difficult to measure reliably, so conservative accounting standards require a market transaction to establish a verifiable cost.
For banks, this rule creates an accounting absurdity that compounds year by year. A community bank that has been gathering non-interest-bearing checking accounts from local businesses for sixty years has built something extraordinarily valuable — a stable, sticky, low-cost funding base that no competitor can walk in and replicate tomorrow. It took sixty years of relationships, sixty years of service, sixty years of the local banker attending the Chamber of Commerce breakfast and helping the hardware store owner set up his payroll processing. That franchise is real. It generates measurable economic value every day. It is the primary reason the bank earns a superior net interest margin relative to competitors that fund themselves from brokered deposits or wholesale markets.
But because the bank built this franchise organically — it did not purchase it from anyone — GAAP requires it to record the value of the franchise at zero. The balance sheet says nothing about it. The income statement reflects it implicitly through the net interest margin, but never isolates it or names it. An investor looking at the balance sheet sees: loans, securities, cash, and a small amount of physical premises at depreciated cost. The deposit franchise built internally — the thing that makes the bank worth buying — is invisible.
The moment this same bank is acquired by a competitor, the accounting changes completely. Under ASC 805, the acquirer must perform purchase price allocation and assign fair values to all assets and liabilities acquired, including identifiable intangible assets. The deposit franchise — the very same asset that was invisible the day before the acquisition — is now recognised as a core deposit intangible (CDI) on the acquirer’s consolidated balance sheet. It is valued using a present value methodology that estimates the future cost savings from the acquired deposit base relative to alternative funding sources, discounted to the acquisition date. It is then amortised over its estimated useful life — typically seven to ten years.
One day before the merger: $0 in intangibles for the deposit franchise. One day after the merger: $40 million, $60 million, $100 million in recognised CDI (Core Deposit Intangible) — depending on the size and quality of the deposit base.
Nothing changed about the deposits. Nothing changed about the customers or their relationships with the bank. Nothing changed about the funding cost advantage those deposits represent. The only thing that changed was who owns the bank and what the accounting standards require the new owner to recognise.
This is the gap. It is structural, it is systematic, and it is disclosed — in detail — in every bank merger proxy statement and every acquirer’s first financial statement following a bank acquisition. The analysis that reveals the deposit franchise’s value is not secret or proprietary. It is performed by investment bankers, documented in regulatory filings, and available to any investor who reads beyond the headline financials. But for a standalone bank — one that has not yet been acquired — that analysis is never performed publicly, and its result never appears in the financial statements. The asset is invisible until the moment it is sold.
PART III: THE OWNER’S VALUATION — WHAT A BANK ACQUIRER ACTUALLY PAYS FOR
The Arithmetic of the Deposit Franchise
A business owner considering the acquisition of a community bank does not start with the P/E ratio or the price-to-book multiple. They start by answering a question that has nothing to do with earnings: what does this bank’s funding cost me, and what would it cost me if I had to replicate this funding base from scratch?
The answer to the first part — current funding cost — is straightforward. The bank discloses its average cost of funds: total interest expense divided by total average interest-bearing liabilities. For a well-run community bank with a strong deposit franchise, this number might be 1.5% to 2.0% on interest-bearing deposits, and 0% on non-interest-bearing deposits. The blended cost of the total deposit base might be 1.0% to 1.5%.
The answer to the second part — what replacement funding would cost — is the current market rate for an equivalent funding source: a short-term Treasury bill, a Federal Home Loan Bank advance, or a brokered CD. If the risk-free rate is 5% and the bank’s blended deposit cost is 1.5%, the funding advantage is 3.5% on every dollar of deposits. On a $1 billion deposit base, this is $35 million per year in recurring, structural, cost-of-funds advantage — before any credit for the bank’s loan underwriting, its fee income, or its operational efficiencies.
This is the CDI in its simplest form: the difference between what the bank pays for its deposits and what it would pay for equivalent funding in the open market, applied to the total deposit base. It is real money. It is ongoing. And for a bank with a genuinely sticky deposit franchise — one built on multi-decade business relationships, payroll processing, and the kind of embedded operational dependency that makes switching both painful and risky — it is as durable as any physical asset in any industry.
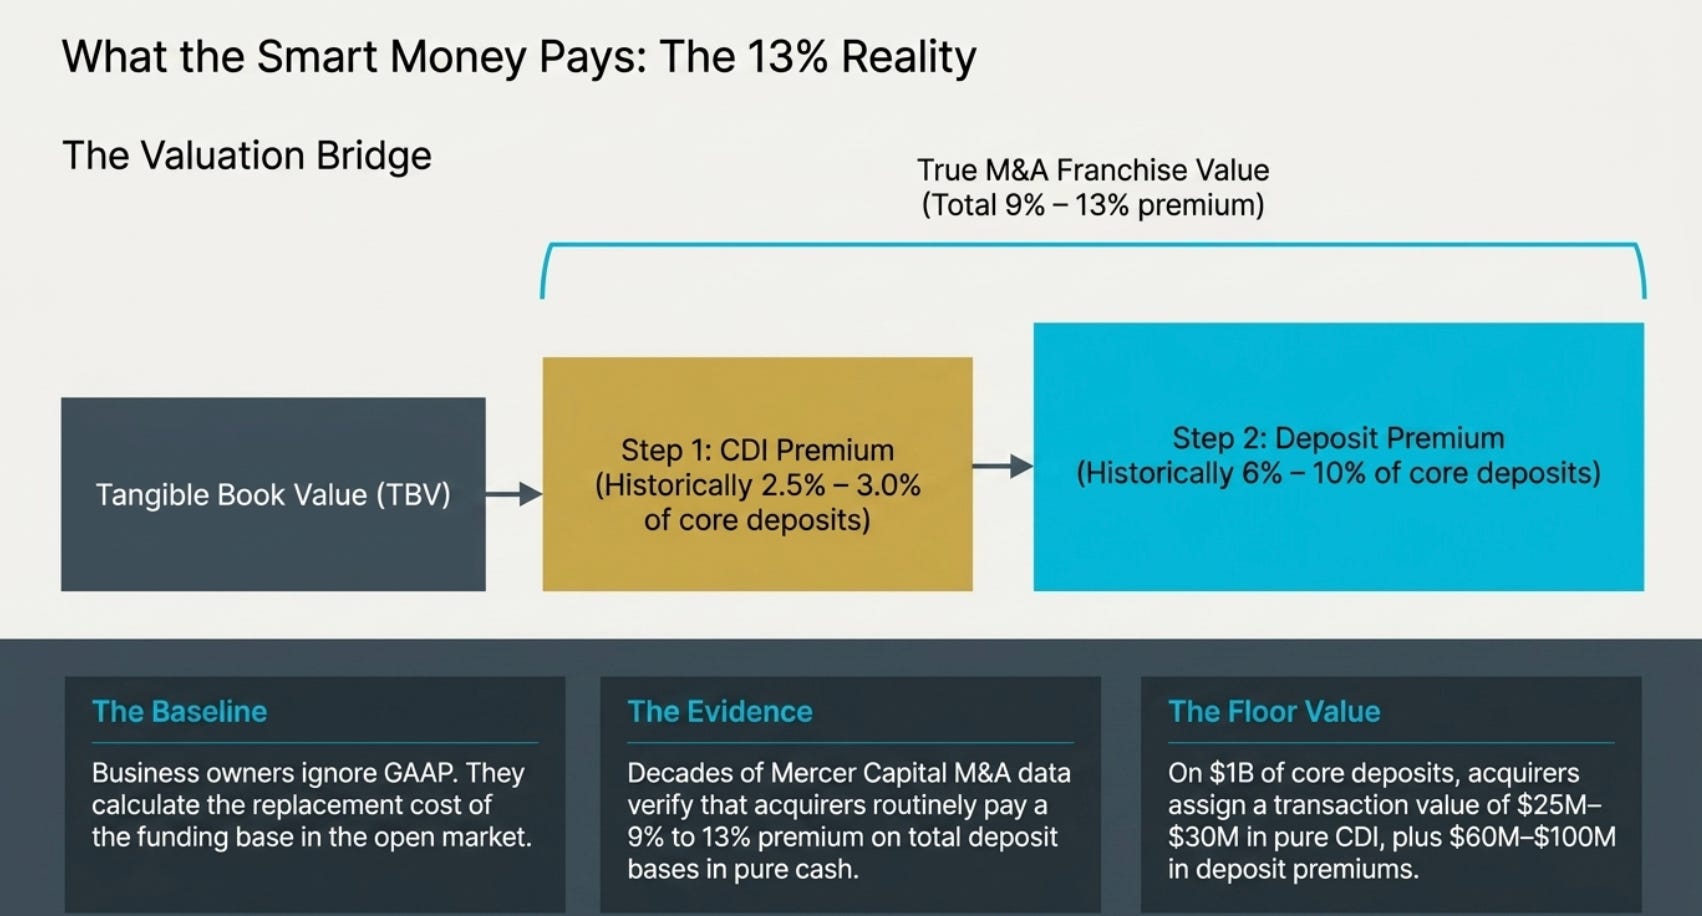
Mercer Capital, the pre-eminent independent advisory firm covering bank M&A transactions, has tracked CDI values in bank acquisitions over multiple decades. Their 2025 CDI Update, based on S&P Capital IQ Pro data through mid-September 2025, shows CDI values averaging approximately 2.47% to 2.70% of core deposits in recent whole-bank acquisitions. Their 2024 update showed an average of 2.73%. Their 2023 update showed 2.58%. The historical long-run average from the early 2000s — before the distortions of the post-crisis near-zero interest rate environment — was 2.5% to 3.0%.
What this means in practice: every $1 billion of core deposits a bank holds organically has a transaction value — the value that an acquirer assigns and pays for — of approximately $25 to $30 million in CDI alone. Add to this the deposit premium: the excess of total purchase price over tangible book value, expressed as a percentage of the core deposit base. From 2015 to 2023, deposit premiums in whole-bank acquisitions ranged from 6% to 10% of the core deposit base. On $1 billion of deposits, that is $60 to $100 million in total deposit franchise value above tangible book. Together — CDI plus deposit premium — the total value of the deposit franchise paid by acquirers has historically been 9% to 13% of the total deposit base.
A community bank with $2 billion in total deposits — let us say $600 million of which are non-interest-bearing checking accounts — has an embedded deposit franchise value, as measured by arm’s-length M&A transactions, of approximately $180 to $260 million above its tangible book value. If that bank’s tangible book value is $250 million and it trades at 1.2x tangible book ($300 million market cap), the market is assigning $50 million in value above book. The deposit franchise, by M&A transaction comparables, is worth $180 to $260 million above book. The market is capturing roughly 19 to 28 cents of every dollar of deposit franchise value that an acquirer would actually pay.
That is the arbitrage.
PART IV: WHY WALL STREET’S TOOLS PRODUCE THE WRONG ANSWER
The Problem with P/E and P/TBV for Banks
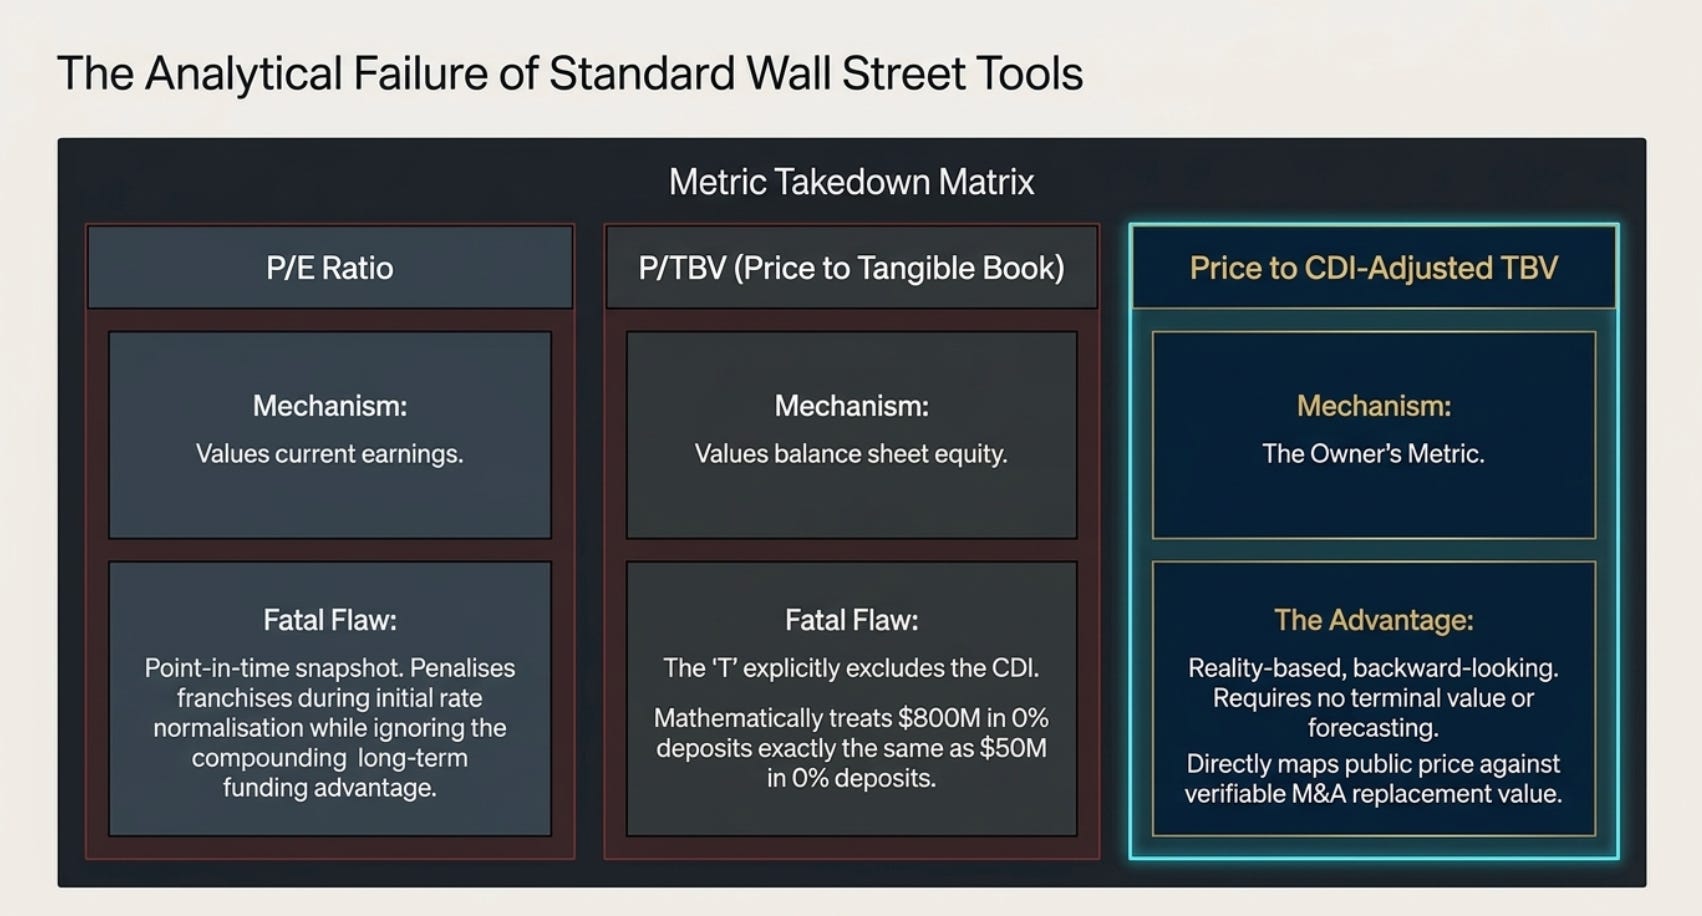
When a bank analyst covers a community bank, the standard toolkit involves two metrics: price-to-earnings (P/E) and price-to-tangible-book-value (P/TBV). Both have serious limitations when applied to banks with strong deposit franchises, and both systematically undervalue the banks where the deposit franchise is most valuable.
The P/E ratio has an obvious problem: it uses current earnings as the measure of value. But current earnings are heavily influenced by the current interest rate environment, the current credit cycle, and the current mix of assets and liabilities. A community bank that funded itself in 2021 at near-zero deposit costs while holding mortgages yielding 3% to 4% looks very different in its earnings profile than the same bank in 2024, holding the same mortgages but now paying 2% to 3% on deposits as rates normalised. The P/E ratio in 2024 looks worse than 2021 — but the deposit franchise is unchanged, the customer relationships are unchanged, and the long-term funding advantage of the deposit base, relative to alternative funding sources, may be even more valuable when rates are high. The earnings metric is measuring the outcome of one point in the rate cycle, not the value of the franchise asset. These are not the same thing.
The P/TBV ratio has a more fundamental problem, which is the one this paper is principally about: tangible book value does not include the core deposit intangible for a standalone bank. The “tangible” in tangible book value specifically excludes intangible assets — and since the CDI of a standalone bank is zero (because it was never purchased), the tangible book value does not capture the deposit franchise value at all. A bank trading at 1.0x tangible book value could be extraordinarily cheap if its deposit franchise is worth 50% or 100% of tangible book. A bank trading at 2.0x tangible book could be expensive if it has no deposit franchise to speak of and its funding comes from brokered deposits and FHLB advances.
The analysis that correctly values the deposit franchise is not a financial model. It requires no forecast. It requires three pieces of information: the total deposit base, the composition of the deposit base (what fraction is non-interest-bearing or low-cost core deposits), and the long term average market deposit premium and long term average CDI percentages. Apply those percentages to the deposit base, add to tangible book, and compare to the market price. The resulting ratio — market price to CDI-adjusted tangible book — is the measure that tells you whether you are paying a fair price for the deposit franchise.
This is the owner’s calculation. It is entirely backward-looking and present-tense. No forecast required. No terminal value. No discount rate debate. Just: what are the deposits worth, and what am I paying for them in the public equity market?
PART V: STORIES FROM THE VAULT — THREE CASE STUDIES IN DEPOSIT FRANCHISE VALUE ARBITRAGE
The Savings and Loan Crisis and the Birth of the Premium Market
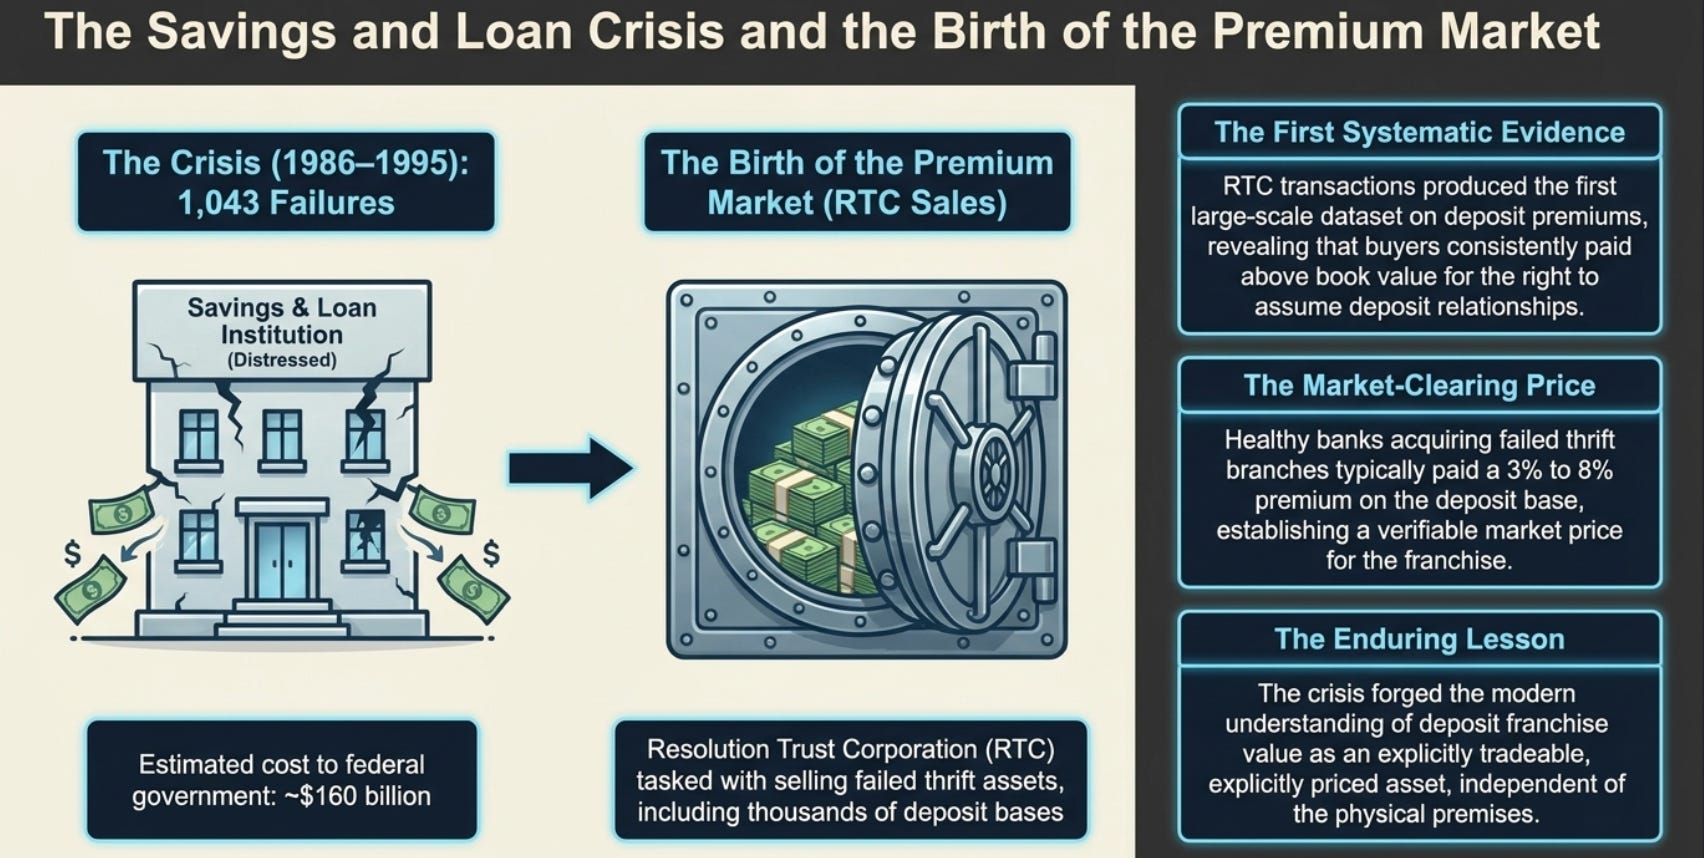
The modern understanding of deposit franchise value as an explicitly tradeable, explicitly priced asset was forged in the wreckage of the US Savings and Loan crisis of the 1980s and early 1990s. Between 1986 and 1995, approximately 1,043 savings and loan institutions failed, at a total estimated cost to the federal government of approximately $160 billion. The Resolution Trust Corporation — the federal agency created to manage the disposition of failed thrift assets — was tasked with selling thousands of branch networks, deposit bases, and loan portfolios to healthy acquirers.
In the process of these sales, something important was documented for the first time at scale: buyers were consistently willing to pay meaningful premiums above the book value of the deposit base specifically for the right to assume those deposits. A branch with $100 million in stable savings accounts and checking accounts was worth more than the physical building and the furniture inside it. The difference — the premium for the deposit relationships — was the market price of the core deposit intangible.
The FDIC and RTC transactions of this era produced the first systematic dataset on deposit premiums, and they revealed that buyers considered stable, low-cost deposits valuable enough to pay for even in distressed circumstances. Healthy banks acquiring failed thrift branches would typically pay 3% to 8% of the deposit base as a premium above the deposit liability face value, simply for the right to assume those customer relationships and their associated funding advantage.
This market-clearing evidence established that a bank’s deposit base is not merely a source of funding — it is a franchise with a knowable market price. The crisis created the intellectual infrastructure for valuing something that had previously been invisible, and the valuation methodology that emerged has been refined and updated through every subsequent credit cycle.
The lesson from the S&L era was simple: the market for bank assets has always recognised the deposit franchise as something worth paying for. The public equity market has never consistently done so. The gap between those two realities — the M&A market’s deposit premium and the public equity market’s P/TBV multiple — is where the money has been made by investors who understood what they were actually buying.
The Washington Mutual Collapse: What Happens When the Deposit Franchise Is Hollow
To understand why a genuine, sticky deposit franchise is valuable, it helps enormously to study its opposite — a bank whose deposit base turned out to be fundamentally fragile, despite appearing healthy on the balance sheet.
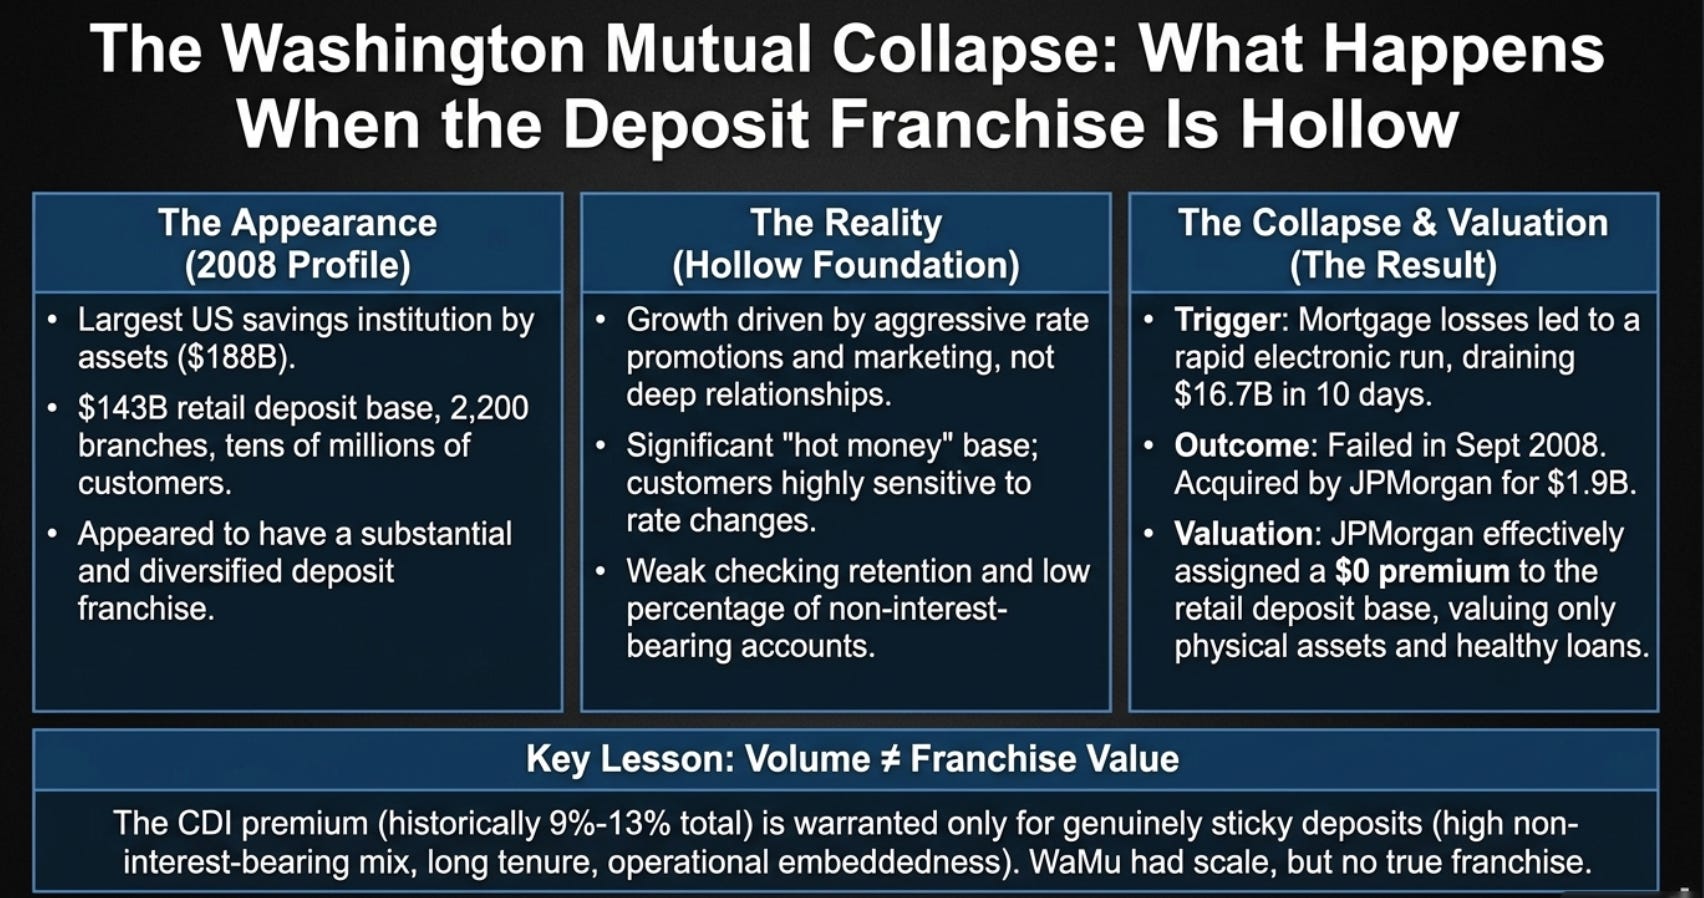
Washington Mutual (WaMu) was the largest US savings institution by assets when it failed in September 2008 — the largest bank failure in American history at the time. On its balance sheet, it held approximately $188 billion in assets and had a retail deposit base of approximately $143 billion from roughly 2,200 branches across the United States. By conventional metrics, WaMu looked like a bank with a substantial deposit franchise: large deposit base, broad geographic coverage, tens of millions of retail customers.
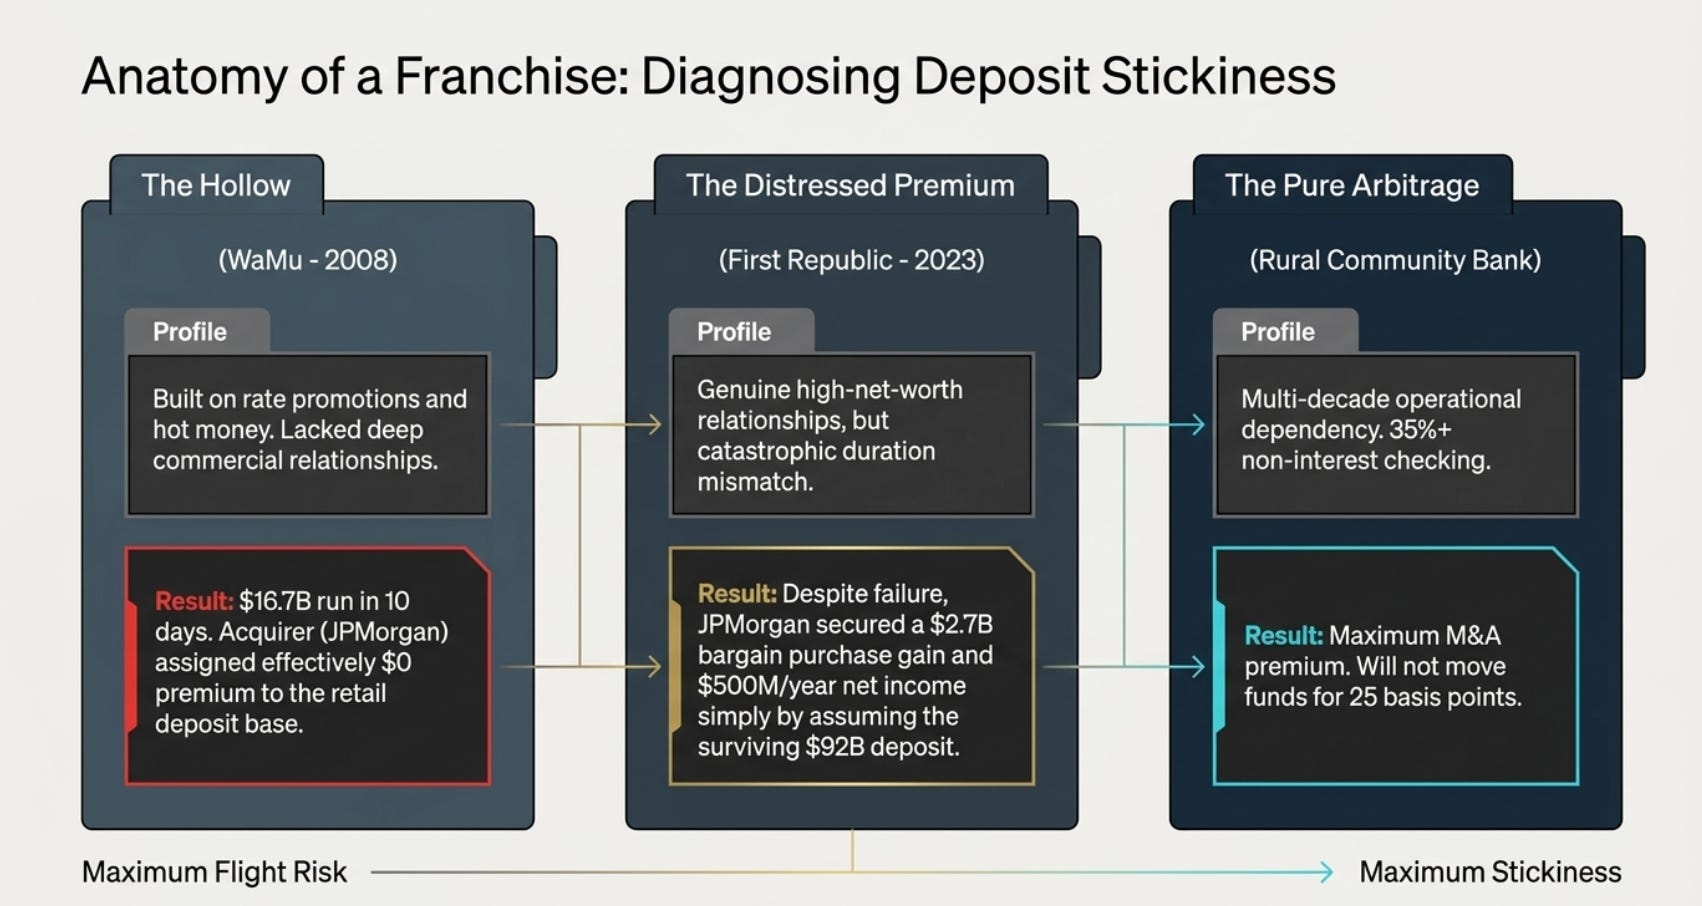
But WaMu’s deposit base was not what it appeared. The bank had aggressively expanded its branch network through the 1990s and 2000s into markets where it had no historical customer relationships, competing for deposits through rate promotions and aggressive marketing rather than through the embedded relationships that characterise genuine core deposit franchises. A significant portion of its retail deposits were “hot money” — accounts opened by rate-sensitive customers who would move their funds to any competitor offering 25 basis points more. WaMu’s checking account retention rates, its percentage of non-interest-bearing accounts, and its customer longevity metrics were all weaker than a bank that had spent generations building relationships in a single community.
When the bank’s mortgage losses became public knowledge in mid-2008, depositors began withdrawing funds — not through the slow, orderly run that the franchise-based deposit model is designed to resist, but through a rapid electronic exodus that drained approximately $16.7 billion in deposits over ten days in September 2008. The deposit franchise — which had looked impressive in terms of total size — proved to be brittle because it had been built on rate competitiveness rather than on relationship stickiness.
JPMorgan Chase acquired WaMu’s banking operations from the FDIC on September 25, 2008, for $1.9 billion — effectively paying for the physical branch network and the healthy performing portion of the loan portfolio, but implicitly assigning zero premium to a deposit base that had just demonstrated it was not a genuine franchise. The CDI recorded by JPMorgan in the WaMu acquisition was a fraction of what comparable deposit volumes would have fetched for a bank with genuine community banking relationships.
The lesson from WaMu is the crucial qualifier on everything else in this paper: not all deposits are created equal, and not all deposit bases carry the same franchise value. The CDI premium — 2.5% to 3.0% of core deposits in a typical community bank acquisition — is warranted only for deposits that are genuinely sticky. The diagnostic for stickiness is not deposit volume. It is the proportion of non-interest-bearing checking accounts, the average customer tenure, the rate sensitivity (measured by how much the deposit mix shifted during the 2022 to 2023 rate increases), and the operational embeddedness of the customer relationships (payroll processing, business cash management, trust services that are practically impossible to move without significant disruption).
A community bank in a small Midwestern town whose business customers have been depositing their operating accounts there for thirty years, whose mortgage customers also have checking accounts there, and whose deposits barely moved during the 2022 rate cycle — that bank has a genuine franchise. A bank that has grown its deposits 40% in three years through rate promotions and digital account opening — that bank may have a large deposit base but a small or zero franchise premium.
First Republic’s Collapse and JPMorgan’s Bargain: The Deposit Franchise Valued in Real Time
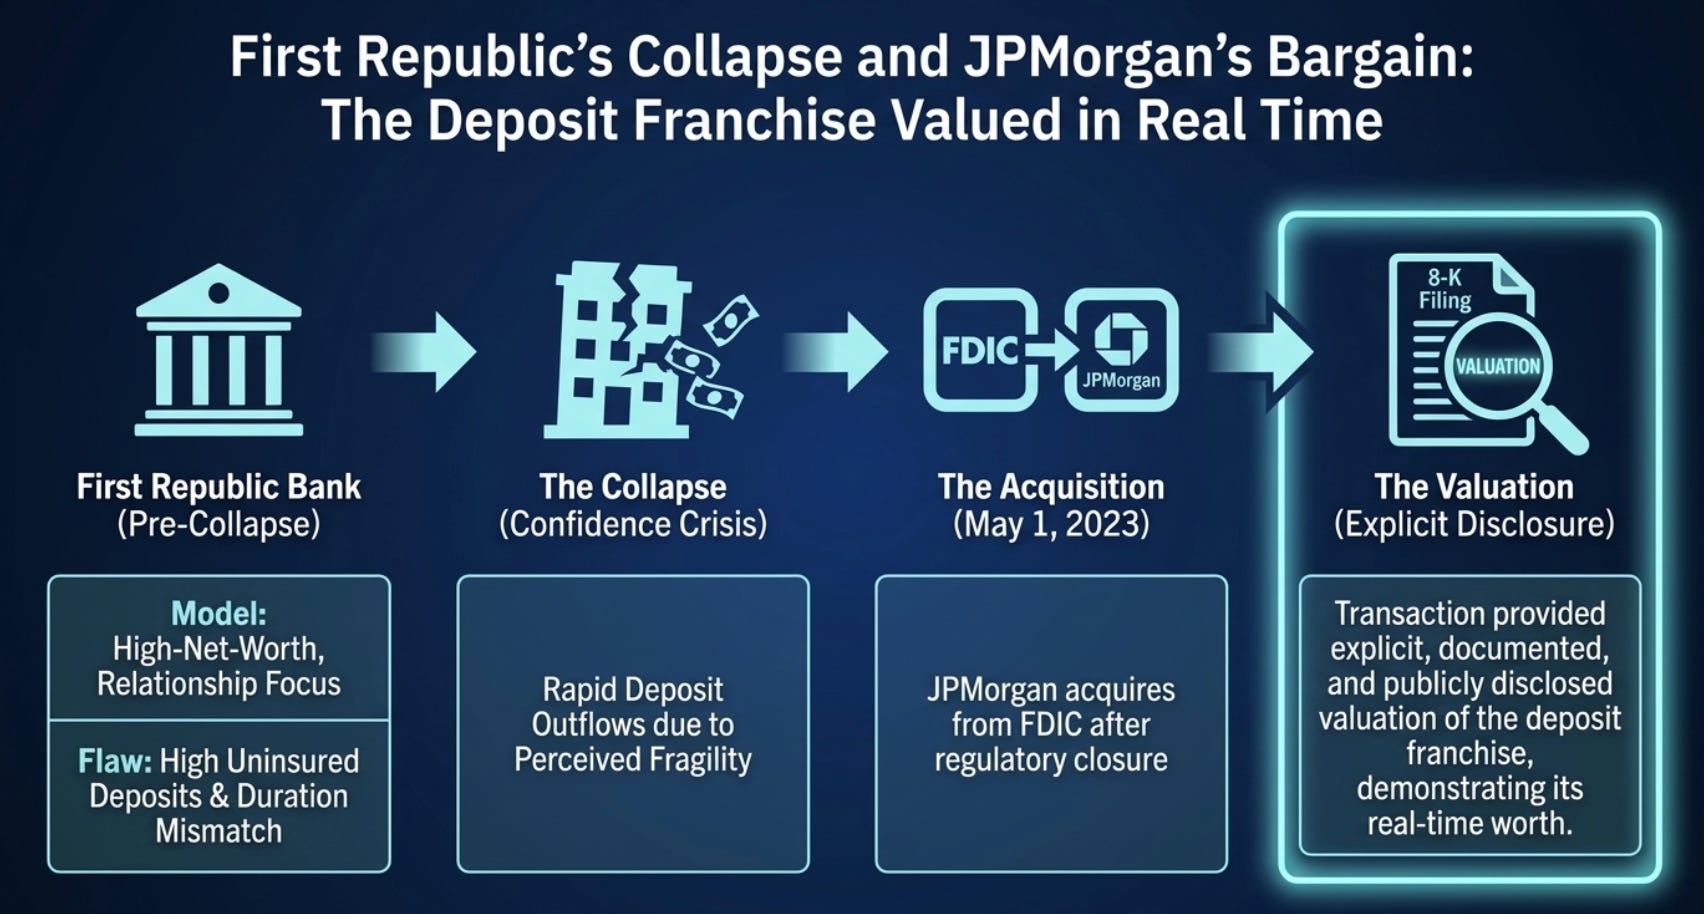
On May 1, 2023, JPMorgan Chase acquired substantially all of the assets and assumed substantially all of the deposits and certain liabilities of First Republic Bank from the FDIC, following the California Department of Financial Protection and Innovation’s closure of First Republic on that date. The transaction produced one of the most explicit, documented, and publicly disclosed valuations of a deposit franchise in modern banking history — because JPMorgan’s 8-K filings disclosed the transaction’s mechanics in detail.
First Republic had been a genuinely differentiated bank. Its business model was built on serving high-net-worth individuals and their associated businesses in major US metropolitan markets — San Francisco, Los Angeles, New York, Boston, and Palm Beach. Its customers were wealthy professionals: doctors, lawyers, technology executives, and venture capitalists. Its relationship banking model created genuine stickiness: First Republic’s bankers provided concierge-level service, knew their clients personally, and structured banking relationships that spanned mortgages, business accounts, investment services, and trust accounts. Its non-interest-bearing deposits were a substantial fraction of its total deposit base, funded at zero cost, from customers who valued the relationship more than the interest rate.
This was, in isolation, a valuable franchise. But First Republic had a structural problem that the banking world only fully understood during the 2022 to 2023 rate cycle: it had funded extraordinarily cheap fixed-rate jumbo mortgages using short-duration deposits, creating a duration mismatch that became catastrophically visible when the Federal Reserve raised rates from near zero to 5% in fourteen months. As its fixed-rate mortgage assets remained anchored at low yields, its deposit costs rose and its available-for-sale securities portfolio was marked to market at devastating losses. When Silicon Valley Bank’s failure in March 2023 triggered a flight to safety among uninsured depositors broadly, First Republic — which had a high proportion of uninsured deposits given the wealth of its customers — lost approximately $100 billion in deposits in days. The franchise was still real; the balance sheet was insolvent.
JPMorgan’s 8-K filed in conjunction with the May 1, 2023 acquisition disclosed that the transaction included approximately $92 billion in deposits and approximately $173 billion in loans and $30 billion in securities. JPMorgan paid $10.6 billion to the FDIC and received $50 billion in FDIC-provided term financing plus loss-share agreements on the loan portfolio. The post-closing balance sheet disclosed by JPMorgan included $1.1 billion in intangibles — the CDI recognised on acquisition — for approximately $92 billion of acquired deposits. That CDI represents approximately 1.2% of the acquired deposit base, notably below the typical 2.5% to 3.0% for a healthy community bank, reflecting the reality that some of those deposits were the most rate-sensitive in First Republic’s portfolio and the customer relationships, while genuine, had been stress-tested severely.
The transaction was immediately accretive. JPMorgan disclosed that the acquisition was expected to generate more than $500 million of incremental net income per year — entirely from the interest rate spread on the acquired loan portfolio and the funding advantage of assuming $92 billion in deposits at their contractual cost rather than at wholesale market rates. JPMorgan also recognised a bargain purchase gain of $2.7 billion — the excess of the fair value of assets acquired over the consideration paid — reflecting the FDIC’s urgency in resolving the situation and JPMorgan’s willingness and ability to absorb the complexity.
The bargain purchase gain tells you something important. JPMorgan — the most financially sophisticated bank acquirer in the world, with the largest balance sheet and the most analytical resources — looked at First Republic’s deposits, its loan portfolio, and its customer relationships, and concluded that the whole package was worth materially more than what the FDIC was charging for it. Even in a distressed, rushed, weekend-auction context, the deposit franchise had enough residual value that the acquirer received a gain simply by assuming it. The deposit base was not worthless just because the institution had failed. It had failed because of an asset-liability mismatch problem, not because the customers were gone or the relationships were severed.
The public equity investor who held First Republic shares through 2022 — watching the stock fall from its mid-2021 peak of approximately $220 per share to $20 per share by early 2023 — was watching the market price in terminal failure risk. The market was correct that the institution was insolvent on a mark-to-market basis. But the market was not pricing the deposit franchise separately from the institution. An owner who could have carved out only the deposit relationships and customer franchise — removing the problem loan book and the duration mismatch — would have found something worth billions. The equity market, unable to separate the franchise from the flawed balance sheet structure, simply sold both together at zero.
The Community Bank in the Ozarks: Sixty Years of Nothing on the Balance Sheet
The most instructive case study for the pure deposit franchise arbitrage is not a large bank or a failed institution. It is the community bank in a secondary market that has never made headlines, never had an investment banking relationship, and never been the subject of an analyst report. There are thousands of them across America — in rural Oklahoma, in small-town Texas, in Appalachian Kentucky — and they represent the clearest version of the asset-valuation gap described in this paper.
Consider a $1.5 billion community bank in a mid-sized regional market, founded in 1962. Over sixty years, it has gathered a deposit base that is heavily weighted toward non-interest-bearing checking accounts: local businesses, agricultural operations, local governments, and long-tenure retail customers who have maintained their accounts for thirty or forty years and will not change banks for 25 basis points. Non-interest-bearing demand deposits constitute approximately 35% of its $1.3 billion total deposit base — roughly $455 million in zero-cost funding. The remaining deposits carry an average cost of perhaps 1.8% in a normalised rate environment.
The bank’s blended deposit cost is approximately 1.2%. The one-year Treasury bill in a normalised environment yields approximately 4.5%. The funding advantage — the annual economic value of the deposit franchise — is approximately 3.3% on $1.3 billion, or approximately $43 million per year.
The bank’s tangible book value is $185 million. It trades in thin, infrequent market transactions at approximately 1.1x tangible book — about $200 million in market capitalisation. At $200 million, you are paying roughly $154 per $1,000 in deposits for the whole bank.
Now apply the M&A market’s pricing. CDI at the historical average of 2.7%: $1.3 billion × 2.7% = $35.1 million. Deposit premium at the historical average of 7%: $1.3 billion × 7% = $91 million. Total deposit franchise value above tangible book: $126 million. Against tangible book of $185 million, the CDI-adjusted tangible book value of this bank is approximately $311 million. It is trading at $200 million. You are buying a verified, documented, M&A-comparable deposit franchise at a 35% discount to what a strategic acquirer would pay for it in cash.
Importantly, this is not a forecast of what the bank might earn in the future. It is not a model of what the deposit franchise might be worth under various rate scenarios. It is what another business owner would pay for now. The analysis is entirely backward-looking and present-tense. No forecast required.
The bank’s management that discloses the deposit composition in detail. The total deposits, the non-interest-bearing portion, the time deposit portion, and the interest cost of each category are all public information, reported with 30 to 45 days of lag. The CDI and deposit premium percentages come from Mercer Capital’s annual CDI update, which is published and freely available. Any investor with internet access and a calculator can perform this analysis in approximately twenty minutes. But almost no one does, because the attention is on the earnings per share, the price-to-book ratio, and whether the bank is going to grow its loan portfolio. The franchise is invisible because the accountant says it is zero, and the analyst’s model starts with the accountant’s number.
PART VI: THE RATE CYCLE AND THE CDI — HOW INTEREST RATES REVEAL THE FRANCHISE
2022 to 2023: The Great Stress Test of Every Deposit Franchise in America
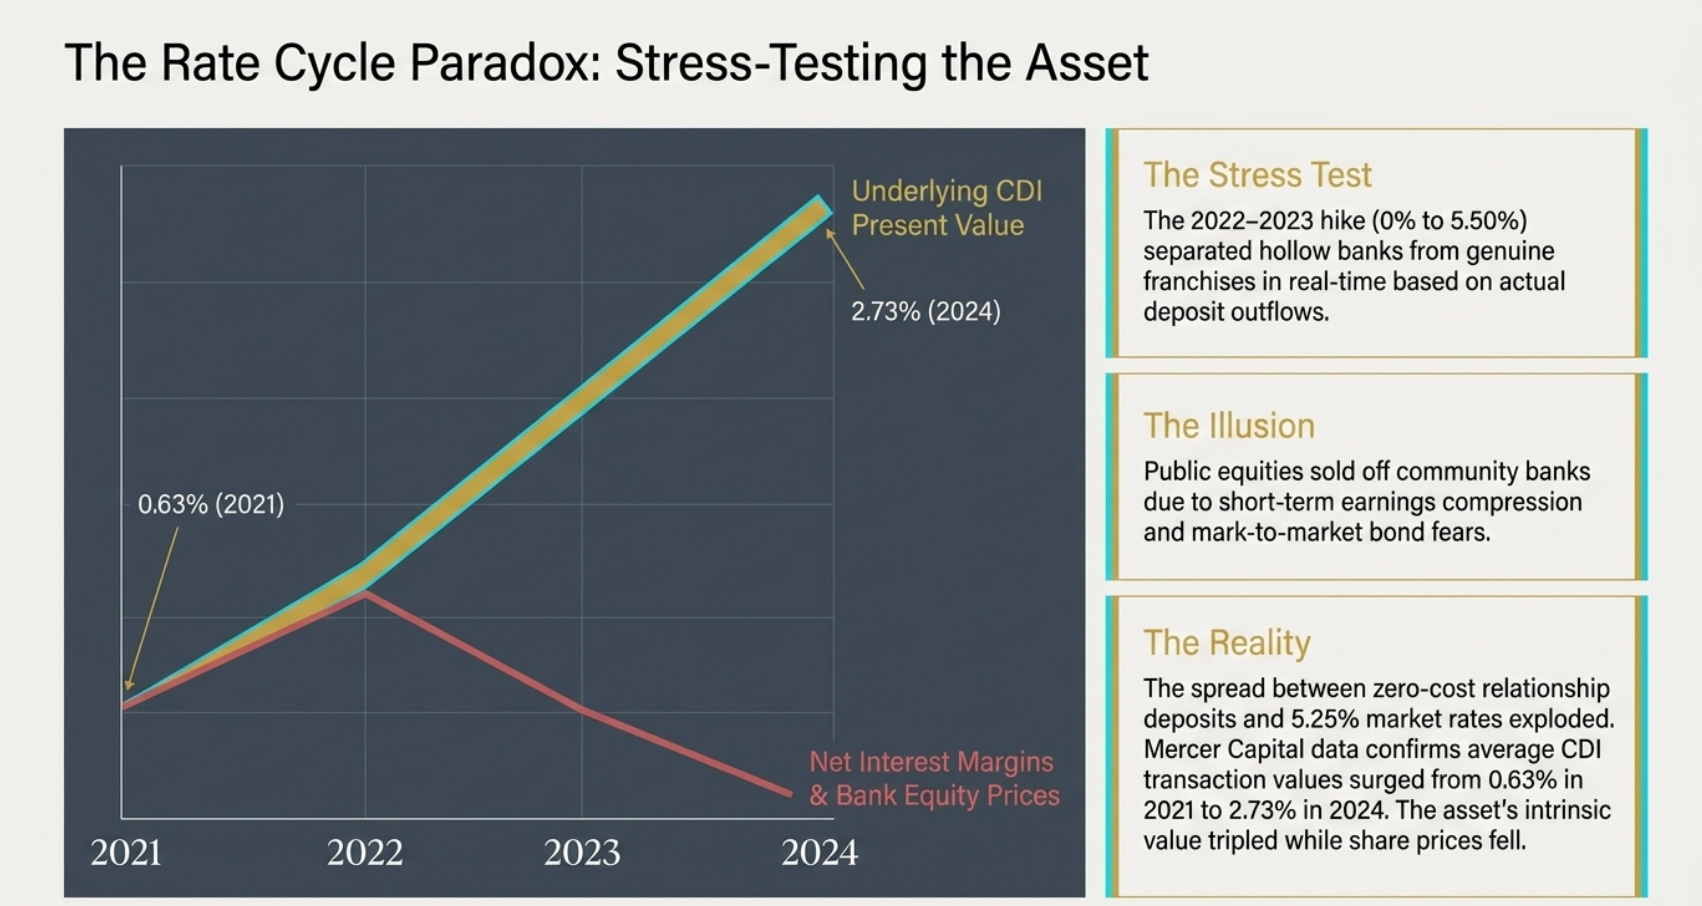
The Federal Reserve’s rate-hiking cycle from March 2022 to July 2023 — which took the Federal Funds Rate from near zero to 5.25 to 5.50% in sixteen months — was the most aggressive monetary tightening in forty years. For bank investors, it was also the largest real-world stress test of deposit franchise quality ever administered in a single concentrated period. No theoretical model, no earnings projection, and no historical scenario analysis produced a more accurate measure of which deposit franchises were real and which were not than simply watching what happened to each bank’s deposit base between Q1 2022 and Q4 2023.
Banks with genuine core deposit franchises — strong non-interest-bearing proportions, deeply embedded business relationships, customers whose deposits were operationally necessary rather than rate-driven — experienced moderate deposit repricing. Their customers, who had been depositing money at 0% or near-0% for years, upgraded some portion of their savings to money market accounts, but retained their operating accounts and maintained their primary banking relationships. These banks saw their non-interest-bearing deposit percentage decline from, say, 35% to 25% of total deposits — a meaningful shift, but not a collapse. Their cost of deposits rose, but their franchise proved durable.
Banks without genuine franchises — those whose deposit growth had been driven by rate promotions, digital acquisition channels, or wholesale brokered deposits — experienced severe outflows. When the rate environment changed and competitors offered better yields, rate-sensitive customers left. These banks were forced to replace outflowing deposits with FHLB advances, brokered CDs, and other wholesale funding at market rates — eliminating the funding cost advantage that had previously made their net interest margins appear attractive.
The rate cycle did not create this distinction. It revealed it. The franchise quality difference between a genuine community bank with sixty years of embedded relationships and a newer, rate-driven deposit gatherer existed before March 2022. It just was not visible until the stress test exposed it.
For the investor using the CDI-adjusted tangible book methodology, the rate cycle provides the most important diagnostic tool available: what actually happened to deposit volumes and non-interest-bearing ratios during the 2022 to 2023 period? A bank whose non-interest-bearing deposits declined by less than 20% from their peak during the cycle, and whose total deposit volumes remained stable, has a demonstrated, stress-tested franchise. A bank whose non-interest-bearing deposits halved and whose total deposits declined materially has told you directly that its franchise is weaker than the balance sheet’s geographic breadth might suggest.
The 2022 to 2023 cycle also interacted with CDI values in a way that the Mercer Capital data documents clearly. CDI values — which are driven by the spread between a bank’s deposit cost and the prevailing market interest rate — were artificially depressed during the 2021 near-zero rate environment (averaging only 0.63% for all of 2021, per Mercer Capital’s data) because the spread between zero-cost deposits and near-zero market rates was minimal. As rates rose and the spread between core deposit cost and market rates widened dramatically, CDI values surged: averaging 1.61% for all of 2022, 2.58% for 2023, and 2.73% to 2.74% for 2024. The deposit franchise became more valuable as interest rates rose, because the economic advantage of holding low-cost deposits relative to the market rate became larger.
This creates a specific investment dynamic that the P/E ratio cannot capture. Community bank stocks often decline in rate-rising environments because earnings are initially compressed — asset yields reprice slower than liability costs for many banks, temporarily squeezing net interest margins. The P/E ratio rises as earnings fall. Investors see an “expensive” stock. But the underlying deposit franchise has become more valuable in present-value terms, because the funding cost advantage has widened. The P/E ratio is pointing in the wrong direction at exactly the moment the franchise value is increasing most rapidly.
PART VII: HOW TO VALUE THE DEPOSIT FRANCHISE — THE OWNER’S FRAMEWORK
Four Steps, No Model Required
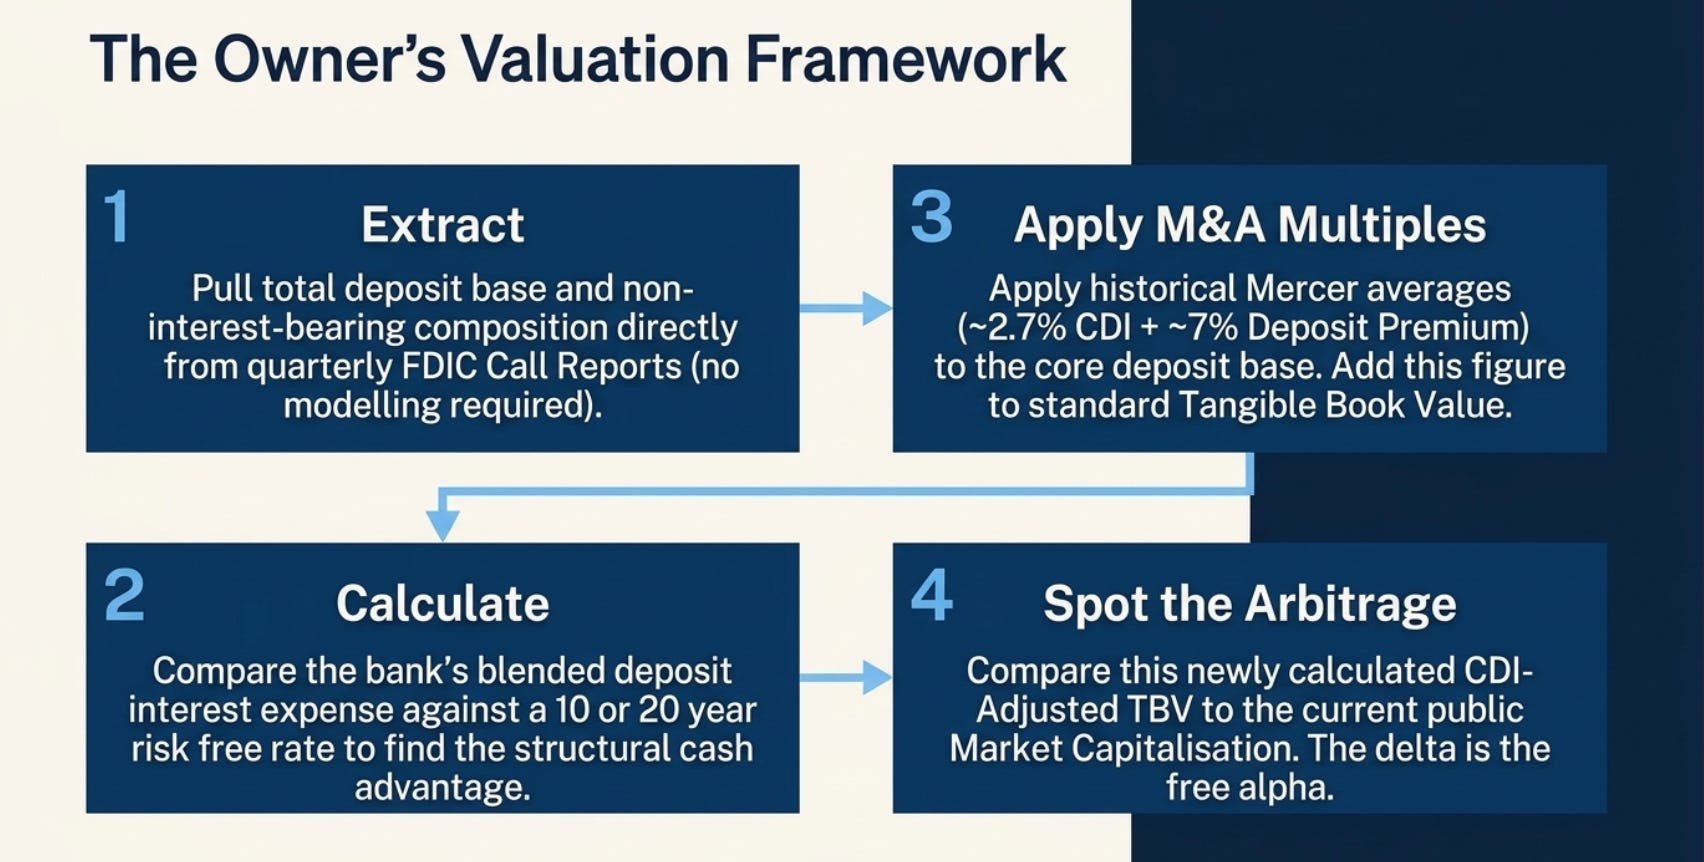
The business owner’s analysis of a community bank’s deposit franchise does not require a financial model, a DCF, or any forecast of future interest rates. It requires four pieces of information, all publicly available:
Step one: total deposit base and its composition. Deposits disclosed by US banks are mainly separated into 2 categories: non-interest-bearing demand deposits, interest-bearing demand deposits, savings accounts, time deposits under $250,000, and time deposits over $250,000. This breakdown tells you the composition of the funding base. The non-interest-bearing demand deposits are the highest-quality funding — the franchise’s crown jewel. The time deposits over $250,000 are the lowest quality — the most rate-sensitive, least sticky, most likely to reprice or leave.
Step two: the bank’s actual deposit cost versus the risk-free rate. The fillings of the company should disclose the total interest expense on deposits. Divide this by average deposits and you have the bank’s actual blended deposit cost. Compare this to the current federal funds rate or the one-year Treasury yield. The spread between these two numbers is the current annual funding advantage per dollar of deposits. This is the CDI’s cash flow, calculated at current rates, with no forecast.
Step three: apply the M&A-documented CDI and deposit premium percentages to the core deposit base (note that you can even skip this step to be safe). Using Mercer Capital’s annual CDI Update, take the current CDI average (approximately 2.5% to 2.7% as of 2024 to 2025) and the average deposit premium range (6% to 10%) and apply them to the bank’s core deposit base. This produces the deposit franchise’s M&A-comparable value. Add this to tangible book value to produce the CDI-adjusted tangible book value.
Step four: compare the market price to the CDI-adjusted tangible book. If the market is pricing the bank at 1.1x or 1.2x unadjusted tangible book, but at 0.7x to 0.9x CDI-adjusted tangible book, the market is not correctly pricing the franchise. The discount to CDI-adjusted tangible book represents the portion of the franchise value that the market is giving you for free.
PART VIII: CONFIRMED CATALYSTS — WHY THE FRANCHISE VALUE GETS RECOGNISED
Catalyst 1: The Bank M&A Wave Is Already in Motion and Structurally Accelerating
Community bank consolidation in the United States has been accelerating for decades and shows no sign of reversing. There were approximately 14,500 FDIC-insured institutions in 1990. By 2024, that number had fallen below 4,600 — a 68% reduction over 34 years, driven almost entirely by voluntary mergers rather than failures. The pace of consolidation shows no sign of slowing.
When a community bank is acquired — voluntarily, not in distress — the deposit franchise is valued explicitly and paid for in cash. The CDI is recognised on the acquirer’s books. The deposit premium is paid to the target’s shareholders. Every merger proxy statement walks through exactly this analysis, disclosed in the fairness opinion section where the investment banker explains what the deposit franchise is worth and why the offer price is fair.
For shareholders of community banks in consolidating markets — which is effectively every market in the United States — the M&A catalyst is not speculative. It is a statistical certainty over a five to ten year holding period for most community bank investments. The question is not whether the deposit franchise will eventually be valued at M&A comparable prices. It is when.
This creates a specific investment framework: identify community banks trading at significant discounts to CDI-adjusted tangible book, with demonstrated franchise quality (stable non-interest-bearing proportions through the 2022 to 2023 rate cycle), located in markets with active M&A consolidation, and hold them. The catalyst — a merger announcement at a price that reflects the deposit franchise’s full economical value — is a confirmed, documented, recurring event in the US banking industry at a rate of approximately 200 to 300 transactions per year.
Catalyst 2: The Silicon Valley Bank Aftermath Raised the Price of Safe Deposits — The Quality Of Your Deposit
The failures of Silicon Valley Bank, Signature Bank, and First Republic in March and May 2023 changed something fundamental about how bank regulators and large depositors think about banking relationships. The speed with which uninsured deposits fled these institutions — enabled by digital banking and social media — demonstrated that uninsured deposits at certain institution types were not as stable as previously assumed. The regulatory response included elevated scrutiny of uninsured deposit concentrations, new reporting requirements, and ongoing discussions about extending deposit insurance to business operating accounts.
The institutional memory of 2023 has created incremental demand for insured, relationship-based deposit relationships — the kind that community banks with genuine franchises provide — from business customers who previously would have moved freely between institutions for marginal rate differences. A business owner who watched colleagues scramble to move payroll deposits out of a failing bank in March 2023 is now more likely to value the stability and insurance coverage of a relationship-based community bank, even at a modest cost in yield. This structural shift — away from rate-driven deposit gathering toward franchise-relationship banking — advantages exactly the institutions whose deposit franchises are most undervalued by conventional financial metrics.
Catalyst 3: Rising Rates Have Widened CDI Spreads, Making Franchises More Valuable — Before the Market Has Caught Up
As documented above, CDI values rise when the spread between core deposit costs and market interest rates widens. The post-2022 rate environment has been the most favourable for CDI valuations in two decades. Banks with strong non-interest-bearing deposit franchises — which continued to cost zero to 0.5% even as the federal funds rate reached 5.25% — were funding their loan books at costs dramatically below market rates, generating extraordinary net interest margins from a funding advantage that flows entirely from the franchise.
The public equity market, focused on near-term earnings compression from the initial rate repricing, did not fully reward these banks in 2022 and 2023. Investors saw deposit betas (how much a bank changes the interest rates it pays on deposits in response to changes in central bank policy rates) rising, net interest margins compressing, and unrealised losses on bond portfolios. They sold. But for the banks with genuine franchises — those whose deposit betas were low because their customers were not moving — the compression was temporary and the underlying franchise value was growing. The M&A market, which prices deposits on CDI and premium percentages, has recognised this by paying CDI values in 2024 of 2.73% — well above the 0.63% of 2021. The public equity market has been slower to reprice.
CONCLUSION: THE FRANCHISE THAT LIVES IN THE FOOTNOTE

The core deposit intangible is, in one sense, the simplest asset in this series of papers. You do not need geological engineering to measure it. You do not need thermodynamic calculations. You do not need to understand the Hall-Héroult process or the unit of production depletion method.
You need to know one thing: what a business owner pays for deposits, versus what the stock market is charging for those same deposits in the public equity market. The gap between those two numbers — is the arbitrage. It has existed consistently, in every interest rate environment, across every credit cycle. It exists because GAAP requires a transaction to occur before an intangible can be recognised, and because the public equity market takes the GAAP balance sheet as its starting point rather than performing the owner’s analysis from scratch.
The woman who built a career in community banking, the bank board member who has watched three generations of a family move their accounts to the same institution, and the regional bank M&A advisor who prices deposit franchises for a living — they all know what the deposit base is worth. They have known it for decades. The number is not hidden. It is in every bank merger proxy statement. It is disclosed in the footnotes of fillings.
The public equity market simply does not look for it. It looks for P/E, P/TBV, and earnings per share. And in looking for those things, it consistently assigns zero value to the most durable, most irreplaceable, most structurally advantaged asset a community bank possesses: the relationship it has built, over decades, with the business owners, farmers, and families who have trusted it with their money and their operating accounts, and who will be back next year, and the year after that, and the year after that.
That relationship costs nothing to maintain. It generates tens of millions of dollars per year in funding advantage. It is worth 6% to 10% of deposits in cash in the M&A market. And on the balance sheet, it is worth exactly zero.
That zero is where the arbitrage is.
This white paper is for educational and informational purposes only. CDI and deposit premium data cited is drawn from Mercer Capital’s publicly available Core Deposit Intangibles Update series (2017 through 2025), based on S&P Capital IQ Pro data. JPMorgan Chase acquisition data is drawn from JPMorgan’s Form 8-K filings with the SEC dated May 1, 2023 and the company’s Q2 2023 earnings presentation filed with the SEC. FDIC deposit composition data is publicly available through the FDIC’s Statistics on Depository Institutions database. Nothing herein constitutes investment advice.
If you like this read, check out my other writings 👇
Rust, Rigs, and the Recurring Revenue Hidden in Plain Sight: A Deep Dive into Beng Kuang Marine (SGX: BEZ)

The Old Steel and the Sea: Why You Should Care About a Ship Maintenance Company
Investment Reflection #2 — The Grand Play: 100 Years of the World’s Nations as Characters in the Greatest Story Ever Told

“The world is not a chessboard. It is a living organism, where every cell — every nation — eats, competes, cooperates, and occasionally tries to eat the others. Understanding it requires not just memorizing moves, but understanding hunger.”

The Tide Is Going Out: Commodity Houses, Private Credit, and the AI Debt Bomb

Start Here: What This Article Is About
Why I Passed on Graftech (EAF): Riding The Battery Hype, Or Perhaps Not...

There is a kind of company that is the most dangerous thing in investing. It is not the fraudulent company. It is not the obviously bad company with terrible products and incompetent management. Those are easy — you just avoid them. The truly dangerous company is the one with a
The Beautiful Trap: Why I'm Passing on The Hour Glass (SGX: AGS)

There’s a peculiar kind of investment that keeps you up at night — not because it’s bad, but because it’s genuinely good. Good enough to admire. Not good enough to buy.
The Diamond in the Rough That Isn't Quite Yours: Why I Passed on Boustead (SGX: F9D)

There is an old saying that investors have borrowed, bent, and quoted so many times it has nearly lost its sharpness: a bird in the hand is worth two in the bush. Warren Buffett, characteristically, gave it a precise mathematical form. The value of any investment, he wrote, is determined by three questions:
The Schoolteacher's Secret Insurer: Why Horace Mann (NYSE:HMN) Is Sitting on My Watchlist

“The stock market is a device for transferring money from the impatient to the patient.” — Warren Buffett

The Dormitory King That Couldn't Leave Home: Why I Passed on Centurion (SGX: OU8)

There is a deceptively simple question that Warren Buffett borrowed from Aesop’s ancient fable, and has repeated across decades of shareholder letters: “How many birds are in the bush? How sure are you they’re there? And how long until you get them out?”
The Children's Place: A $90 Million Bet on a Company That Used to Be Worth $2 Billion (NYSE: PLCE)

There is a classic scene in every heist movie. The detective walks into a room, sees the chalk outline, the scattered evidence, the broken window, and immediately knows something went terribly wrong long before anyone called the police. You do not need the full autopsy report to read the body.
World War 3 In Iran and Why Oil Price Will Continue Increasing — It Arrived Sooner Than Anyone Expected

This is Part 2 of a continuing analysis of California Resources Corp (CRC). Part 1 built the foundational investment case: a company trading at $44 per share against a conservative intrinsic value of $108–$156, built on 567 million barrels of proved developed oil reserves in California, and a management team spending hundreds of millions buying back its…
The Most Overlooked Oil Company in America — And Why That Might Be the Opportunity of the Decade

Date of analysis: 28 December 2025
The Art Of Saying No - MYPS: Playstudios Inc

PLAYSTUDIOS (MYPS) is a Las Vegas-based mobile gaming company that operates free-to-play social casino games and a loyalty platform called playAWARDS, which lets players redeem points for real-world rewards at places like MGM Resorts, Norwegian Cruise Line, and Wolfgang Puck restaurants. On the surface, this sounds like a clever moat. A loyalty program.…
The Art Of Saying No - UGP: Ultrapar Participacoes S.A (Part 2 of 2)

Question 2: How Certain Are You?
The Art Of Saying No - GLIBK: GCI Liberty Inc

Picture this: a single telecommunications company — the dominant one — serves over 200 communities scattered across the largest state in the United States. Alaska. A state with just over one person per square mile. A state where 39% of residents are underserved by broadband. A state where, until recently, some villages received internet via satellite li…

The Art Of Saying No - UGP: Ultrapar Participacoes S.A (Part 1 of 2)

The Setup: A Value Investor Dream?


The Art of Saying No - RIG: Transocean LTD

“The difference between successful people and really successful people is that really successful people say no to almost everything.” — Warren Buffett
The Art of Saying No - KPRX: Kiora Pharmaceuticals Inc

“The difference between successful people and really successful people is that really successful people say no to almost everything.” — Warren Buffett
The Art of Saying No - DNUT: Krispy Kreme Inc

“The difference between successful people and really successful people is that really successful people say no to almost everything.” — Warren Buffett

🎓 A Business Strategy Primer Part 7 - Learning From Great Companies

The Billion-Dollar Playbook: How Market-Based Management Powered Koch Industries’ Unstoppable Rise
The Art of Saying No - MRX: Marex Group PLC

“The difference between successful people and really successful people is that really successful people say no to almost everything.” — Warren Buffett


The Art of Saying No - SFIX: Stitch Fix Inc

“The difference between successful people and really successful people is that really successful people say no to almost everything.” — Warren Buffett
🎓 A Business Strategy Primer Part 2 - Brainstorming Solutions With Value At The Core

Creating An Irresistible Offer
The Art of Saying No - TDOC: Teladoc Health Inc

“The difference between successful people and really successful people is that really successful people say no to almost everything.” — Warren Buffett

The Art of Saying No - MDU: Mdu Resources Group Inc

“The difference between successful people and really successful people is that really successful people say no to almost everything.” — Warren Buffett


The Art of Saying No - AFCG: Advanced Flower Capital Inc

“The difference between successful people and really successful people is that really successful people say no to almost everything.” — Warren Buffett
The Art Of Saying No - VYX: NCR Voyix Corp

“The difference between successful people and really successful people is that really successful people say no to almost everything.” — Warren Buffett
The Art of Saying No - VSTS: Vestis Corp

“The difference between successful people and really successful people is that really successful people say no to almost everything.” — Warren Buffett

🛢️Basic Energy Primer Part 2 - Business and Competitive Landscape

The Man Who Bet Everything on Being Wrong
The Art of Saying No - CISS: C3is Inc

“The difference between successful people and really successful people is that really successful people say no to almost everything.” — Warren Buffett
The Art of Saying No - PSHG: Performance Shipping Inc

“The difference between successful people and really successful people is that really successful people say no to almost everything.” — Warren Buffett

The Art Of Saying No - MAGN: Magnera Corp

The Magnera Corporation Analysis Nobody Asked For (But Everyone Needs)
The Art of Saying No - CHR: Cheer Holding Inc

“The difference between successful people and really successful people is that really successful people say no to almost everything.” — Warren Buffett
The Art of Saying No - WIMI: WiMi Hologram Cloud Inc.

“The difference between successful people and really successful people is that really successful people say no to almost everything.” — Warren Buffett
⚡️Alternative Energy Primer Part 3 - Industry and Sector Technicals

The €2.2 Billion Mistake That Revealed Everything
⚡️Alternative Energy Primer Part 2 - Business & Competitive Landscape

The Shipwreck That Changed Everything

🏥 A U.S. Health Insurance (Managed Care Organizations) Sector Primer

1️⃣ Industry Fundamentals & Macro View

