
Preface: Two Ways of Seeing the Same Building
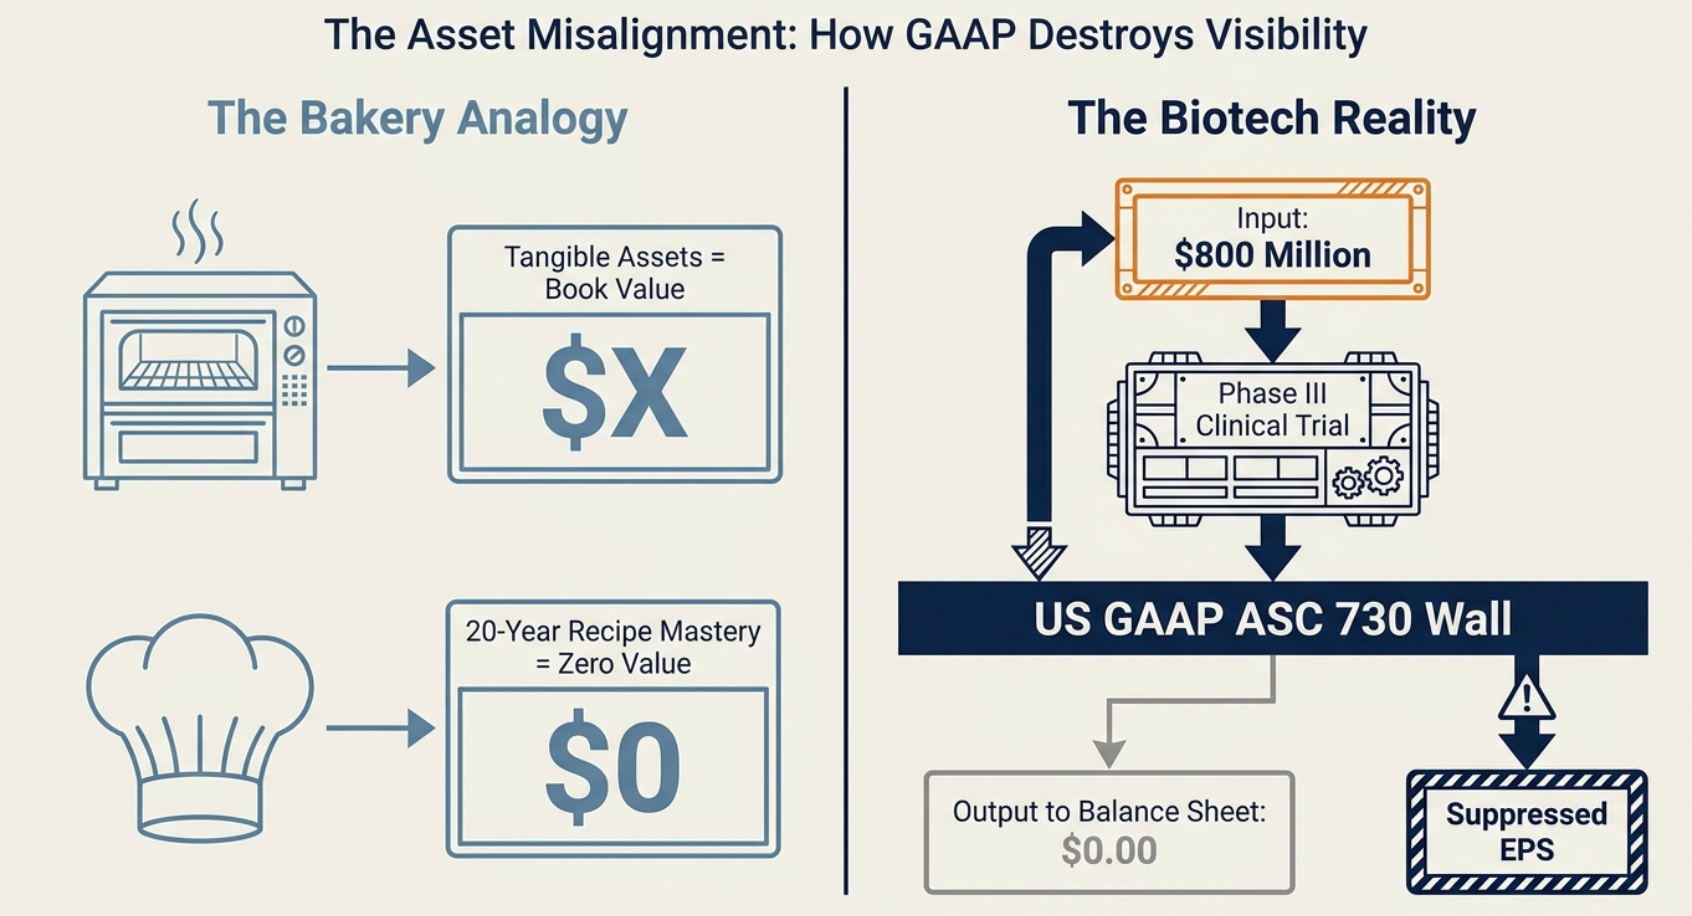
Imagine you own a bakery. Every morning, your baker arrives at 4am, mixes flour, water, and yeast, and four hours later you are selling croissants for $6 apiece. Now imagine your accountant tells you that your bakery’s most important asset — the baker’s twenty-year mastery of laminating dough — is worth exactly zero on your balance sheet. And that the recipe book he spent fifteen years perfecting, the one that makes your croissants different from every other bakery on the block, is also worth zero. The oven and the marble countertop, on the other hand, are listed as assets because you can touch them.
This is not a hypothetical. This is, almost exactly, what happens to every pharmaceutical and biotechnology company operating under US Generally Accepted Accounting Principles (GAAP).
The drug a company spent a decade and $800 million developing? Worth zero on the balance sheet — the entire cost was expensed, year by year, as it was incurred. The late-stage cancer drug sitting in a Phase III clinical trial, where preliminary data shows a 47% tumor response rate in patients who previously had zero options? Zero. The Breakthrough Therapy Designation the FDA handed out — its formal signal that the drug shows substantial improvement over anything that currently exists? Not an asset. Not even a footnote in the asset section.
What is on the balance sheet: the laboratory equipment, the office furniture, some cash, and whatever intellectual property the company acquired when it bought another firm.
The gap between what a building’s balance sheet says and what the building is actually worth has created some of the most extraordinary investment opportunities in the history of public markets. But to find them, you have to stop thinking like an accountant and start thinking like the person who owns the bakery — the person who knows, viscerally, what that recipe book is actually worth.
Part One: The Accounting Paradox — The Harder You Work, the Poorer You Look
Let us start with the foundational absurdity that creates the entire opportunity.
Under ASC 730 — the US accounting rule that governs Research and Development — all R&D spending is expensed in the year it is incurred. This means every dollar a pharmaceutical company spends running clinical trials, hiring scientists, and manufacturing drug substance for regulatory purposes flows directly through the income statement as an operating expense in the year it is spent. None of it accumulates on the balance sheet as an asset.
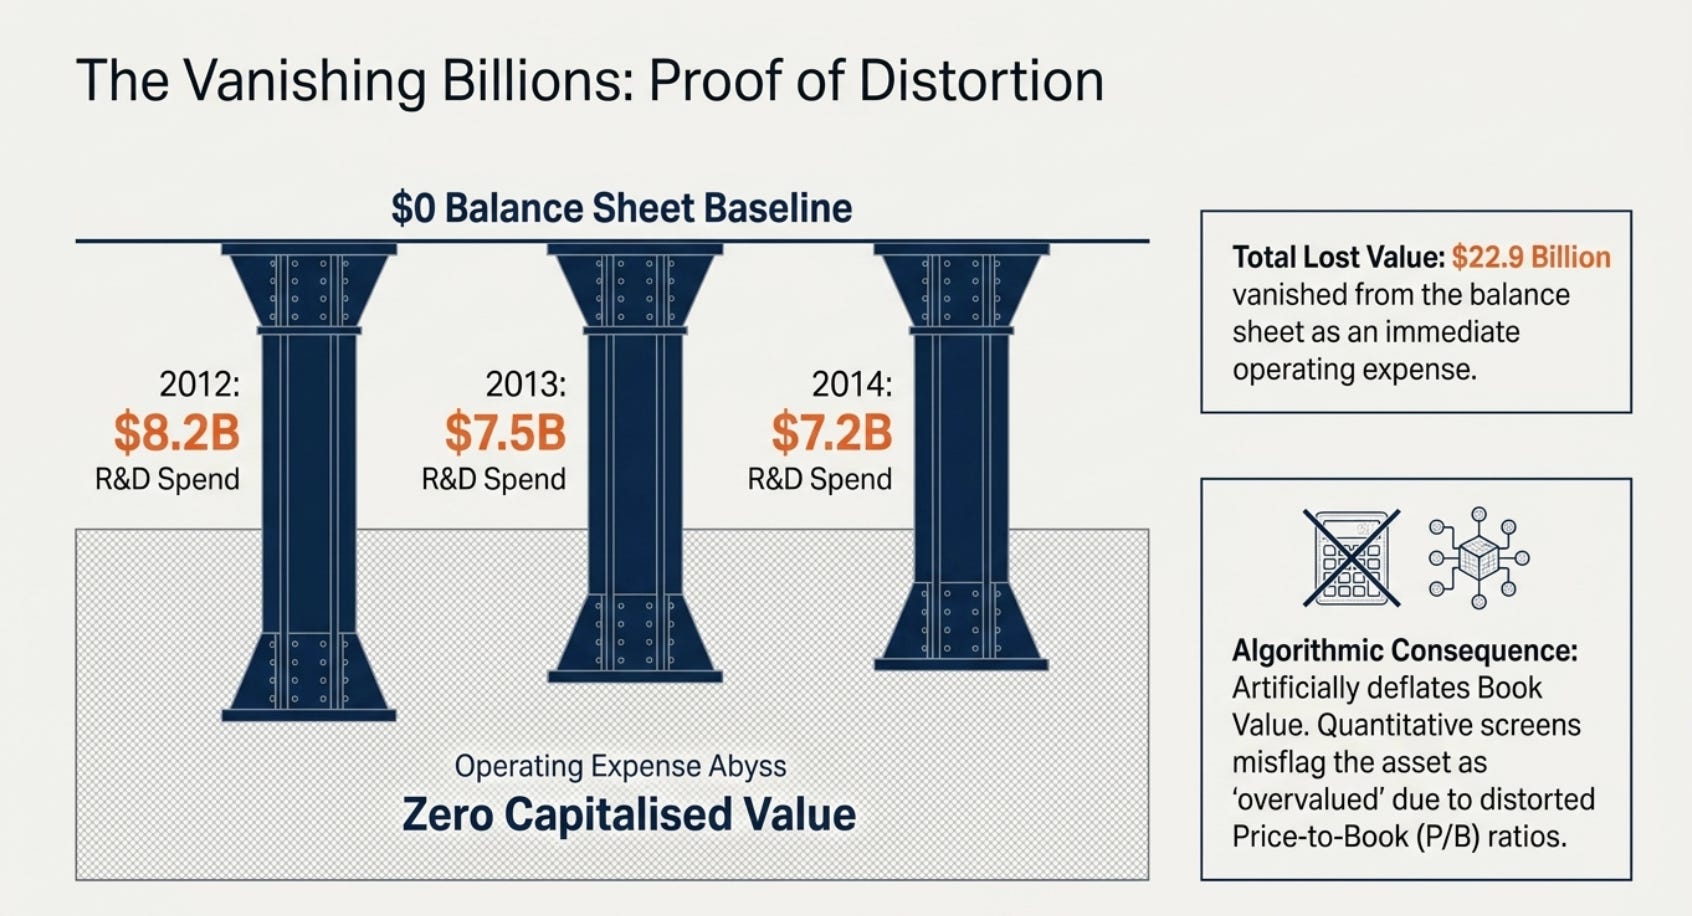
The practical consequence of this rule is dramatic. Consider what Merck’s 10-K filings show: in fiscal years 2012, 2013, and 2014, the company spent $8.2 billion, $7.5 billion, and $7.2 billion respectively on research and development. That is $22.9 billion over three years, vanished from the balance sheet as if it had been burned. The accounting treatment creates a paradox: a company that invests nothing in its future will have a larger book value than one that is furiously building the next generation of medicine.
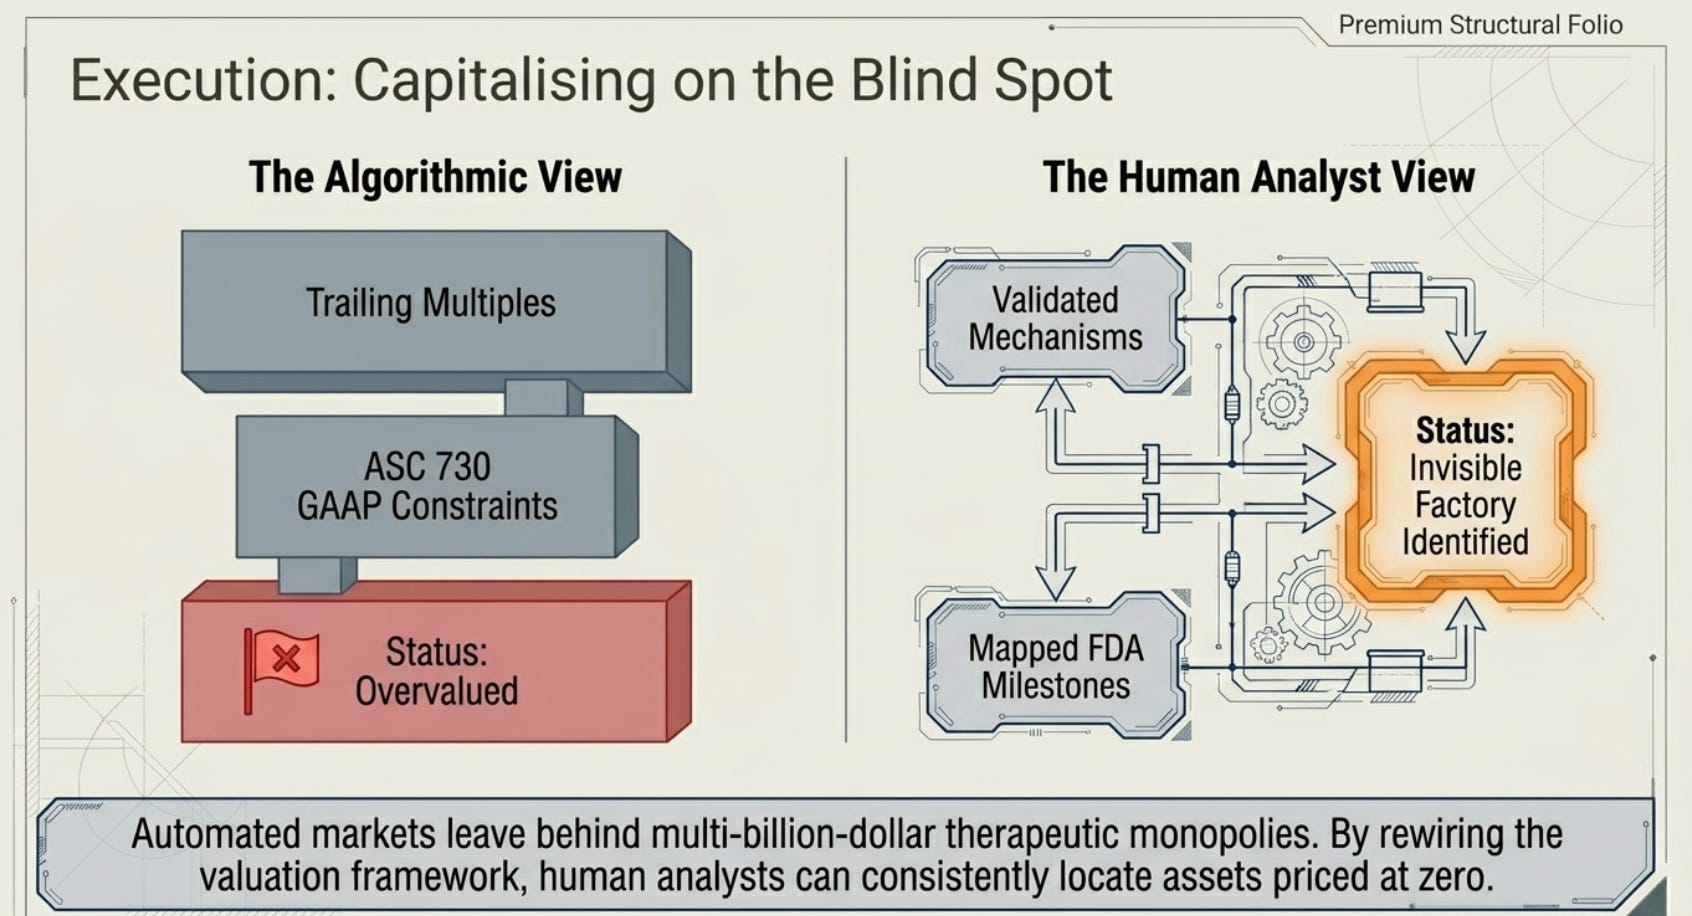
This inversion is important because Wall Street and the financial modeling community have built their entire valuation framework on top of book value, earnings multiples, and cash flow projections. When a drug company’s earnings look suppressed because $7 billion in R&D is flowing through the income statement, the earnings-per-share number is low. When the book value of assets is artificially deflated because twenty years of R&D spending has been expensed rather than capitalised, the price-to-book ratio looks expensive. The financial model therefore concludes: overvalued. Move on.
The business owner standing in the lab thinks something entirely different. They see a drug that took a decade to build, that has cleared the most difficult regulatory hurdles in the world, and that has no close competitors. They are not looking at the earnings-per-share number. They are thinking about what a competitor would have to spend to build the same thing — and whether they even could.
Part Two: The Drug Pipeline as a Manufacturing Asset — A Different Mental Model
Here is a mental model that rewires how you think about a pharmaceutical pipeline.
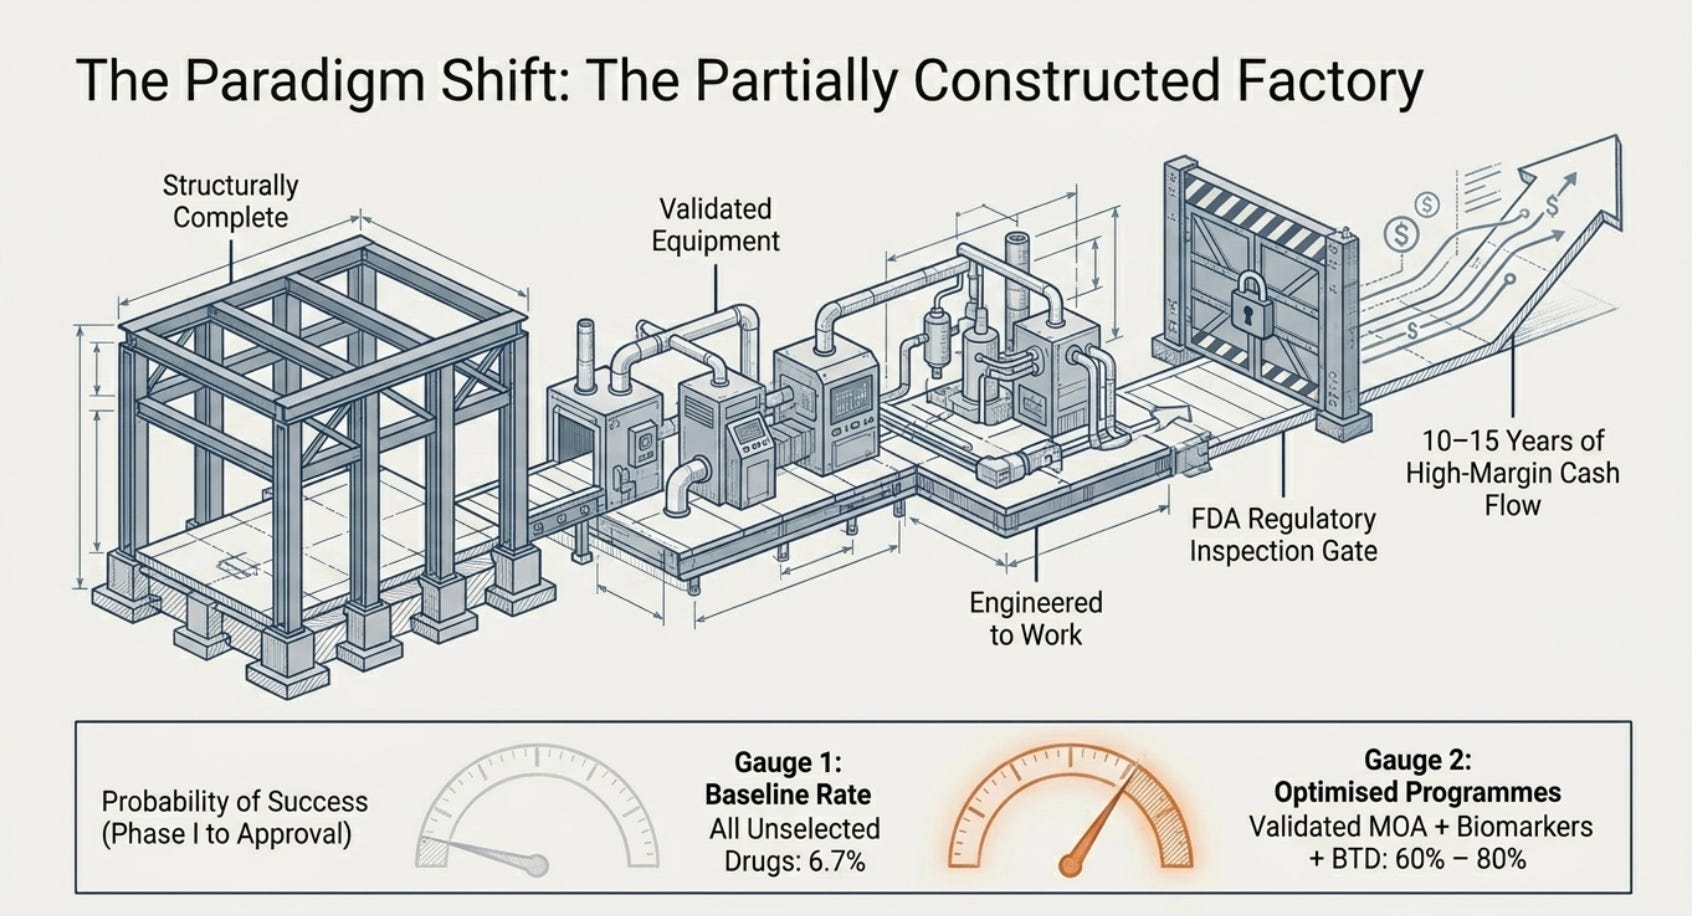
Think of a drug in Phase III clinical trials not as a speculative bet, but as a partially constructed factory — one that, once completed, will generate a stream of high-margin output for the next ten to fifteen years. The factory is not yet producing. It requires final inspections and government certification before it can open. But the equipment has been installed, the process has been validated, and the engineers know it works.
Under GAAP, the cost of building this factory has been expensed. The factory itself sits at zero on the balance sheet. But from the perspective of someone who understands manufacturing economics, what matters is this: what would it cost a competitor to build the same factory? And how long would it take them?
In pharmaceuticals, the answer is typically $800 million to $2.5 billion and ten to fifteen years — if they succeed at all. The Phase I to approval success rate for new drugs, based on Norstella’s analysis of the Citeline dataset covering 2014 to 2023, is 6.7%. That is the rate for the average drug across all disease areas. For drugs that have already cleared Phase II and entered Phase III, the implied probability of approval rises to roughly 55%. For drugs with a validated mechanism of action, a biomarker-selected patient population, strong Phase II endpoint data, and FDA Breakthrough Therapy Designation, the implied probability climbs higher still — into the range of 60 to 80% for best-in-class programs.
A Phase III asset with a 65% implied probability of approval, carried at zero on the balance sheet, is not speculative in any ordinary sense of the word. It is a partially inspected factory that the government is about to certify. The question is not whether you should assign it value. The question is what the right value is — and whether the market has assigned any value at all.
Note: It is important to make an assessment of existing substitutes or solutions in the market (if any). And ask ourselves, what is the price that the drug is selling for? Can the company justify the R&D cost (that is capitalised) based on what the market is already paying? If it is, the capitalised cost would usually be the floor.
Part Three: The Story of the Drug That Wasn’t There — Merck, 2012–2014
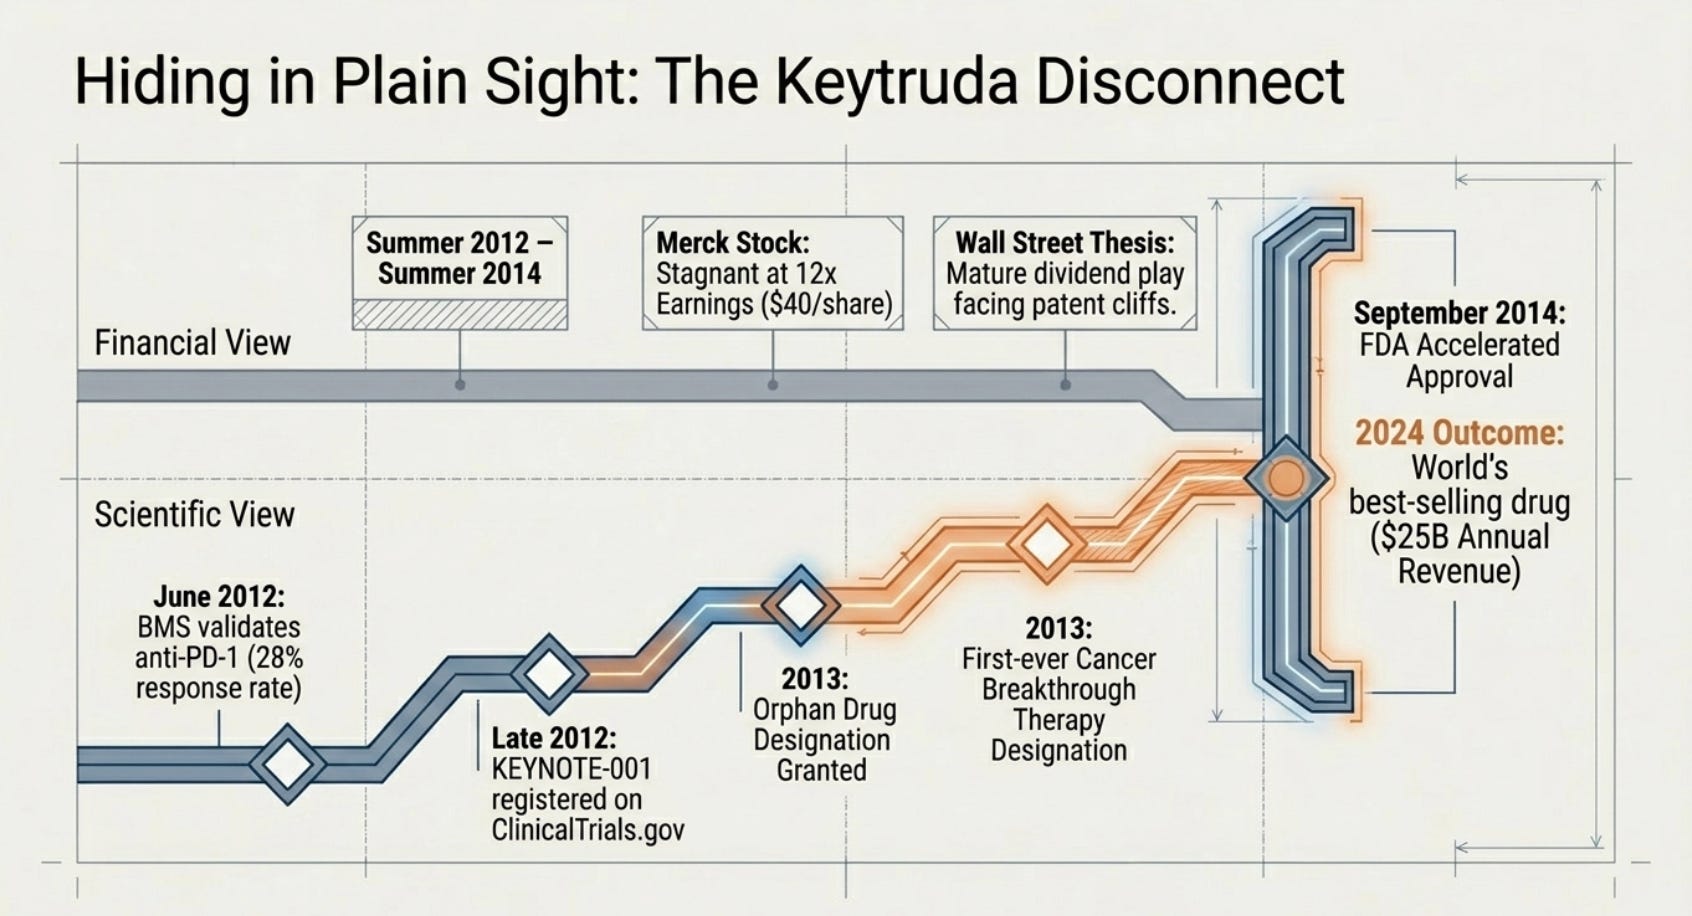
In the summer of 2012, Merck & Co. was a large, moderately valued pharmaceutical company with a stock price trading around $40 to $44 per share — roughly 12 to 14 times trailing twelve-month earnings. The market saw Merck as a mature, dividend-paying pharmaceutical company whose blockbuster drugs (Januvia for diabetes, Singulair for asthma) generated reliable cash flows but faced patent expirations. The narrative was simple: Merck’s best days were behind it. The pipeline was uncertain. The stock was a bond substitute, not a growth asset.
What the financial statements did not show — what they were structurally incapable of showing — was a small clinical program internally designated MK-3475, which would later be named pembrolizumab and eventually marketed as Keytruda.
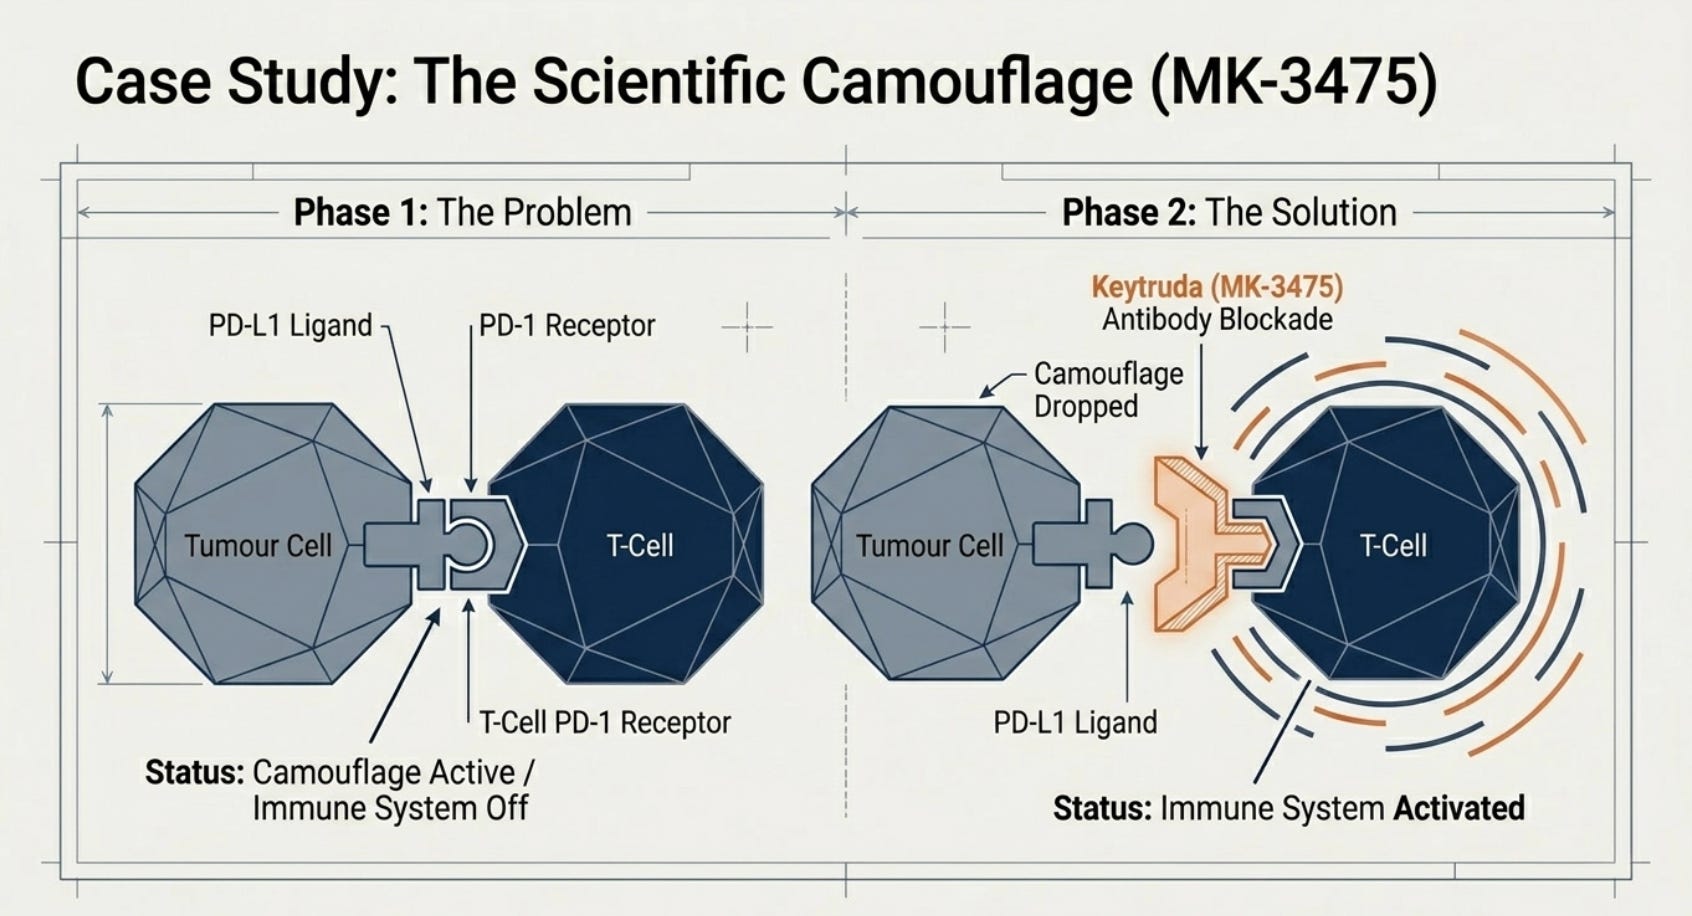
The science behind Keytruda was not a mystery in 2012. The PD-1 pathway — the biological mechanism that Keytruda targets — had been described in peer-reviewed literature for years. PD-1 is a protein on the surface of immune cells that acts as a kind of off switch: when activated, it prevents the immune system from attacking nearby cells. Tumor cells, which are clever adversaries, had learned to exploit this switch by expressing a ligand called PD-L1, which binds to PD-1 on T-cells and essentially tells the immune system: nothing to see here, keep moving. The result is a kind of biological camouflage — the tumor hides from the immune system in plain sight.
The scientific hypothesis was straightforward: if you block the PD-1 receptor with an antibody, you pull away the camouflage. The immune system sees the tumor again and attacks it.
In June 2012, the New England Journal of Medicine published Phase I data on Bristol-Myers Squibb’s anti-PD-1 antibody, nivolumab, showing cumulative response rates of 28% in patients with advanced melanoma — a disease where the five-year survival rate at that time was under 15%. These were patients who had exhausted all other options. The responses, crucially, were durable: many lasted more than a year. The data was published for anyone to read.
Merck had its own anti-PD-1 antibody — pembrolizumab — in a Phase I trial called KEYNOTE-001 (NCT01295827, publicly registered and visible on ClinicalTrials.gov). In late 2012, the FDA granted pembrolizumab orphan drug designation for advanced melanoma. In 2013 — the same year Merck’s 10-K showed $7.5 billion in R&D expenses flowing through the income statement and zero dollars in pipeline value on the balance sheet — the FDA granted pembrolizumab its Breakthrough Therapy Designation for advanced melanoma.
This was the first Breakthrough Therapy Designation ever granted for a cancer drug.
It was all public information. ClinicalTrials.gov listed the trial. The FDA’s public designations database listed the Breakthrough designation. The BMS nivolumab data, validating the entire mechanism of action, was published in one of the most widely read medical journals in the world.
The stock market largely did not react. Merck continued to trade at 12 to 16 times earnings — pricing that reflected only the existing drug portfolio, with essentially no premium for the MK-3475 program. The balance sheet, which showed zero value for the pipeline, told a story the market believed.
On September 4, 2014, the FDA granted accelerated approval to pembrolizumab — now branded Keytruda — making it the first approved anti-PD-1 therapy in the United States. By 2024, Keytruda was generating over $25 billion in annual revenue, representing roughly 40% of Merck’s total sales. It is the best-selling drug in the world.
The asset was always there. It simply was not visible to anyone looking at the balance sheet.
Part Four: Learning to See the Invisible — A Practical Framework
The Merck/Keytruda story is clarifying, but only if you can draw lessons from it that are operational — things you can actually do the next time you are looking at a pharmaceutical company. Here is a structured approach to what a business owner, rather than a financial analyst, would examine.
The First Question: What Has the Company Already Spent, and Where Did It Go?
The starting point is the R&D expense line in the income statement, cross-referenced with the pipeline disclosure in the 10-K annual report. Every major pharmaceutical company publishes a pipeline table — typically in the “Business” section of its annual filing — listing each drug candidate, its therapeutic area, and its current clinical phase. This table contains the actual assets of the business. The income statement contains only the cost of building them.
A company that has spent $3 billion cumulatively on R&D over the past five years, whose balance sheet shows zero in internally developed drug assets, and whose pipeline table lists three Phase III programs and five Phase II programs is not what the income statement makes it look like. The $3 billion was not destroyed. It was converted into those eight clinical programs — assets that GAAP refuses to recognize.
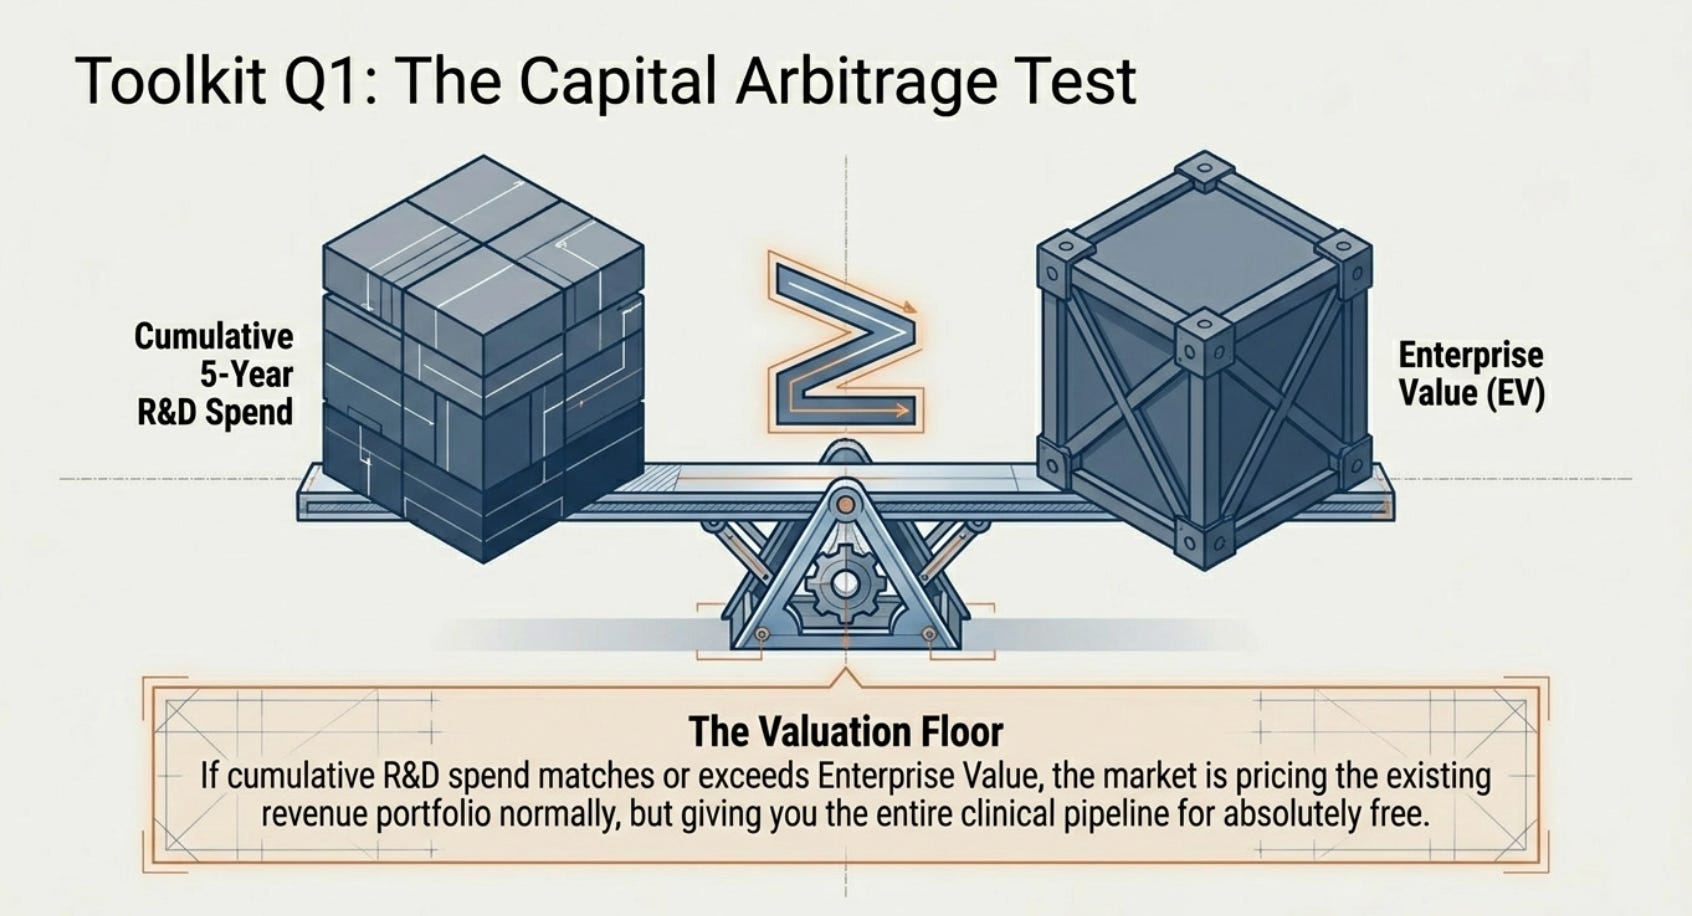
Compare the cumulative R&D expense over five to seven years (found by summing the R&D line from successive 10-Ks) to the current enterprise value of the company. If the cumulative spend is comparable to or exceeds the current enterprise value, you are potentially buying those pipeline assets for free. The existing commercial products — the ones already generating revenue — are being priced as if they are all that exists.
The catch: Only if those product gets commercialised — Which brings us to the next question below.
The Second Question: Does the Mechanism of Action Actually Work?
This is where most non-specialist investors stop, and where the real work begins.
A drug’s mechanism of action (MOA) is the biological pathway through which it produces its effect. Understanding whether an MOA is validated is not about whether the drug works in theory — it is about whether the FDA and the scientific community have already confirmed that drugs operating on the same pathway can produce clinical benefit in humans.
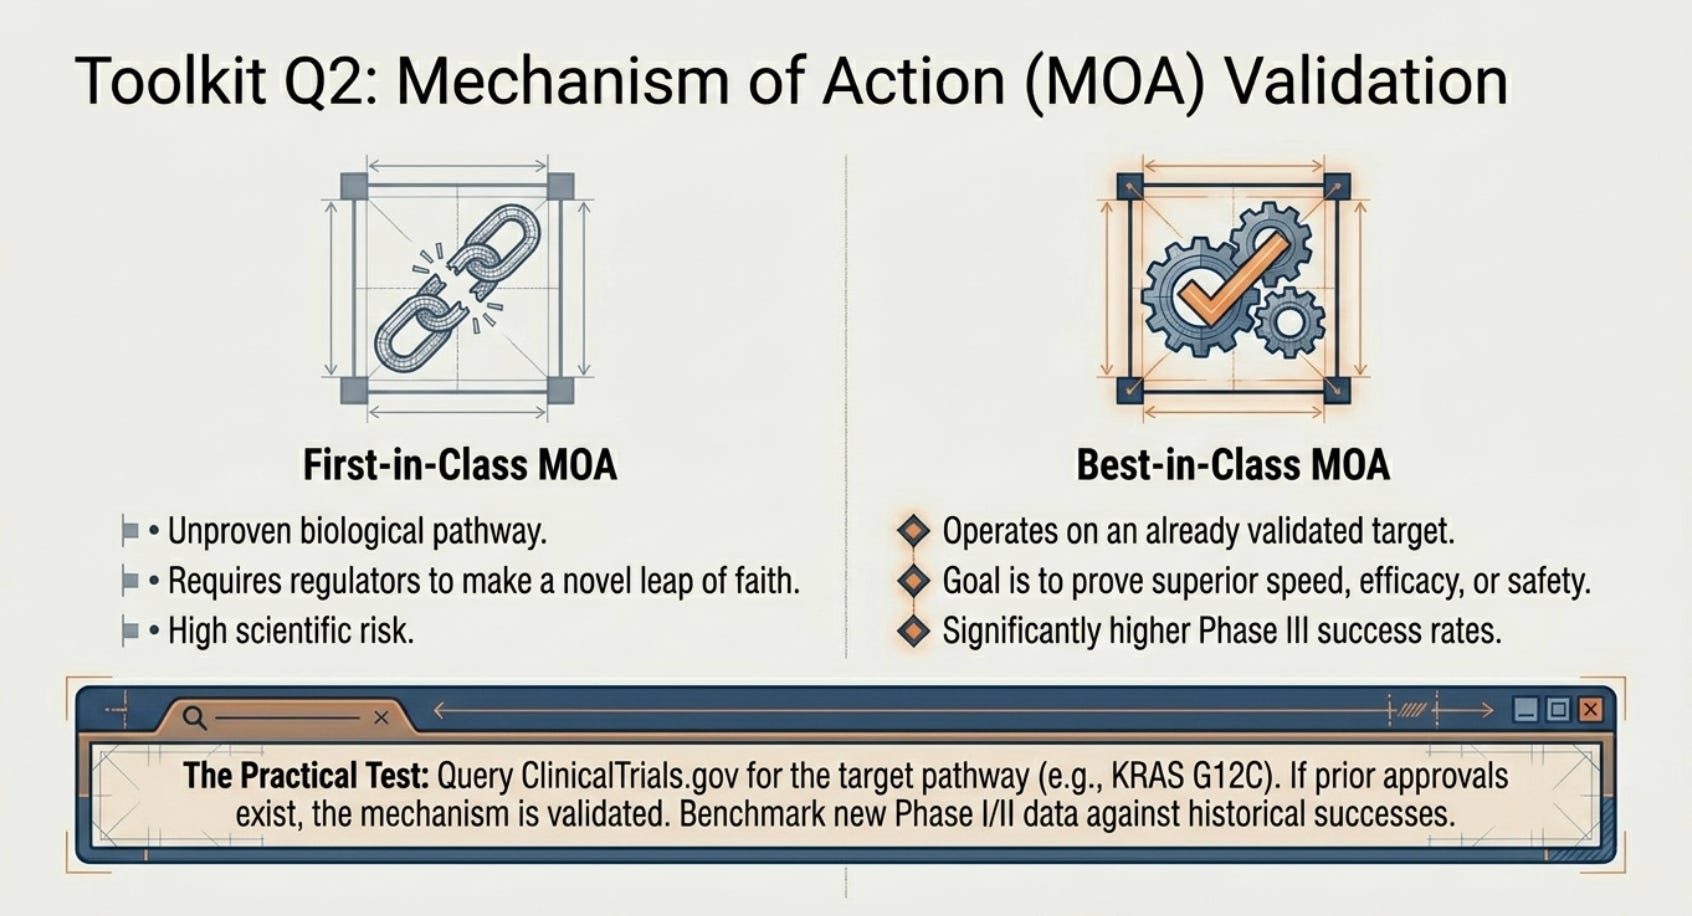
Here is the distinction that matters. A drug with a first-in-class MOA is asking the FDA and the scientific community to take a genuinely novel leap of faith: we believe this pathway is relevant to disease X, we believe blocking/activating it will produce benefit, and here is our preliminary evidence. Even with strong data, this involves the highest level of regulatory and scientific uncertainty.
A drug with a best-in-class MOA operating on an already-validated target is asking something much simpler: the pathway is proven to matter. Other drugs working on the same target have already been approved. Our drug works on the same mechanism, and our data suggests we do it better, faster, or with fewer side effects. The FDA is not being asked to validate the mechanism — only to confirm the drug’s clinical performance.
This distinction has a measurable impact on success rates. A 2021 analysis published in Drug Discovery Today found that follow-on drugs targeting validated mechanisms had meaningfully higher Phase III success rates than first-in-class compounds, because the fundamental scientific hypothesis — that the target matters in the disease — had already been independently confirmed.
The practical question to ask is: Has any drug operating on the same target or pathway already received FDA approval? If yes, for what disease? And does the company’s drug share enough of that mechanism that approval in the same disease, or an adjacent disease, is scientifically plausible?
In the case of pembrolizumab in 2013, this question had a clean answer. The anti-PD-1 mechanism was validated by BMS’s nivolumab data, published in 2012. The pathway — blocking PD-1 to restore immune recognition of tumors — was proven to produce durable responses in melanoma patients. Merck’s drug worked on the identical mechanism. The question was not whether anti-PD-1 works. The question was whether pembrolizumab was a good enough version of the mechanism to achieve regulatory approval.
How to do this in practice: Search ClinicalTrials.gov for the drug’s target (e.g., “PD-1 inhibitor,” “KRAS G12C,” “BTK inhibitor,” “JAK1/2”) and filter by status “Approved” or “Completed.” Look for drugs in the same or similar disease area with positive results. If prior approvals exist, the mechanism is validated. Then look at the published Phase I and Phase II data for the company’s specific drug and ask: does the response rate, the durability of response, and the safety profile compare favorably to the drug that was already approved?
The Third Question: What Does the Clinical Data Actually Say?
Every clinical trial registered with the FDA is publicly listed on ClinicalTrials.gov. Every company is required to post results there within a specified time after trial completion. Published Phase I and Phase II data are almost always available in peer-reviewed journals — the New England Journal of Medicine, the Journal of Clinical Oncology, The Lancet Oncology, and Nature Medicine publish the major oncology trial results.
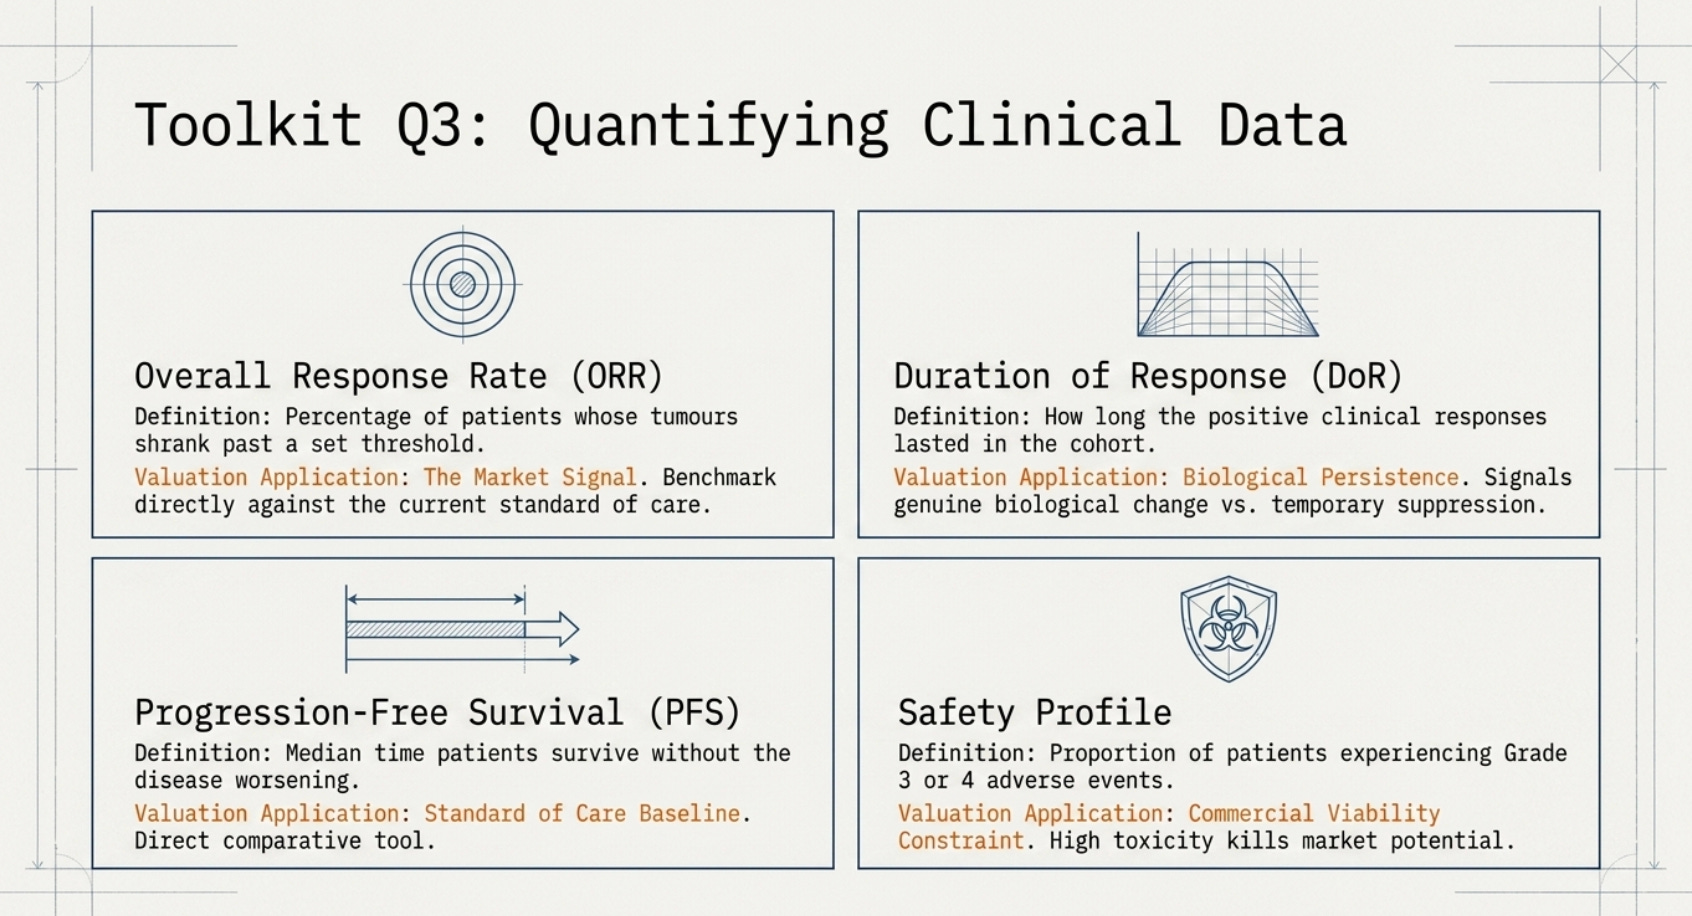
For a non-specialist reading this data, the key numbers to look for are:
Overall Response Rate (ORR): The percentage of patients whose tumors shrank or disappeared by a predefined threshold. A 30% ORR in a tumor type where the standard of care produces 12% is a meaningful signal. A 7% ORR in the same context is not.
Duration of Response: How long the responses lasted. A drug that produces a 40% response rate but all responses disappear within three months is different from one where responses last two years. Durability signals that the drug is producing genuine biological change, not just temporary tumor suppression.
Progression-Free Survival (PFS): The median time patients go without their disease getting worse. Compare this to published benchmarks for the current standard of care in the same tumor type.
Safety Profile: What proportion of patients experienced grade 3 or 4 adverse events (serious or life-threatening side effects). A drug with a 60% ORR but 40% grade 3/4 adverse events is a different risk profile than one with 60% ORR and 8% grade 3/4 events.
These numbers are not hidden. They are published, peer-reviewed, and discussed at public oncology conferences (ASCO, ESMO, ASH) every year. The conference abstracts are freely accessible online. The question is simply whether anyone looking at the company’s stock price is reading them.
The Fourth Question: What is the delivery mechanism?
A drug can be a scientific miracle in a test tube, but if the “user interface”—how the patient actually receives the medicine—is a logistical nightmare, its commercial value will be severely capped. In the pharmaceutical world, the delivery mechanism is the bridge between clinical efficacy and market share.
When evaluating a company’s pipeline, you must distinguish between the payload (the active chemical or biological agent) and the vehicle (how it enters the body). The market’s “acceptance” of a drug is often a direct function of how much it disrupts a patient’s daily life.
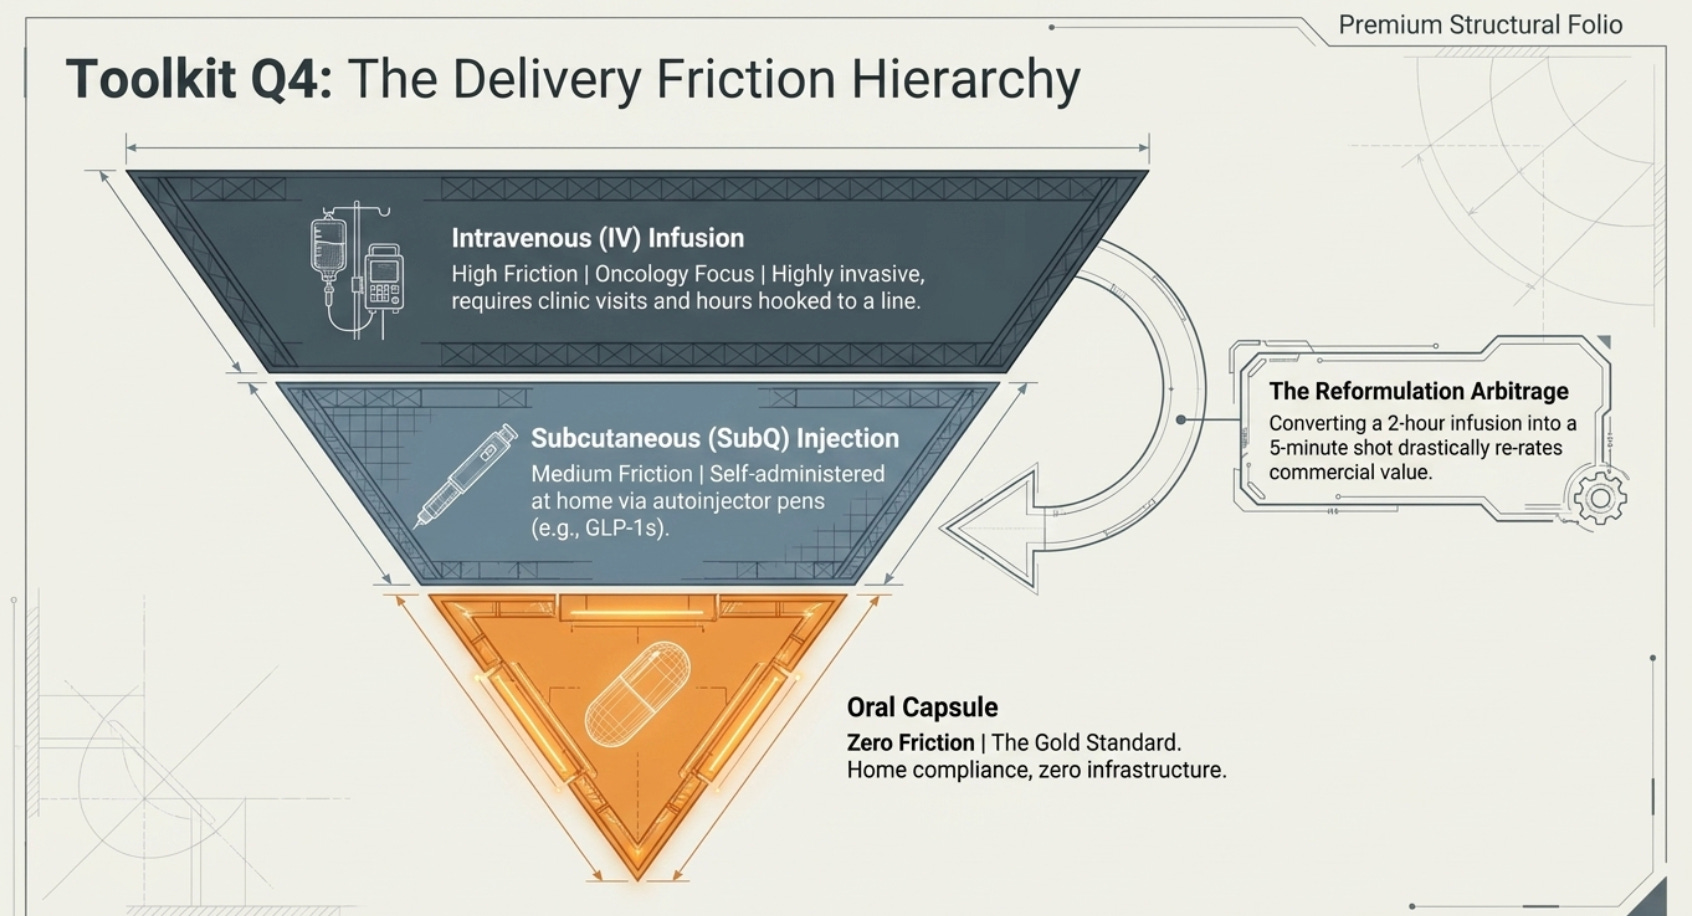
Generally, the market values delivery mechanisms in a specific order of “friction”:
Oral (The Gold Standard): A pill or capsule that can be taken at home. This offers the highest patient adherence and the lowest cost to the healthcare system. It requires no specialized equipment or medical supervision.
Subcutaneous (SubQ) Injection: A “shot” typically administered into the fatty tissue. Many modern drugs (like the GLP-1 weight-loss medications or insulin) use “autoinjector pens” that allow patients to treat themselves at home.
Intravenous (IV) Infusion: The most invasive. This requires a patient to travel to a clinic, sit in a chair for thirty minutes to several hours, and have a healthcare professional administer the drug via a vein.
A common value-creation strategy for savvy pharma companies is reformulation. For example, a company might have an oncology drug that is currently delivered via a grueling two-hour IV infusion. If that company successfully develops a Subcutaneous version of the same drug that can be administered in five minutes, they have just created a massive market.
Patients and doctors will almost always choose the five-minute version over the two-hour version, even if the clinical results are identical. This is exactly what Halozyme Therapeutics does; they partner with big pharma to turn IV drugs into SubQ injections, capturing huge royalties in the process.
As a business owner, you must ask: Does the delivery mechanism match the disease?
If you are treating a life-threatening, late-stage cancer, a patient will tolerate a four-hour IV infusion.
If you are treating a chronic, manageable condition like high blood pressure or mild asthma, an IV requirement is a commercial death sentence. No one is going to an infusion center once a month for a condition they could treat with a daily pill.
How to do this in practice: Look at the “Method of Administration” in the clinical trial description. Then, look at the competitors. If the “Standard of Care” is a pill and the new company’s drug is an injection, the new drug’s clinical data doesn’t just have to be as good as the pill—it has to be exponentially better to convince doctors and insurance companies to switch to a more invasive, expensive delivery method.
The Fifth Question: What Has the FDA Formally Said?
This is where many investors are most confused, because the FDA designation system is a series of overlapping signals that mean different things at different stages of development. Let us go through each one carefully, as a business owner evaluating how close a factory is to receiving its government operating license.
Part Five: A Complete Guide to FDA Designations — What the Government Is Telling You
Think of the FDA not as a black box that either says yes or no at the end of a decade of waiting, but as an ongoing scientific dialogue between the regulator and the drug company. The FDA issues formal designations at different points in that dialogue. Each designation is a signal about what the FDA has seen and what it is willing to do in response.
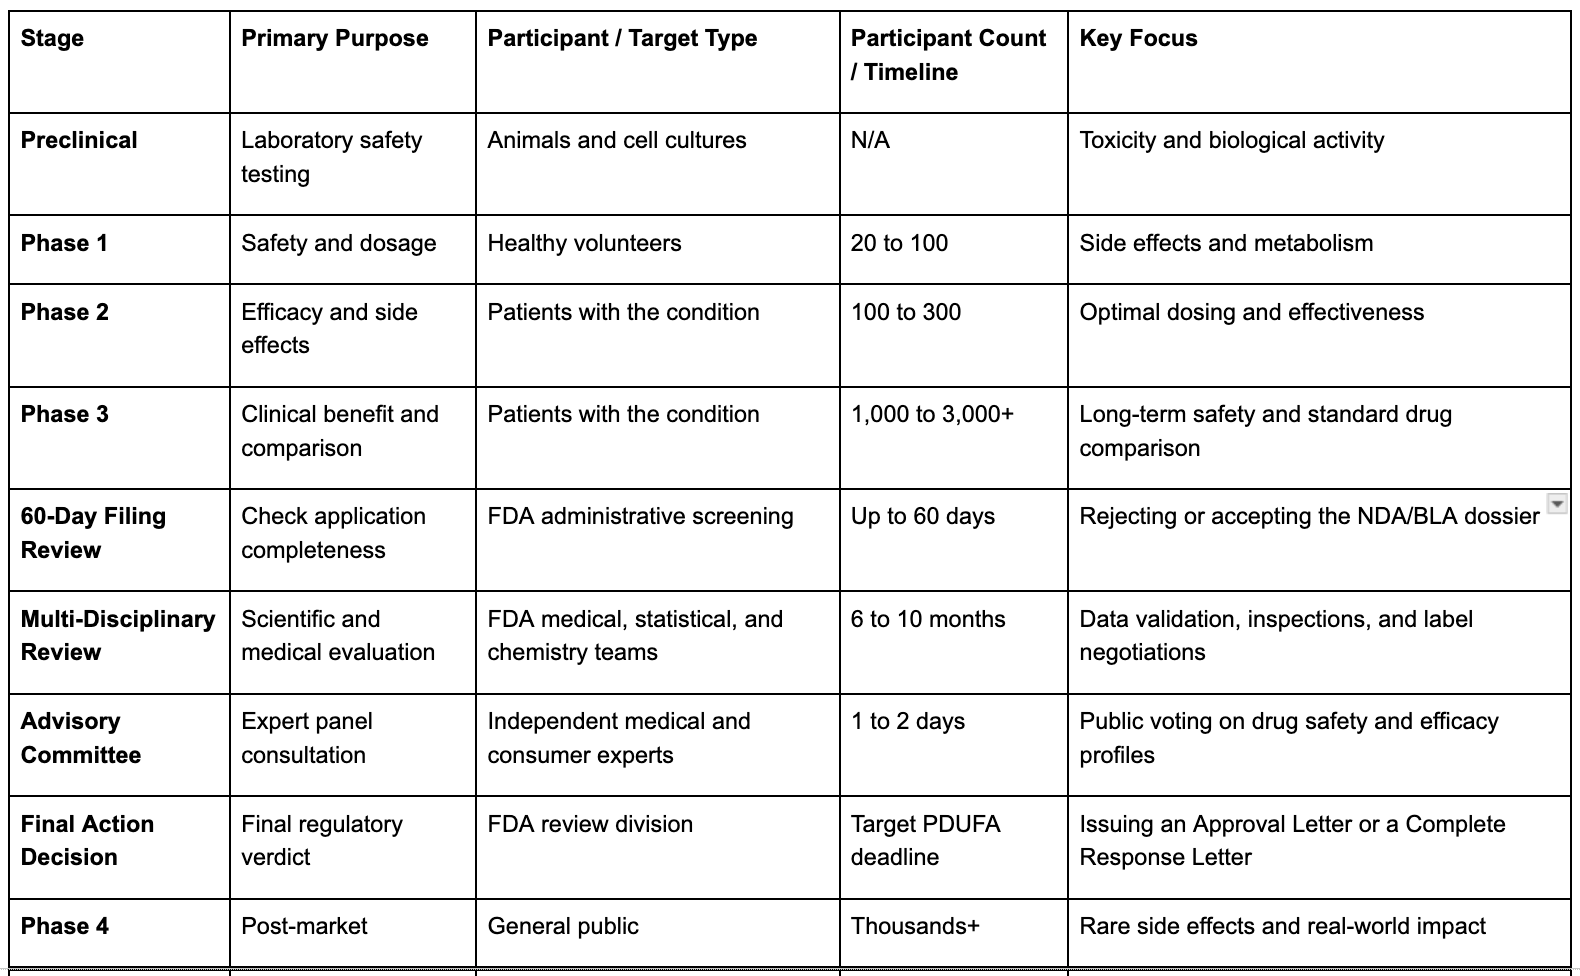
The Phases in Summary
Fast Track Designation
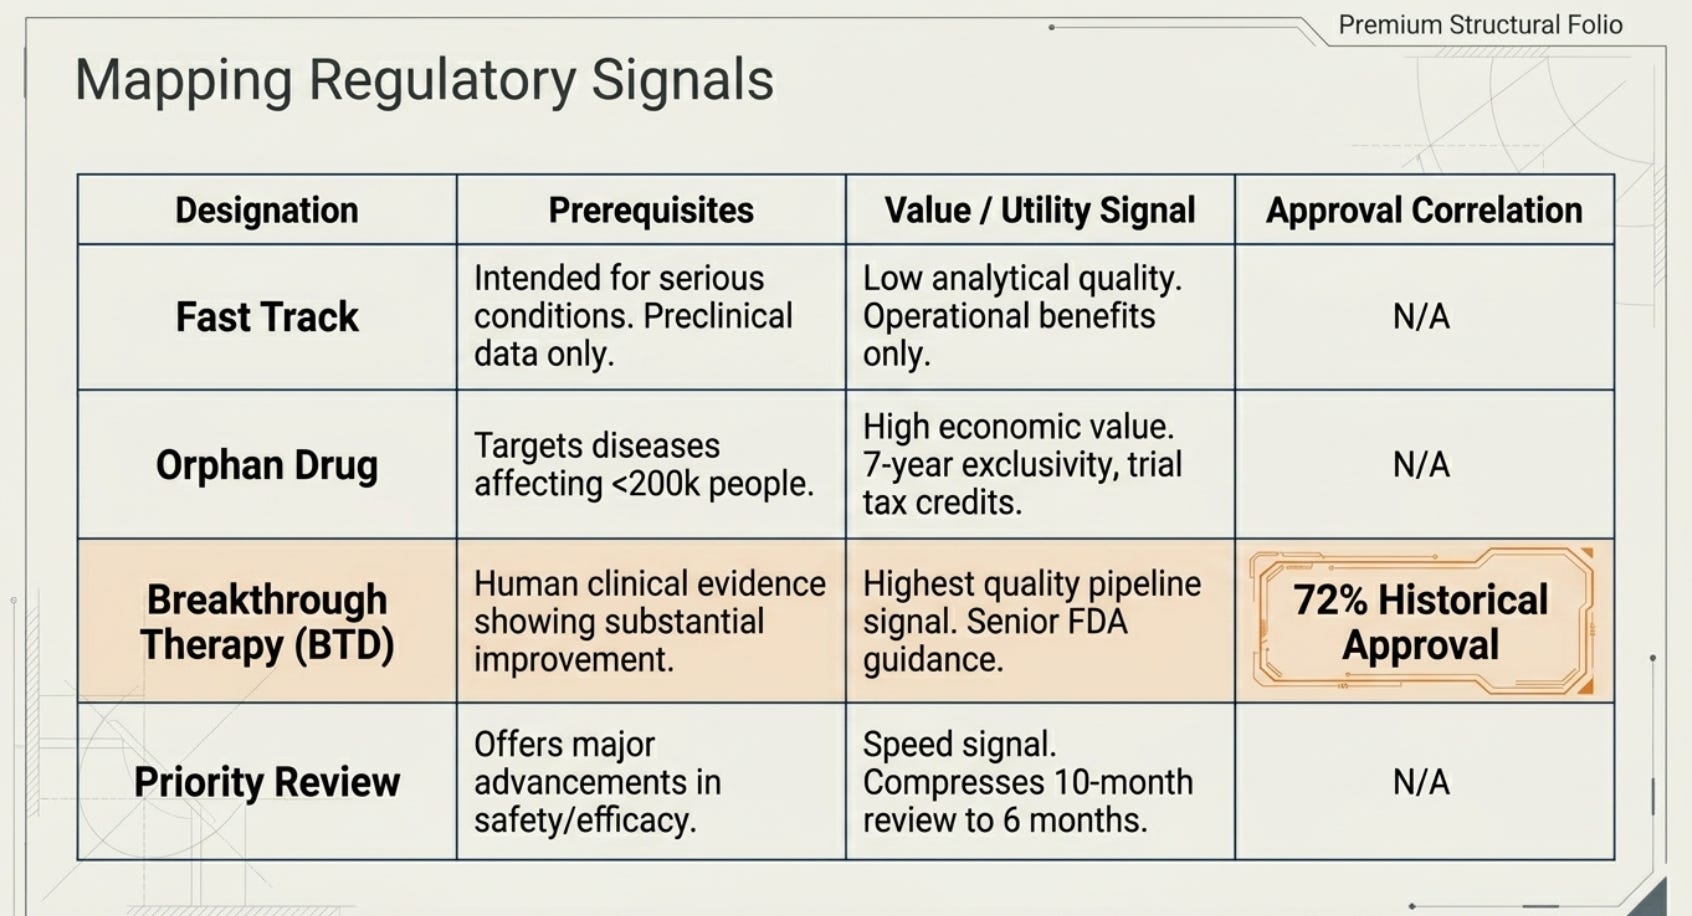
Fast Track is the most commonly granted designation — and the least informative as a signal of quality. The FDA grants Fast Track to drugs intended to treat serious conditions where there is an unmet medical need, essentially meaning the existing treatments are inadequate. Fast Track does not require any clinical data from human trials. A company can apply for Fast Track based on preclinical (animal or cell culture) evidence and a reasonable scientific hypothesis.
What Fast Track does provide is practical: more frequent meetings with FDA staff, the ability to submit sections of the NDA (new drug application) on a rolling basis (rather than all at once), and eligibility for Priority Review if the drug shows significant improvement in later trials.
NDA is usually submitted after Phase 3
Fast Track is not a signal that the drug works in humans. It is a signal that the FDA is willing to talk to you more frequently because the target disease is serious and the current treatments are inadequate.
What to do with Fast Track: It tells you the FDA is interested in the disease area and that preliminary science is plausible. By itself, it is a necessary but not sufficient condition for the kind of pipeline value assessment we are discussing. Most pipeline drugs eventually get Fast Track. What matters is what comes next.
Orphan Drug Designation
Orphan Drug Designation is granted to drugs targeting diseases affecting fewer than 200,000 people in the United States. It comes with significant economic incentives: seven years of market exclusivity upon approval (even if patent protection would otherwise be shorter), 50% tax credits on qualified clinical trial costs, and waived FDA filing fees.
For investors, Orphan designation carries two distinct signals. First, it confirms that the FDA has reviewed the scientific rationale for using the drug in the specific disease and accepted that there is a plausible pathway to therapeutic benefit. Second — and more commercially important — it signals that if approved, the company will face a seven-year window without generic competition regardless of patent life.
In the Keytruda story, Merck received Orphan Drug Designation for pembrolizumab in advanced melanoma in late 2012. This was a factual, public signal that the FDA had reviewed the preliminary science and found it credible enough to grant a formal designation. It was publicly listed in the FDA’s Orphan Drug Products database. It was one piece of the visible evidence that the drug had scientific and regulatory traction — visible to anyone who chose to look.
Breakthrough Therapy Designation (BTD)
This is the most important designation for the kind of pipeline valuation assessment we are building. It is the FDA’s formal statement that a drug has shown preliminary clinical evidence — meaning actual data from human patients — of substantial improvement over existing therapies on a clinically meaningful endpoint.
To receive BTD, a company must submit Phase I or Phase II human data showing that the drug is meaningfully better than the standard of care in a disease with serious morbidity or mortality. The FDA evaluates that data and makes a judgment. The bar is real: as of mid-2024, the FDA had received 1,516 requests for BTD and granted 587 — a 38.7% grant rate. The FDA is turning down roughly 60% of requests.
What BTD provides in practice: intensive guidance from senior FDA staff, the ability to use the FDA’s rolling review process, and priority review of the final application. The clinical guidance is particularly valuable — companies with BTD essentially get ongoing scientific feedback from the FDA about what data will be sufficient for approval, reducing the risk of producing a beautiful trial that fails on a technicality.
The approval statistics for BTD drugs are striking. A Jefferies analysis of 599 Breakthrough Therapy Designations granted between 2013 and 2022 found that 72% of designated drugs ultimately received FDA approval, with an additional 13% still in development at the time of the analysis. Compare this to the baseline Phase I-to-approval rate of 6.7%. A drug with BTD is not just a drug — it is a drug that the FDA has already looked at in human patients and said, formally: this appears to be substantially better than what we have.
That statement carries enormous weight and no corresponding weight on the balance sheet.
How to use BTD in your assessment: Treat BTD as a meaningful upward revision to the implied probability of approval, but not a guarantee. A drug with BTD in a validated MOA, positive Phase II data, and a biomarker-selected patient population is operating with a very different risk profile from the average pipeline drug. The relevant base rate is not the 6.7% overall Phase I-to-approval number. The relevant base rate is closer to the 72% eventual approval rate for BTD drugs — with the important caveat that some of those drugs had many years of additional trials left when the designation was granted.
Keytruda received BTD in 2013, before its Phase III confirmatory trials. The designation was the first BTD ever granted for a cancer drug. It was announced in a press release, listed on the FDA’s website, and discussed in Merck’s annual reports. It was visible.
Priority Review
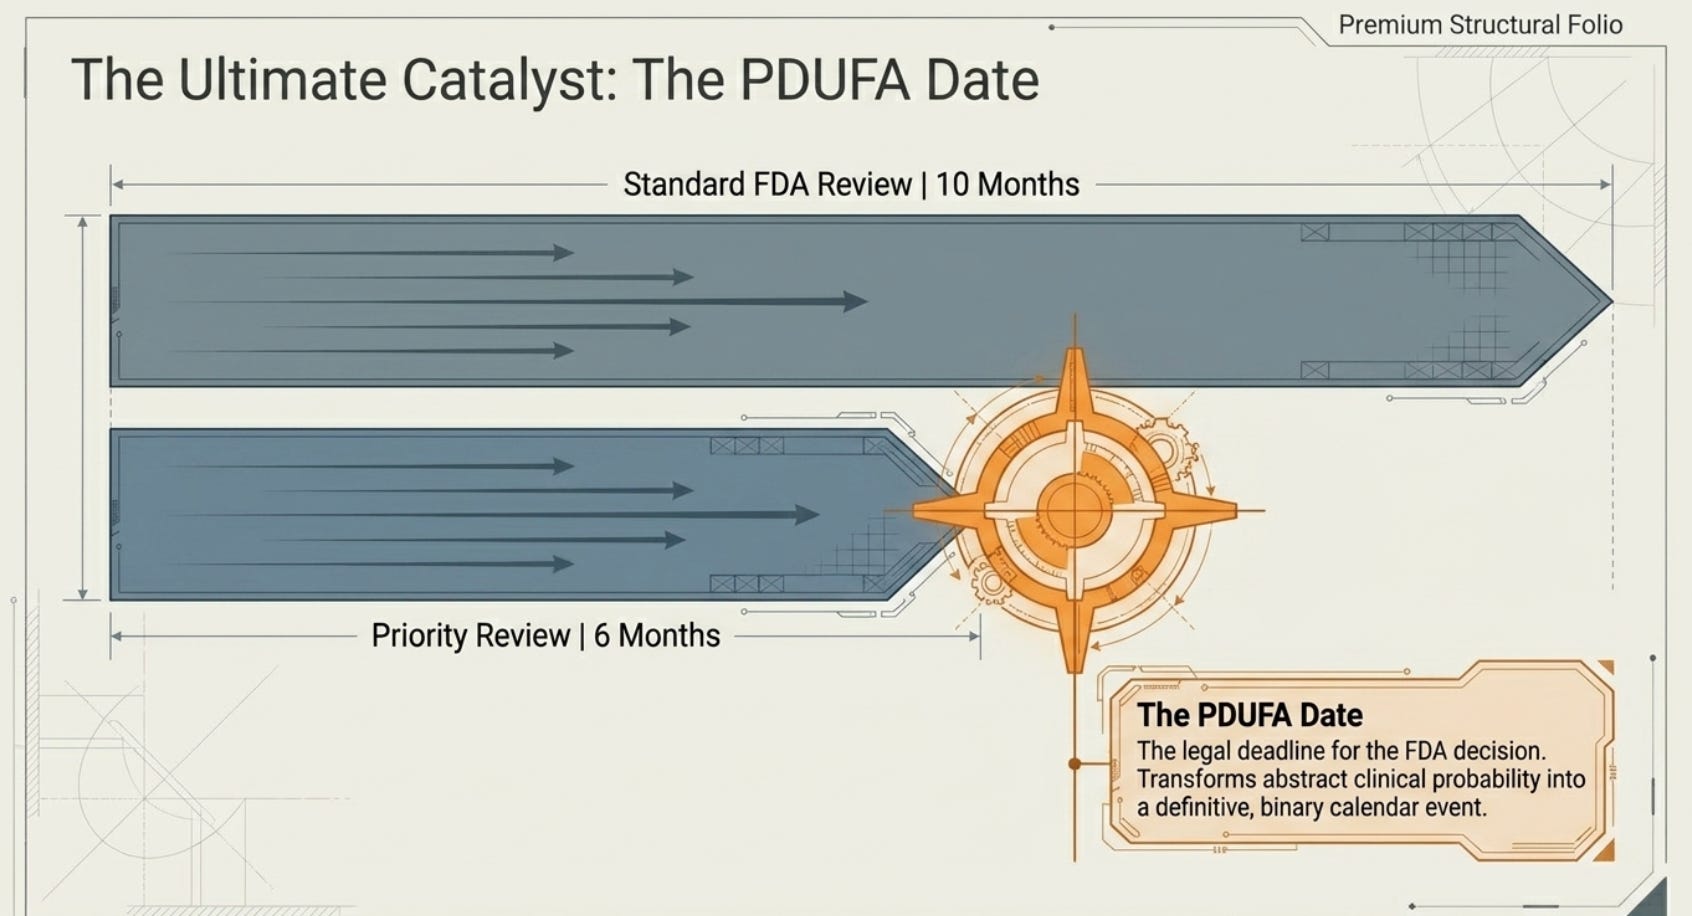
Priority Review is granted at the time a company submits its New Drug Application or Biologics License Application (BLA) to the FDA — the formal application for market approval. It shortens the FDA’s review period from the standard ten months to six months, for drugs that offer significant improvements in safety or effectiveness over available therapy.
Priority Review does not reflect judgment about whether the drug will be approved — it reflects a judgment about whether the FDA should move faster given the potential benefit. It is granted after Phase III trials are complete and the full data package is in hand.
For investors, Priority Review is important as a confirmation signal. It tells you the FDA reviewed the Phase III package and immediately classified the drug as offering meaningful improvement. Combined with BTD and strong clinical data, Priority Review is one of the last checkpoints before approval. A drug in Priority Review with 4-6 months until a decision date (the PDUFA date) is extremely close to either becoming a commercial product or confirming it has failed.
The PDUFA Date: The Confirmed Catalyst
The Prescription Drug User Fee Act (PDUFA) date is the FDA’s committed deadline to complete its review of a drug application. It is public, it is specific, and it is almost always met. When a company submits its NDA or BLA, the FDA sets a PDUFA date — typically ten months out for standard review, six months for Priority Review — and publishes it in its calendar.
The PDUFA date is the closest thing to a confirmed, dated catalyst that exists in pharmaceutical investing. It is not a guarantee of approval. But it is the date on which the FDA has committed to making a decision, and for drugs with strong clinical data, validated mechanisms, and favorable designations, it converts an abstract probability into a specific binary event on a specific date.
Unlike “we think this will generate revenue in three years,” the PDUFA date is published fact. The FDA’s public calendar lists upcoming PDUFA dates for drugs under review. This is the anchor point for assessing when the invisible factory opens — or confirms that it will not.
Part Six: Biomarkers — The Single Most Important Variable in Clinical Success Rates
Of all the factors that determine whether a drug will succeed in Phase III trials, none has had more impact on outcomes in the past decade than the use of biomarkers for patient selection.
A biomarker, in this context, is a measurable biological characteristic — a gene mutation, a protein expression level, a chromosomal rearrangement — that identifies patients whose tumors are likely to respond to a specific drug. Rather than testing a drug in everyone with, say, breast cancer, a biomarker-selected trial tests the drug only in patients whose tumors carry the specific feature the drug is designed to target.
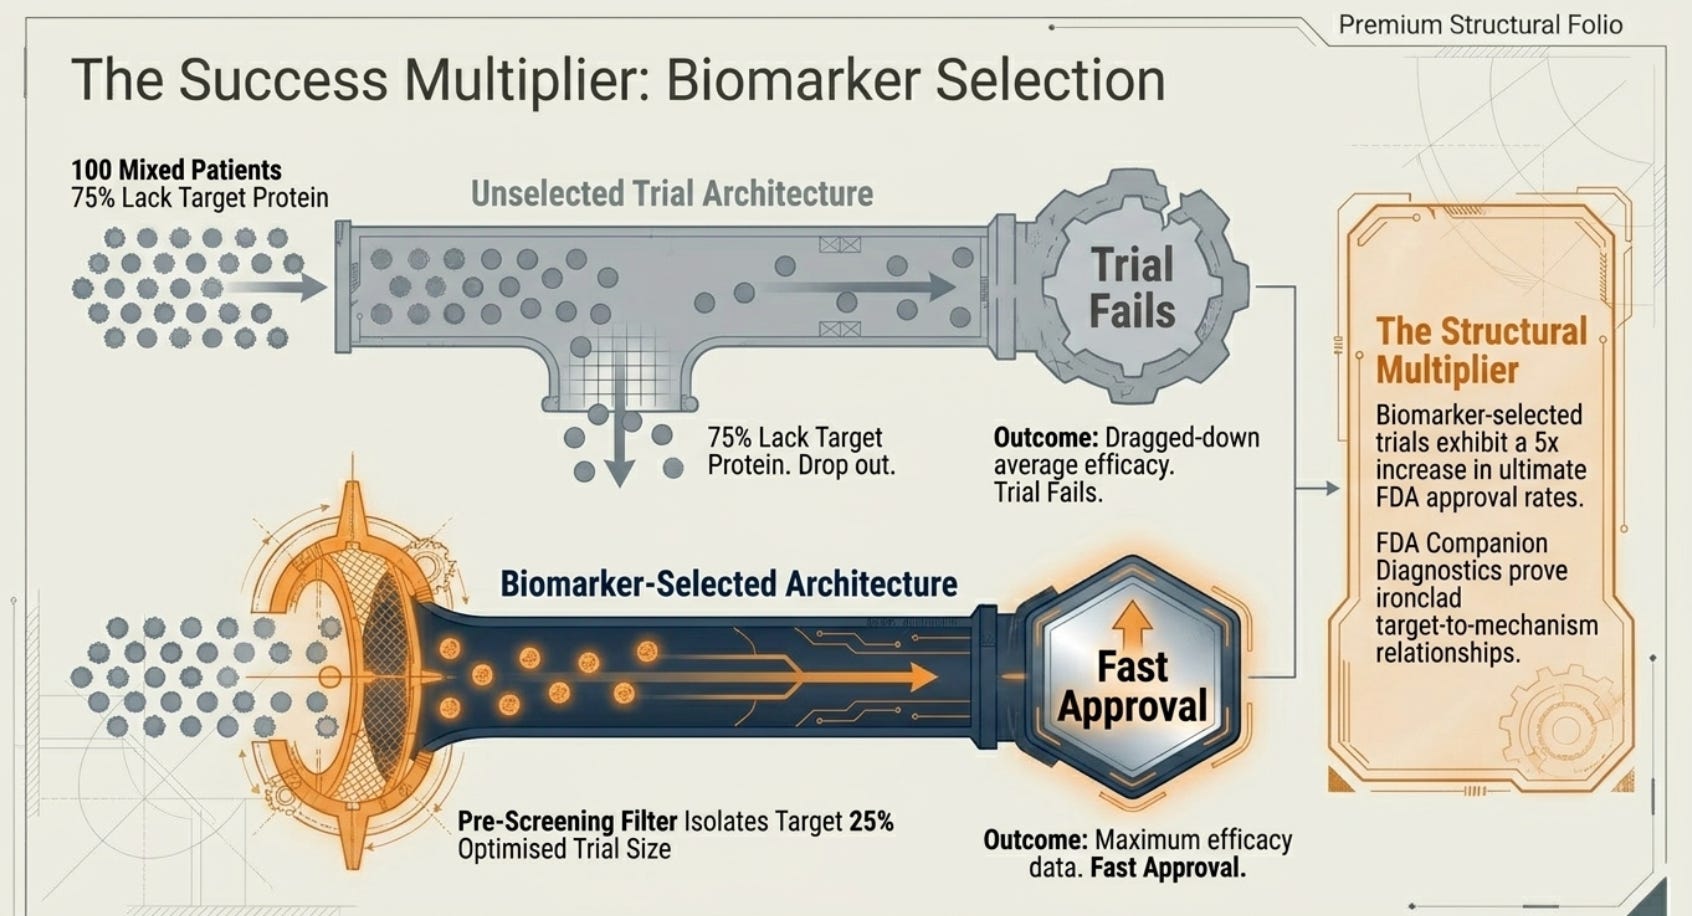
The impact on success rates is not marginal. It is transformative. A 2016 analysis of over 10,000 clinical trials drawn from ClinicalTrials.gov, published in the Journal of Health Economics, found that trials using biomarkers for patient selection had nearly fivefold higher likelihood of drug approval compared to trials without biomarker selection. A 2015 study published in Biostatistics analyzing 406,038 clinical trial entries confirmed that “trials using biomarkers in patient-selection have higher overall success probabilities than trials without biomarkers.” And a targeted example from the HER2 mutation in breast cancer showed response rates improving from 12% in unselected patients to 32% in biomarker-selected patients — a nearly threefold improvement.
The intuition behind this is straightforward. If a drug works by blocking a specific protein that only 25% of tumors produce, then testing it in an unselected population means 75% of patients in the trial will have no chance of responding. The drug will look like it does not work — because in that population, it mostly does not. A biomarker test identifies the 25% who have that protein and tests the drug only in them. The response rates are dramatically higher, the statistical signal is cleaner, and the trial is smaller and faster.
What to look for in a Phase II or Phase III program:
First, look at the trial design on ClinicalTrials.gov. Is the trial requiring a biomarker test as an eligibility criterion? If yes, which biomarker? Is that biomarker scientifically connected to the drug’s mechanism of action, or is it coincidental? A drug targeting KRAS G12C mutations that requires a KRAS G12C test for enrollment is doing this correctly. A drug with a diffuse mechanism of action using a loosely correlated biomarker is doing this for appearances.
Second, look at whether the company has developed or partnered on a companion diagnostic — an FDA-approved test that identifies patients who should receive the drug. Companion diagnostics are required by the FDA for drugs where the biomarker is essential for identifying the appropriate patient population. If a company has already submitted or received approval for a companion diagnostic, the biomarker relationship is so strong that the FDA has required it as a label condition. That is a high signal of scientific rigor.
Third, compare the Phase II response rates to the historical rates in that tumor type for both biomarker-selected and unselected trials. A response rate that looks impressive in absolute terms may be unremarkable if other drugs targeting the same biomarker have already achieved similar results. But a response rate that is meaningfully superior to the best available biomarker-selected therapy, in a patient population where the biomarker prevalence is high, is a signal worth taking seriously.
Part Seven: The Screening Arbitrage — When the Market Forgets the Factory Exists
All of the above analysis is only useful if the market is pricing the company in a way that assigns limited or no value to the pipeline. There is no point to purchase a company that is selling for a premium, or more than the value of which you expect it to give.
An example of a good indicator that the market has forgotten the invisible factory is a Price-to-Sales ratio below 2.0. At that multiple, the market is essentially saying: this company’s future revenue is worth less than twice its current annual sales. For a pharmaceutical company with a productive pipeline, that pricing implies that the pipeline will produce either nothing or something close to it. However, for a pure R&D company, this has no relation.
Let us make this concrete. A drug company with $3 billion in annual revenue from existing commercial products, trading at 1.8 times sales, has an enterprise value of approximately $5.4 billion. Its 10-K lists two Phase III programs and three Phase II programs. Its cumulative R&D expense over the past six years is $4.2 billion — all expensed, all invisible on the balance sheet. The market is pricing the company as if the R&D produced nothing worth acknowledging. The business owner — the person who understands that the $4.2 billion was converted into five clinical programs, not incinerated — is asking a very different question.
The P/S ratio below 2.0 is not a sufficient condition for an investment conclusion. It is a signal that the market may be undervaluing the pipeline. The next steps are the ones described in Parts Four through Six: examine the pipeline for mechanism validation, clinical data quality, biomarker selection, and FDA designations. The P/S ratio identifies the pool. The clinical assessment narrows it.
Note: Having a drug pipeline increases the chance of the company succeeding (because they could pre-license the drug out for working capital.etc) and flexibility in structuring creative deals which does not dilute shareholders equity. However, if the company (1) does not have a drug pipeline, and (2) does not have sufficient cash or earnings, it is very likely that the company would have to raise additional capital to push the drugs through approval. In most cases where revenues are negligible, and asset values are negligible, raising debt poses a hurdle whilst an equity raise would make the most sense.
Part Eight: The Cautionary Counterweight — Why This Is Not as Easy as It Sounds
Honesty requires a counterpoint to everything above.
The 6.7% Phase I-to-approval success rate is a real number. So is the 28% Phase II-to-Phase III transition rate. The cemetery of pharmaceutical stocks is full of companies that had validated mechanisms, strong Phase II data, and Breakthrough Therapy Designations and still failed in Phase III. Sometimes the patient population was too small for the statistical signal to hold. Sometimes the side effects that appeared acceptable in 200 Phase II patients became disqualifying in 800 Phase III patients. Sometimes a drug works beautifully in the biomarker-positive 30% of patients but the Phase III trial design required efficacy across the full population.
Phase III failure is not rare. It is the standard outcome for most drugs. What the framework above does is narrow the distribution — it identifies programs where the background conditions are most favorable — but it does not eliminate the binary nature of the outcome.
The honest acknowledgment, as noted in the source materials, is that you cannot put an immediate liquidation value on a pipeline drug. You cannot sell the Phase III asset tomorrow and walk away with cash. The value is probabilistic, illiquid, and time-dependent. A Phase III drug is worth much more than zero, but it is not worth as much as an approved commercial product generating current revenue.
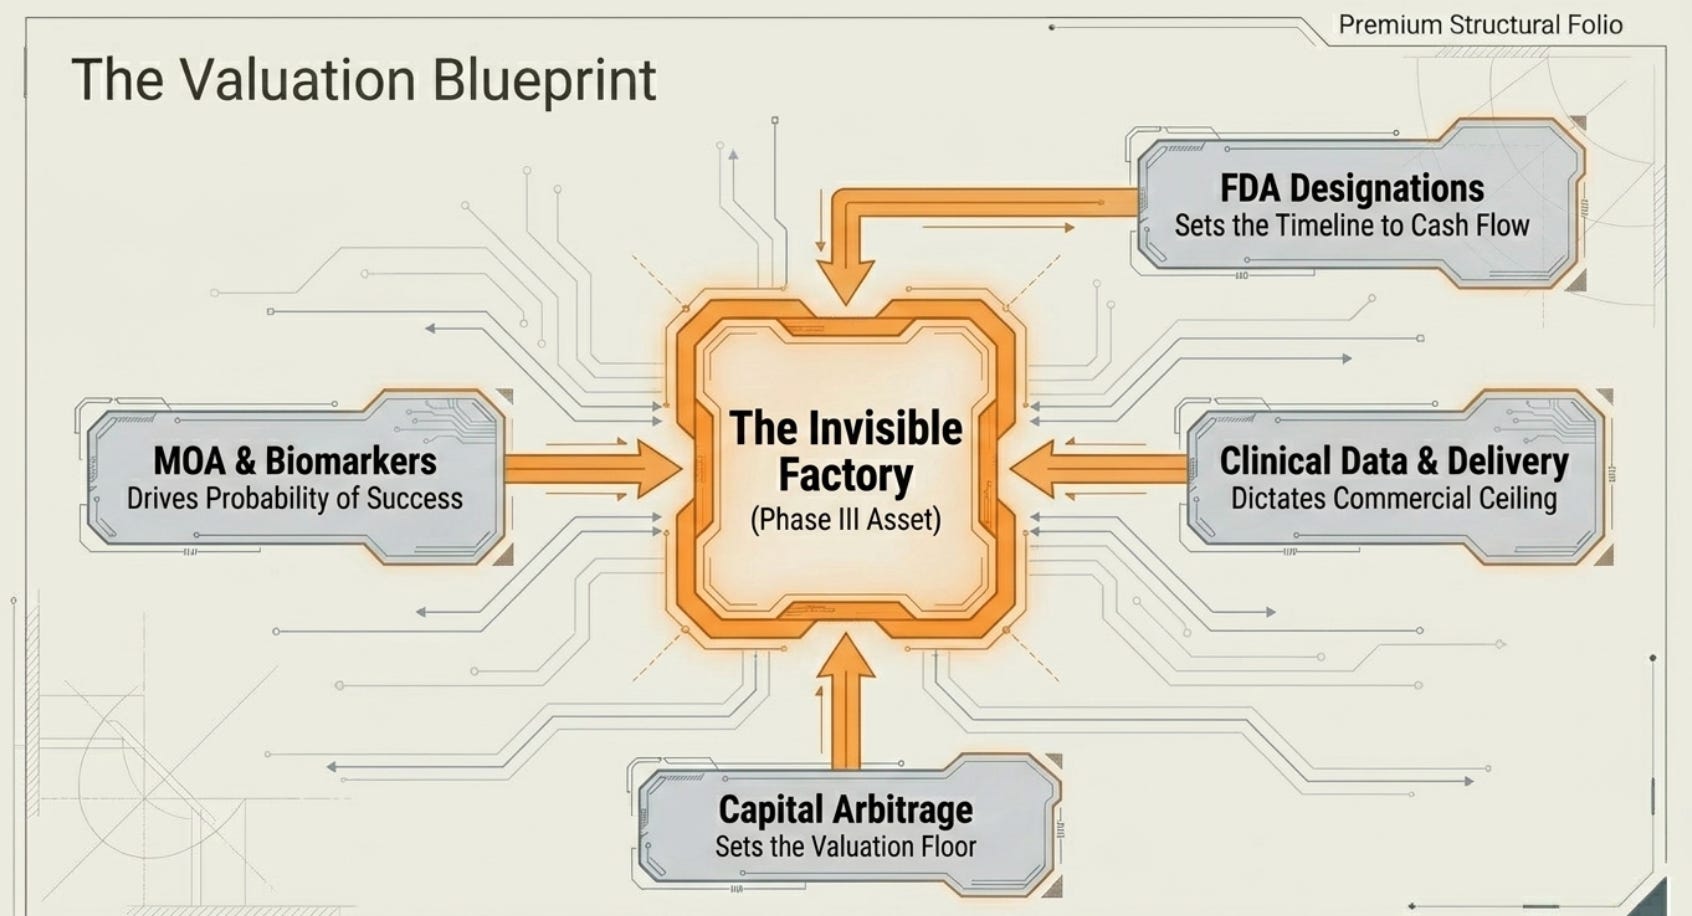
What you can do is recognize when the market has priced a company as if its pipeline is worth zero or close to it, when the publicly available evidence suggests that the pipeline contains programs with the specific profile — validated mechanism, biomarker selection, strong early data, favorable FDA designations, imminent PDUFA dates — that meaningfully narrows the distribution toward success. The gap between “zero” and “non-trivially positive probability” is where the value lives.
Conclusion: The Map Was Always Public
Every piece of evidence that made pembrolizumab’s development look promising in 2012 and 2013 was publicly available. The PD-1 mechanism was described in academic journals. BMS’s nivolumab Phase I data was published in the New England Journal of Medicine. Merck’s KEYNOTE-001 trial was registered on ClinicalTrials.gov with its design and eligibility criteria visible. The FDA’s Orphan Drug Designation and Breakthrough Therapy Designation for pembrolizumab were posted on public FDA databases and announced in press releases. Merck’s 10-K filings disclosed the pipeline with sufficient detail to identify the program as late-stage and prioritized.
The financial models did not capture any of this, because financial models price earnings, and Keytruda had no earnings. The balance sheet did not capture any of this, because GAAP expenses R&D and carries internal drug development at zero. The analysts who covered Merck were focused on the patent cliff on Januvia and the declining pipeline of marketed products.
The business owner — the person thinking about what that factory was actually worth — was reading different documents. They were reading the New England Journal of Medicine article on nivolumab and asking: does Merck’s drug work on the same mechanism? They were checking the ClinicalTrials.gov page for KEYNOTE-001 and asking: how are the response rates? They were reading the FDA’s designation database and asking: what does it mean that the FDA just called this the first Breakthrough Therapy for cancer?
None of those questions required a financial model. They required an understanding of what the asset actually was, what it would be worth if it worked, and what the public evidence said about whether it would work.
That gap — between the financial statement that shows zero and the economic reality that shows a high-probability, high-value manufacturing asset nearing operational certification — is the hidden value. It does not disappear simply because the accountants cannot see it.
Note: This whitepaper references data from clinical trial databases, FDA public records, peer-reviewed medical literature, and public company filings including Merck’s 10-K annual reports for fiscal years 2012, 2013, 2014, and 2015 (SEC filings). Clinical success rate data draws on the MIT/Boston University biostatistics study by Wong, Siah, and Lo (2019), the Norstella/Citeline dataset analysis (2014–2023), and the Jefferies analysis of FDA Breakthrough Therapy Designations (2013–2022). All FDA designation statistics reflect publicly available data from the FDA’s designation databases and peer-reviewed analysis of that data.
If you like what you read, check out my other writings 👇
Rust, Rigs, and the Recurring Revenue Hidden in Plain Sight: A Deep Dive into Beng Kuang Marine (SGX: BEZ)

The Old Steel and the Sea: Why You Should Care About a Ship Maintenance Company
Investment Reflection #2 — The Grand Play: 100 Years of the World’s Nations as Characters in the Greatest Story Ever Told

“The world is not a chessboard. It is a living organism, where every cell — every nation — eats, competes, cooperates, and occasionally tries to eat the others. Understanding it requires not just memorizing moves, but understanding hunger.”

The Tide Is Going Out: Commodity Houses, Private Credit, and the AI Debt Bomb

Start Here: What This Article Is About
Why I Passed on Graftech (EAF): Riding The Battery Hype, Or Perhaps Not...

There is a kind of company that is the most dangerous thing in investing. It is not the fraudulent company. It is not the obviously bad company with terrible products and incompetent management. Those are easy — you just avoid them. The truly dangerous company is the one with a
The Beautiful Trap: Why I'm Passing on The Hour Glass (SGX: AGS)

There’s a peculiar kind of investment that keeps you up at night — not because it’s bad, but because it’s genuinely good. Good enough to admire. Not good enough to buy.
The Diamond in the Rough That Isn't Quite Yours: Why I Passed on Boustead (SGX: F9D)

There is an old saying that investors have borrowed, bent, and quoted so many times it has nearly lost its sharpness: a bird in the hand is worth two in the bush. Warren Buffett, characteristically, gave it a precise mathematical form. The value of any investment, he wrote, is determined by three questions:
The Schoolteacher's Secret Insurer: Why Horace Mann (NYSE:HMN) Is Sitting on My Watchlist

“The stock market is a device for transferring money from the impatient to the patient.” — Warren Buffett

The Dormitory King That Couldn't Leave Home: Why I Passed on Centurion (SGX: OU8)

There is a deceptively simple question that Warren Buffett borrowed from Aesop’s ancient fable, and has repeated across decades of shareholder letters: “How many birds are in the bush? How sure are you they’re there? And how long until you get them out?”
The Children's Place: A $90 Million Bet on a Company That Used to Be Worth $2 Billion (NYSE: PLCE)

There is a classic scene in every heist movie. The detective walks into a room, sees the chalk outline, the scattered evidence, the broken window, and immediately knows something went terribly wrong long before anyone called the police. You do not need the full autopsy report to read the body.
World War 3 In Iran and Why Oil Price Will Continue Increasing — It Arrived Sooner Than Anyone Expected

This is Part 2 of a continuing analysis of California Resources Corp (CRC). Part 1 built the foundational investment case: a company trading at $44 per share against a conservative intrinsic value of $108–$156, built on 567 million barrels of proved developed oil reserves in California, and a management team spending hundreds of millions buying back its…
The Most Overlooked Oil Company in America — And Why That Might Be the Opportunity of the Decade

Date of analysis: 28 December 2025
The Art Of Saying No - MYPS: Playstudios Inc

PLAYSTUDIOS (MYPS) is a Las Vegas-based mobile gaming company that operates free-to-play social casino games and a loyalty platform called playAWARDS, which lets players redeem points for real-world rewards at places like MGM Resorts, Norwegian Cruise Line, and Wolfgang Puck restaurants. On the surface, this sounds like a clever moat. A loyalty program.…
The Art Of Saying No - UGP: Ultrapar Participacoes S.A (Part 2 of 2)

Question 2: How Certain Are You?
The Art Of Saying No - GLIBK: GCI Liberty Inc

Picture this: a single telecommunications company — the dominant one — serves over 200 communities scattered across the largest state in the United States. Alaska. A state with just over one person per square mile. A state where 39% of residents are underserved by broadband. A state where, until recently, some villages received internet via satellite li…

The Art Of Saying No - UGP: Ultrapar Participacoes S.A (Part 1 of 2)

The Setup: A Value Investor Dream?


The Art of Saying No - RIG: Transocean LTD

“The difference between successful people and really successful people is that really successful people say no to almost everything.” — Warren Buffett
The Art of Saying No - KPRX: Kiora Pharmaceuticals Inc

“The difference between successful people and really successful people is that really successful people say no to almost everything.” — Warren Buffett
The Art of Saying No - DNUT: Krispy Kreme Inc

“The difference between successful people and really successful people is that really successful people say no to almost everything.” — Warren Buffett

🎓 A Business Strategy Primer Part 7 - Learning From Great Companies

The Billion-Dollar Playbook: How Market-Based Management Powered Koch Industries’ Unstoppable Rise
The Art of Saying No - MRX: Marex Group PLC

“The difference between successful people and really successful people is that really successful people say no to almost everything.” — Warren Buffett


The Art of Saying No - SFIX: Stitch Fix Inc

“The difference between successful people and really successful people is that really successful people say no to almost everything.” — Warren Buffett
🎓 A Business Strategy Primer Part 2 - Brainstorming Solutions With Value At The Core

Creating An Irresistible Offer
The Art of Saying No - TDOC: Teladoc Health Inc

“The difference between successful people and really successful people is that really successful people say no to almost everything.” — Warren Buffett

The Art of Saying No - MDU: Mdu Resources Group Inc

“The difference between successful people and really successful people is that really successful people say no to almost everything.” — Warren Buffett


The Art of Saying No - AFCG: Advanced Flower Capital Inc

“The difference between successful people and really successful people is that really successful people say no to almost everything.” — Warren Buffett
The Art Of Saying No - VYX: NCR Voyix Corp

“The difference between successful people and really successful people is that really successful people say no to almost everything.” — Warren Buffett
The Art of Saying No - VSTS: Vestis Corp

“The difference between successful people and really successful people is that really successful people say no to almost everything.” — Warren Buffett

🛢️Basic Energy Primer Part 2 - Business and Competitive Landscape

The Man Who Bet Everything on Being Wrong
The Art of Saying No - CISS: C3is Inc

“The difference between successful people and really successful people is that really successful people say no to almost everything.” — Warren Buffett
The Art of Saying No - PSHG: Performance Shipping Inc

“The difference between successful people and really successful people is that really successful people say no to almost everything.” — Warren Buffett

The Art Of Saying No - MAGN: Magnera Corp

The Magnera Corporation Analysis Nobody Asked For (But Everyone Needs)
The Art of Saying No - CHR: Cheer Holding Inc

“The difference between successful people and really successful people is that really successful people say no to almost everything.” — Warren Buffett
The Art of Saying No - WIMI: WiMi Hologram Cloud Inc.

“The difference between successful people and really successful people is that really successful people say no to almost everything.” — Warren Buffett
⚡️Alternative Energy Primer Part 3 - Industry and Sector Technicals

The €2.2 Billion Mistake That Revealed Everything
⚡️Alternative Energy Primer Part 2 - Business & Competitive Landscape

The Shipwreck That Changed Everything

🏥 A U.S. Health Insurance (Managed Care Organizations) Sector Primer

1️⃣ Industry Fundamentals & Macro View

