
A Note on Method Before We Begin
The discipline applied in this paper is identical across every sector where it has been applied before. We are not building a discounted cash flow model. We are not applying an earnings multiple. We are not forecasting commodity prices three years into the future. All of those approaches require you to first forecast the thing you are trying to value — and then apply a multiplier to that forecast — layering compounding uncertainty on top of compounding uncertainty until the output has very little to do with economic reality.
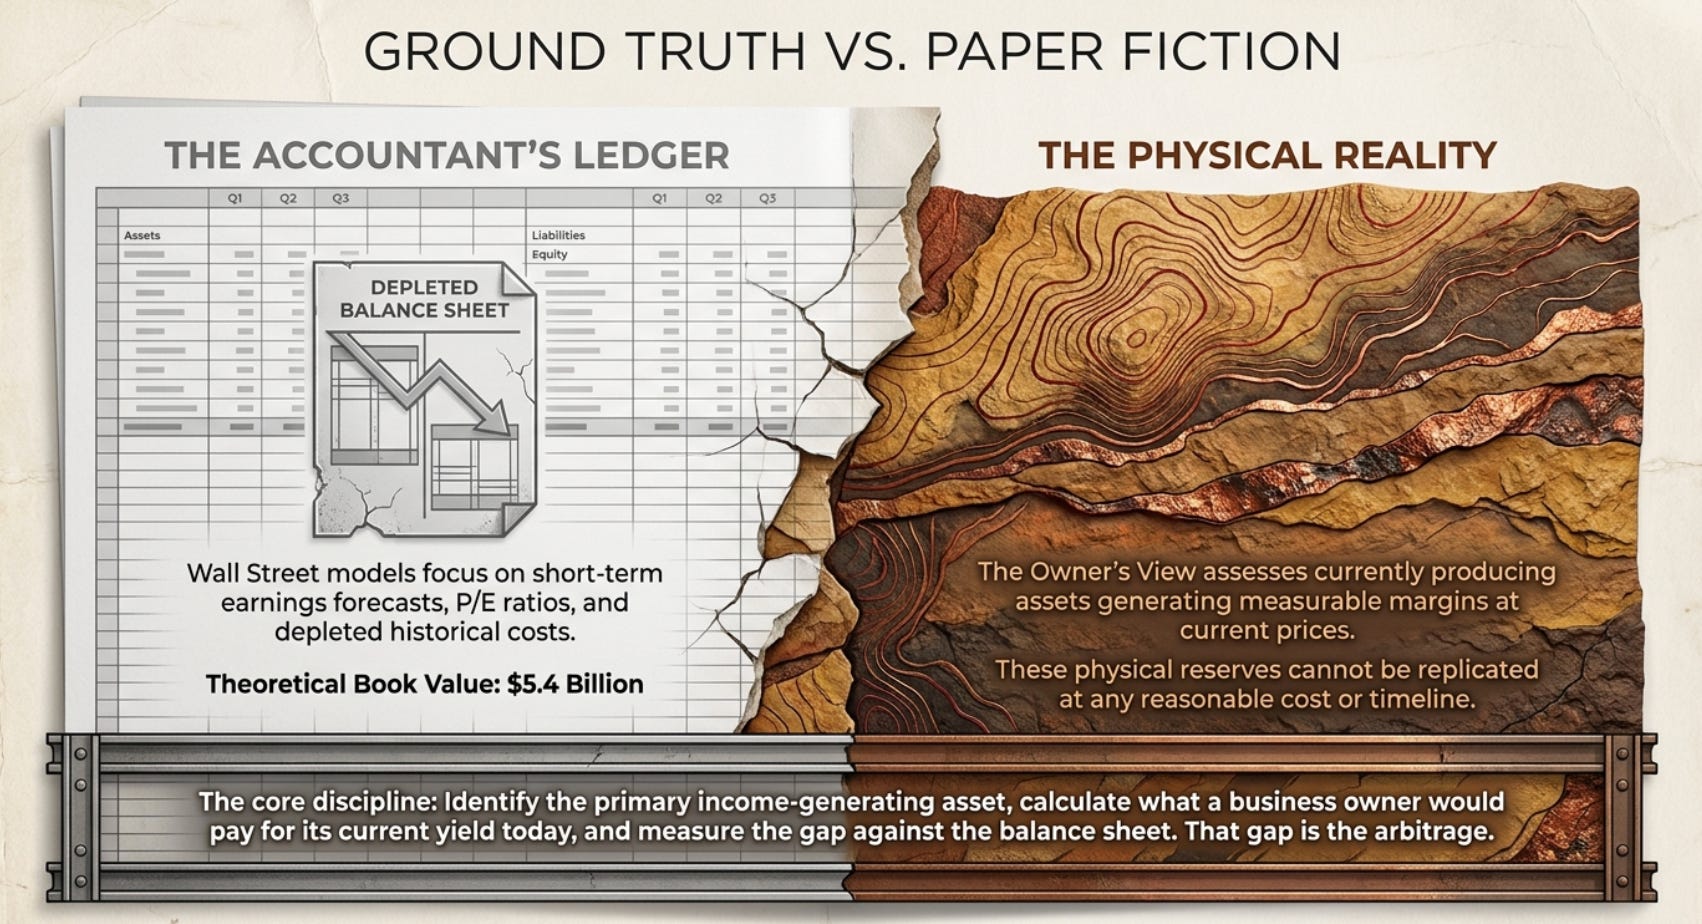
Instead, we do this: identify the primary income-generating asset of the business. Then calculate what a business owner would pay for that asset right now, today, at current prices and current costs, in the same way a farmer walking a plot of land calculates what that land is worth — not based on what rent it might fetch in 2028 under an optimistic scenario, but based on what it yields right now per acre, multiplied by what that crop sells for today, minus what it costs to farm it. That number is the asset’s owner value.
Then we look at what the accountant says the same asset is worth on the balance sheet. We measure the gap. And we explain why the gap exists, why it persists, and what forces will eventually force the market to recognize it.
In phosphate and potash, this gap is unusually large, structurally persistent, and underpinned by a physical reality that is more defensible than almost any other commodity sector: phosphorus cannot be manufactured. Potassium cannot be synthesized. They come from the ground, in specific places, in finite quantities, and without them, crops do not grow. That is not a forecasting assumption. It is biochemistry.
PART I: THE ASSET, FROM FIRST PRINCIPLES
What Phosphorus and Potassium Actually Are to a Plant
To understand why phosphate and potash reserves are worth what they are — and why the market chronically misprice them — you must start with the biology, not the financial statements.
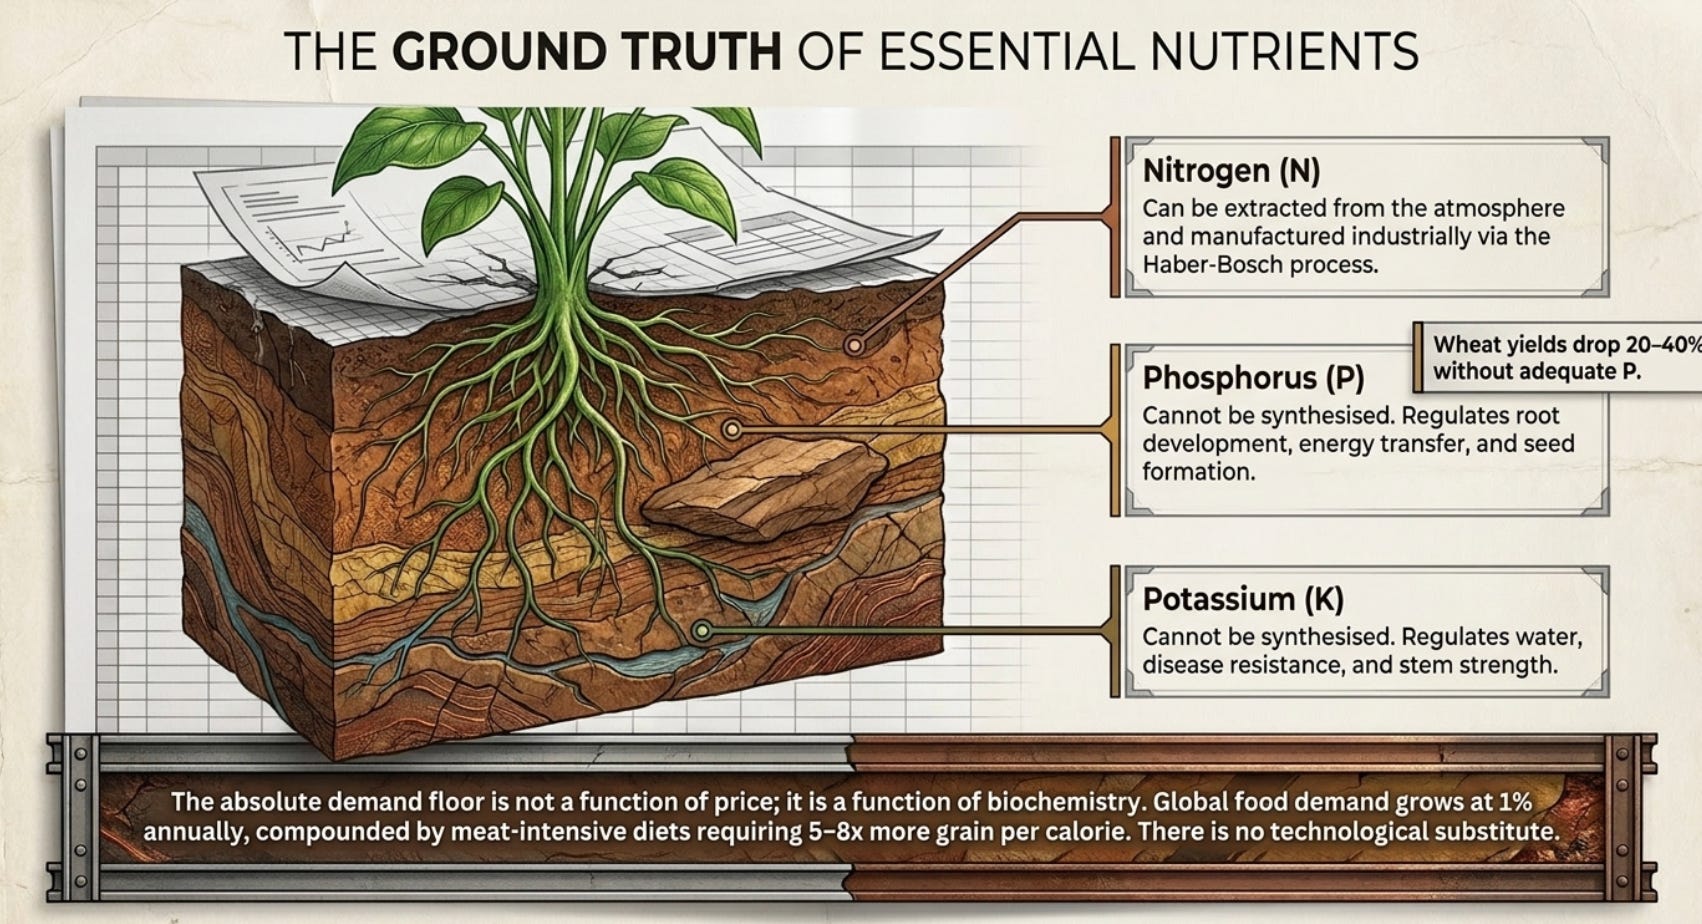
Every plant that grows on earth requires three primary macronutrients to survive. Nitrogen, which plants can receive from multiple sources including fixation from the atmosphere (and which can be manufactured industrially via the Haber-Bosch process from natural gas and air). Phosphorus, which must come from the soil and cannot be synthesized. And potassium, which must also come from the soil and cannot be synthesized. There is no industrial pathway to manufacture either phosphorus or potassium. They must be mined. This is the foundational fact upon which everything else in this paper rests.
Phosphorus in the soil exists primarily as phosphate ions. When a farmer applies diammonium phosphate (DAP) fertilizer — the world’s most widely traded phosphate product — they are delivering concentrated phosphate ions directly to the root zone of the crop, accelerating the plant’s ability to develop roots, transfer energy, and form seeds. A cereal crop like wheat that does not receive adequate phosphate will produce 20–40% lower yields. There is no substitute input. You cannot give wheat more nitrogen to compensate for phosphorus deficiency. The nutrient is specific, the deficiency is specific, and the remedy is specific.
Potassium — applied primarily as potassium chloride (KCl), which is the end product of potash mining — governs the plant’s water regulation, disease resistance, stem strength, and grain filling. A crop deficient in potassium produces weaker stems, higher disease susceptibility, and reduced grain weight. Again: there is no substitute.
This means the demand for phosphate and potash is not a function of price — it is a function of whether you want food. Farmers do not stop applying fertilizers when prices are high; they cut back only at the margin, and even then, the soil depletion that results creates a payback demand in subsequent years. Global food consumption grows at roughly the rate of population growth — 1% per year — compounded by the shift of developing populations toward meat-intensive diets, which require 5–8x more grain per calorie than direct grain consumption. The demand floor for phosphate and potash is essentially equivalent to the demand floor for food. There is no technology that changes this.
Where Phosphate and Potash Come From — And Why the Geography Matters
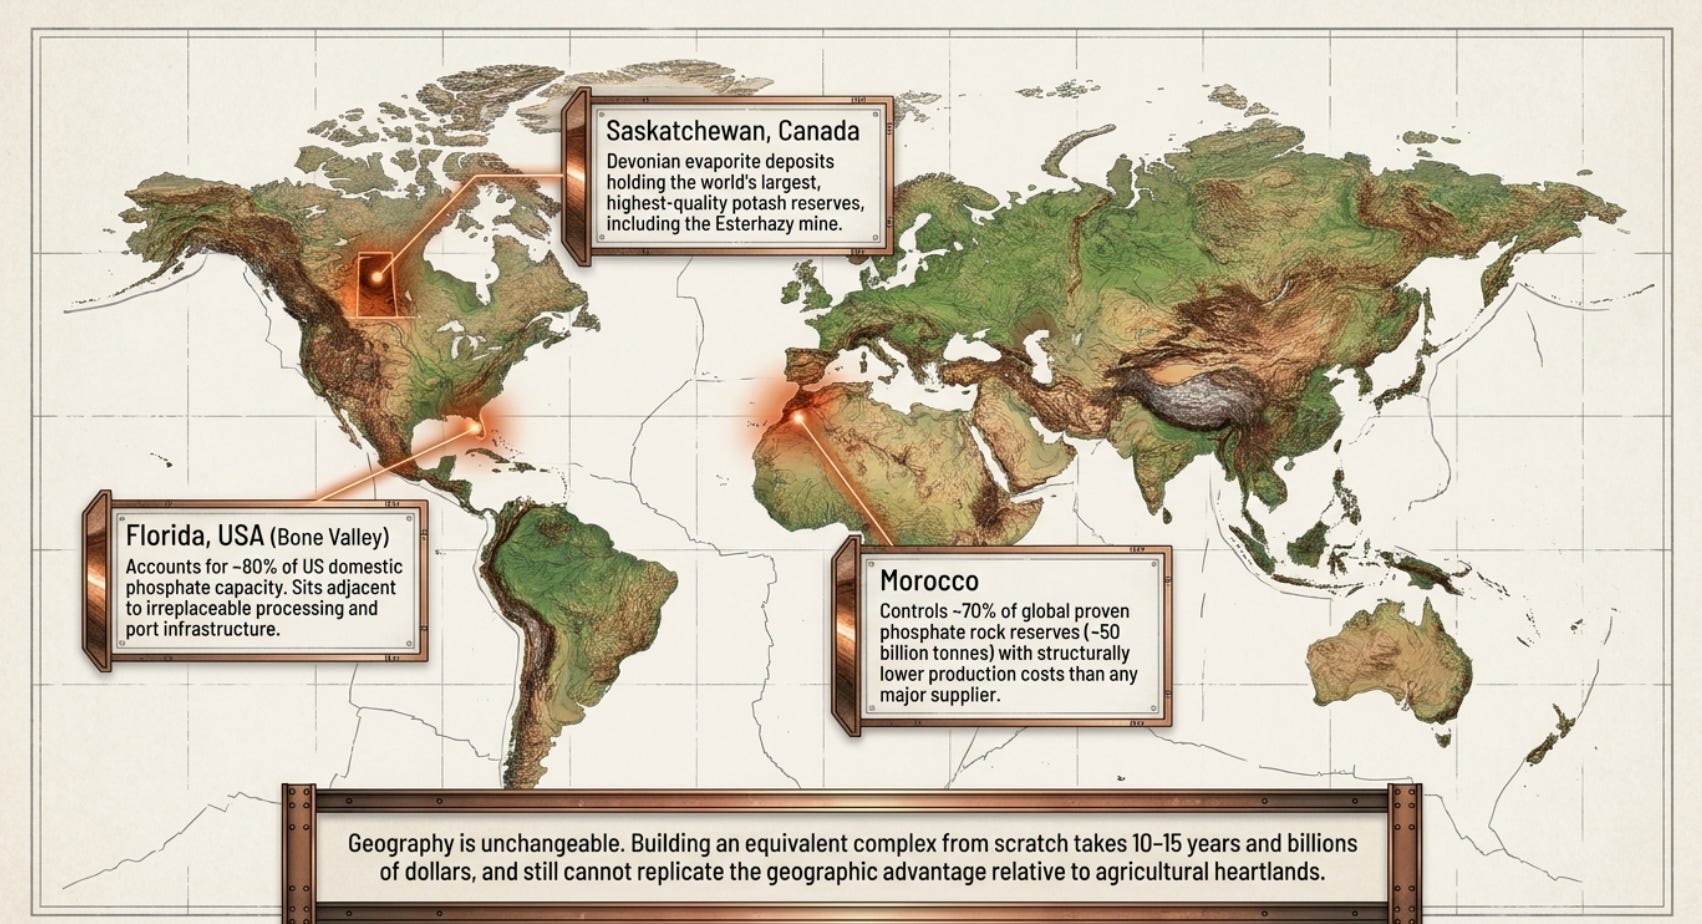
Phosphate rock globally is extraordinarily concentrated. Morocco’s OCP controls approximately 70% of the world’s proven phosphate rock reserves — an estimated 50 billion tonnes, per the US Geological Survey’s 2024 Mineral Commodity Summaries. Morocco’s deposits in the Khouribga, Youssoufia, and Ben Guerir regions have ore concentrations averaging 30–35% P₂O₅ in mineable deposits, at production costs that are structurally lower than any other major supplier. In North America, Florida’s Bone Valley region accounts for approximately 80% of domestic US phosphate capacity — and there is no comparable domestic alternative. The Florida deposits are not merely large; they sit adjacent to existing processing infrastructure, port facilities, and the transportation networks that serve North American agriculture. Building an equivalent complex from scratch would take 10–15 years and billions of dollars, and you still could not move the Florida deposits’ geographic advantage relative to US agricultural heartland.
Potash is similarly concentrated. The Devonian evaporite deposits of Saskatchewan, Canada — the ore bodies that underlie Nutrien’s and Mosaic’s mines — contain the world’s largest and highest-quality potash reserves. Saskatchewan’s Esterhazy mine alone, operated by Mosaic, is the largest single potash mine in the world by reserve base and production capacity. The geological conditions that created Saskatchewan’s potash — ancient inland seas evaporating over millions of years under specific temperature and pressure conditions, leaving behind thick beds of sylvinite ore containing 20–30% potassium chloride — are not replicated elsewhere with the same combination of grade, depth, and accessibility.
Belarus and Russia hold the other major global potash reserves. Belaruskali in Salihorsk and Uralkali in Perm together control substantial portions of global production capacity. But Russian and Belarusian supply has been progressively removed from Western markets since 2022: EU and US sanctions on Belarus following the Lukashenko government’s post-election crackdown and Russia’s subsequent invasion of Ukraine effectively constrained the volume of Eastern European potash available to Western agricultural markets. This geopolitical supply disruption is not temporary. It is structural, and it has permanently altered the sourcing calculus for North American and European farmers.
PART II: THE OWNER’S VALUATION — FOUR NUMBERS AND AN HONEST CALCULATION
An owner assessing a phosphate or potash mining company does not need a model. They need three inputs.
Input 1: Certified tonnes of reserve in the ground. Under GAAP (SEC Industry Guide 7 for US companies) and international equivalents (JORC, NI 43-101), proven and probable mineral reserves are certified by independent qualified persons and published in annual reports. These are not estimates or aspirations — they are statistically confident calculations of extractable ore based on drill hole data, geological mapping, and mine engineering. They represent what the owner legally owns below the surface.
Input 2: Average historical market price per tonne of finished product (including lowest quartile cost). Historically, market prices for finished products are benchmarked against liquid, publicly quoted indices. For phosphate, the historical average is based on Diammonium Phosphate (DAP) at US Gulf FOB; as of 2024, prices traded between $400–$450 per tonne, a significant normalization from the 2022 peak of approximately $900 per tonne. Similarly, potash prices—benchmarked as Potassium Chloride (MOP) at Vancouver or Tampa—stabilized in the $280–$320 per tonne range in 2024, down from historical highs of $950 per tonne in 2022. These benchmarks are tracked weekly by institutions like the World Bank to provide a consistent record of long-term market trends.
Input 3: Cash operating cost per tonne of finished product. This is the actual cost of mining the ore, processing it to finished fertilizer, and delivering it to port. For Mosaic’s Florida phosphate operations, their disclosed cost of production for finished phosphate fertilizer is approximately $280–$320 per tonne all-in (production cost plus processing plus transportation to port), per segment disclosures in their 10-K filings. The resulting gross margin at $420/tonne DAP is approximately $100–$140 per tonne. For Saskatchewan potash, Mosaic’s Esterhazy mine has a disclosed cash operating cost of approximately $80–$120 per tonne KCl — among the lowest in the world given its scale and ore quality. At $300/tonne MOP, the margin per tonne is approximately $180–$220. These margins are not theoretical — they are what the mine actually earned in recent operating periods.
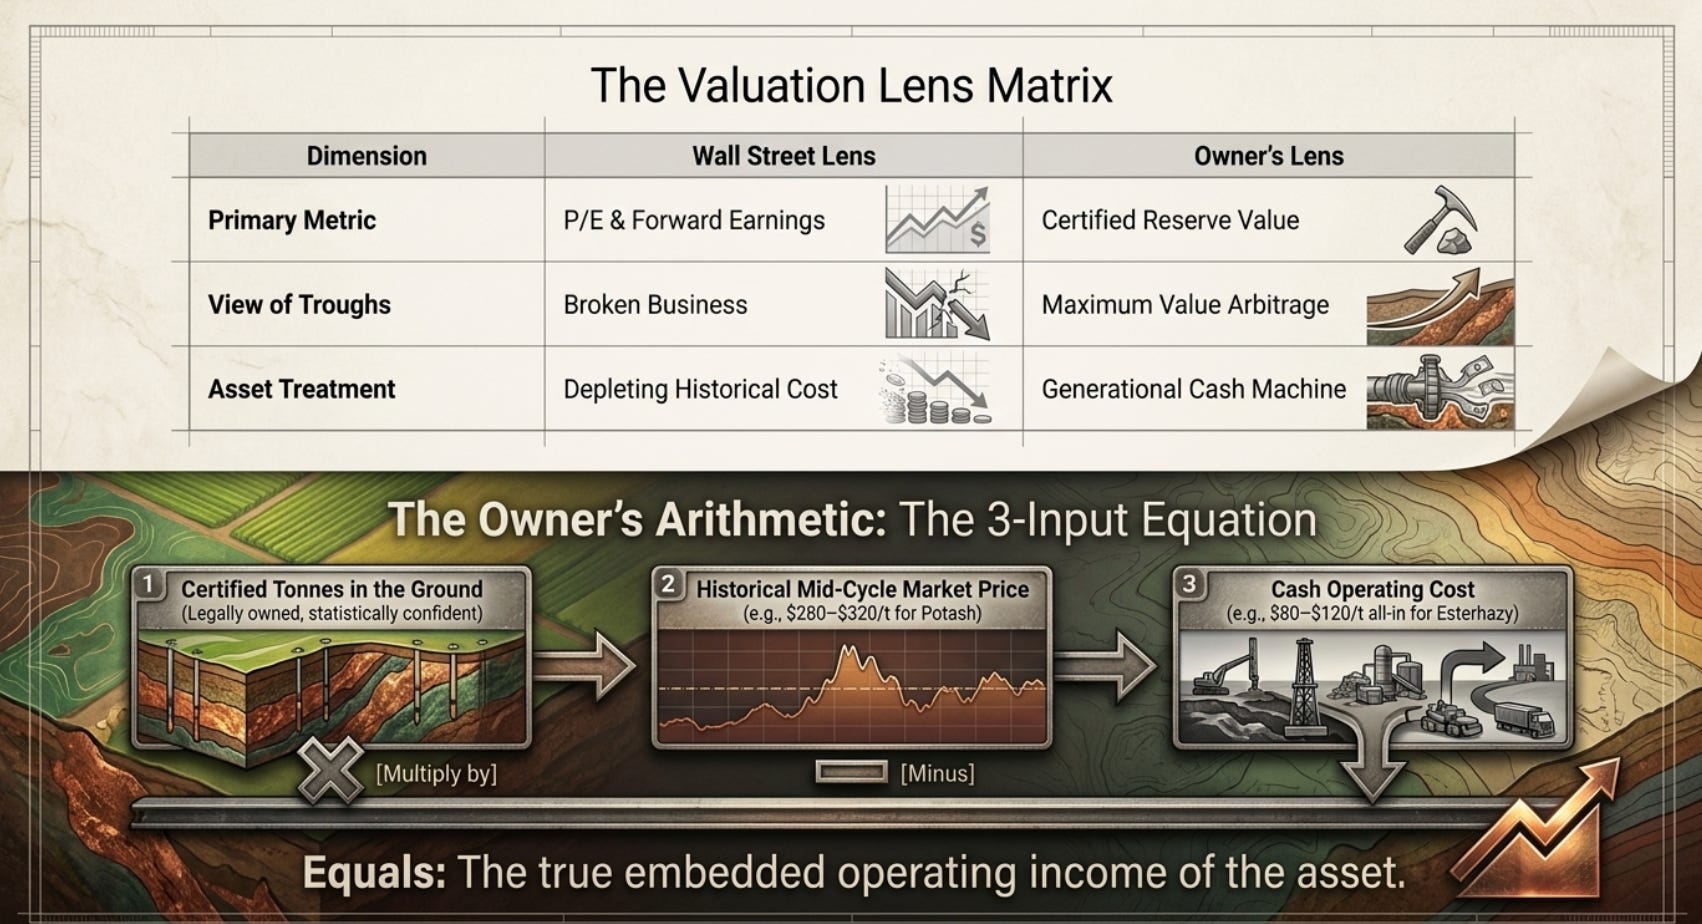
The Owner’s Calculation:
An owner buying this business is not buying a forecast. They are buying assets that exist today, are currently producing, are currently generating measurable margins at current prices, and cannot be replicated by a competitor at any reasonable cost or timeline. The book value says $5.4 billion. The owner’s value — calculated simply as what these assets are capable of generating in profits on average for over a 10 year period — says something fundamentally different, and the gap between the two numbers is the arbitrage.
PART III: THE WALL STREET PROBLEM — AND WHY EARNINGS METRICS FAIL HERE
Commodity Cycles Are Not Business Cycles
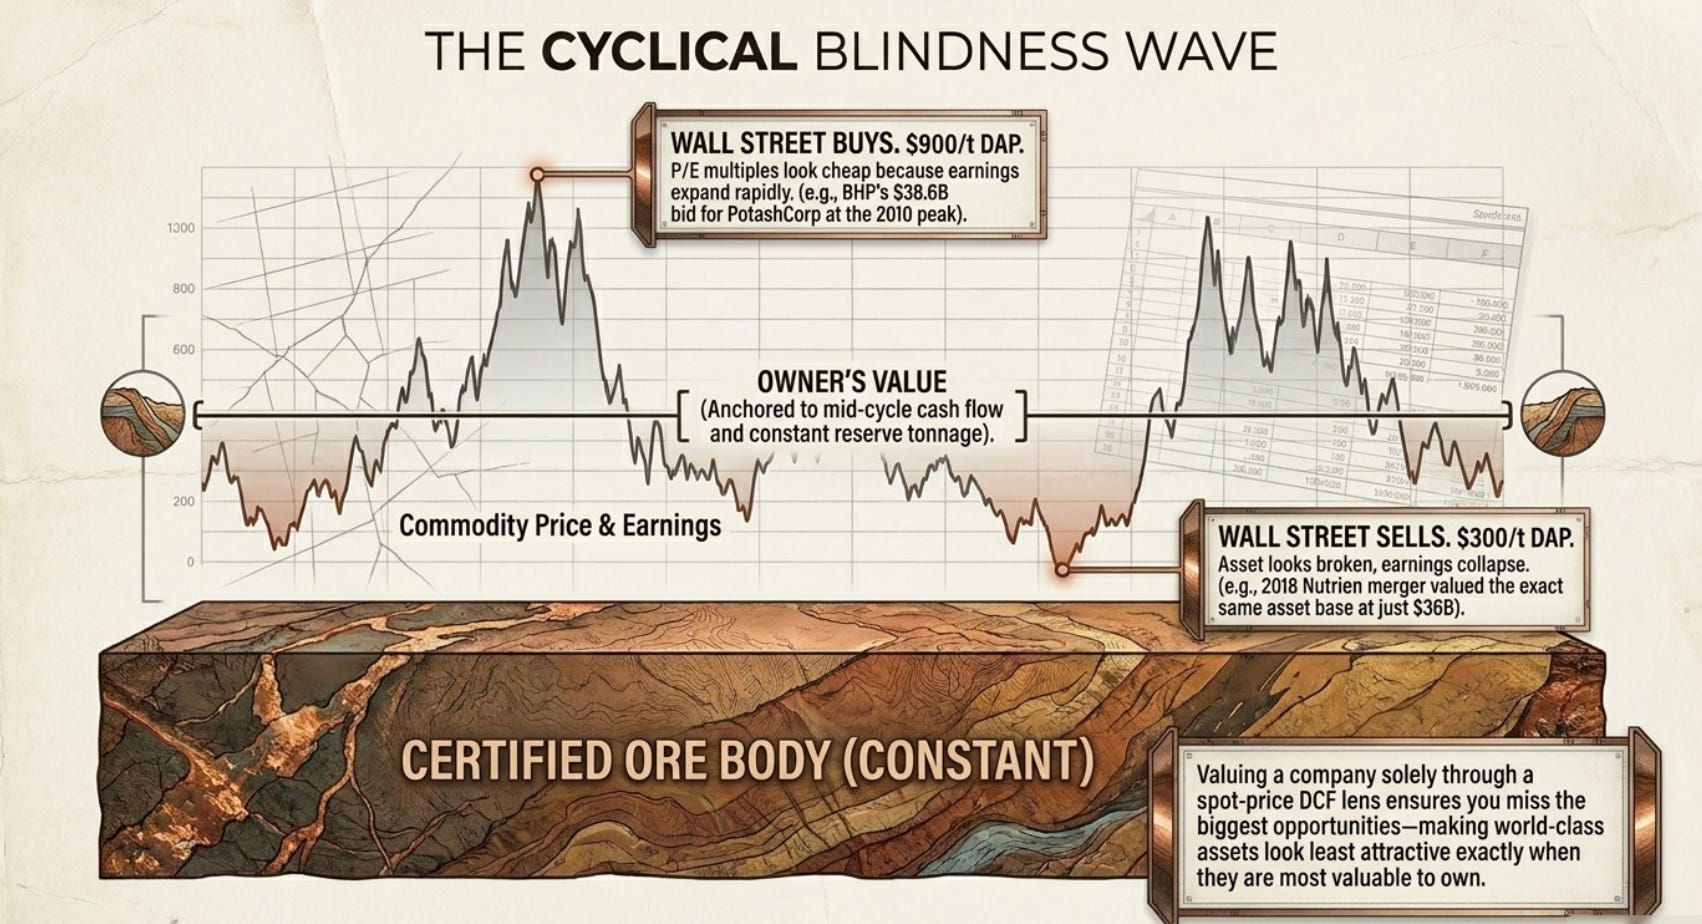
When a Wall Street analyst covers Mosaic, the model invariably centers on earnings forecasts. What will DAP prices be in 2025? What will potash volumes do? What is the consensus on nitrogen? What multiple does the sector deserve? These questions are not unreasonable in isolation — they are the standard toolkit for industrial companies. But they are particularly ill-suited to a business whose primary asset is a mineral reserve, because of one characteristic that almost every financial model ignores: the earnings collapse during price troughs dramatically understates asset value, and the earnings spike during price peaks dramatically overstates it.
Consider what happens to a fertilizer company’s reported earnings when commodity prices fall 40–50% from peak. The ore body is unchanged. The tonnes in the ground are unchanged. The reserves certified by the geological engineers are unchanged. The infrastructure — the chemical plants, the port facilities, the rail access — are unchanged. But the reported P/E ratio, applied to depressed earnings, suggests that the company is expensive or unprofitable, which triggers selling from investors who anchor on the earnings metric. The asset owner, who looks at the same company and says “the mine still has 40 years of reserve life at current production rates, and it still costs me $100/tonne to produce something I can sell for $350/tonne — that is a $250/tonne margin on 8 million tonnes — this asset is worth approximately X,” sees a completely different business than the analyst running earnings models.
The inverse is equally misleading. When DAP prices spiked to $900/tonne in 2022, phosphate companies reported extraordinary earnings. P/E multiples contracted because earnings expanded so rapidly that the stock price could not keep pace. Investors who bought on the basis of “cheap P/E” during a commodity price spike were buying at the peak of the earnings cycle — the worst possible time — because the earnings themselves were not sustainable at those price levels. The ore body, again, had not changed. The mine had not become more valuable. The market price had moved temporarily, and the earnings followed it, and the financial metrics followed the earnings.
The correct instrument for measuring a mining company’s intrinsic value is not the earnings multiple. It is the ore body. How many tonnes are in the ground? What does it cost to extract them? What does the market pay for them? That arithmetic, at mid-cycle prices, is the business owner’s answer — and it is immune to the short-term commodity volatility that makes financial metrics so misleading in this sector.
PART IV: THE ACCOUNTING GAP — WHY THE BALANCE SHEET TELLS YOU ALMOST NOTHING
What GAAP Says About Mineral Reserves
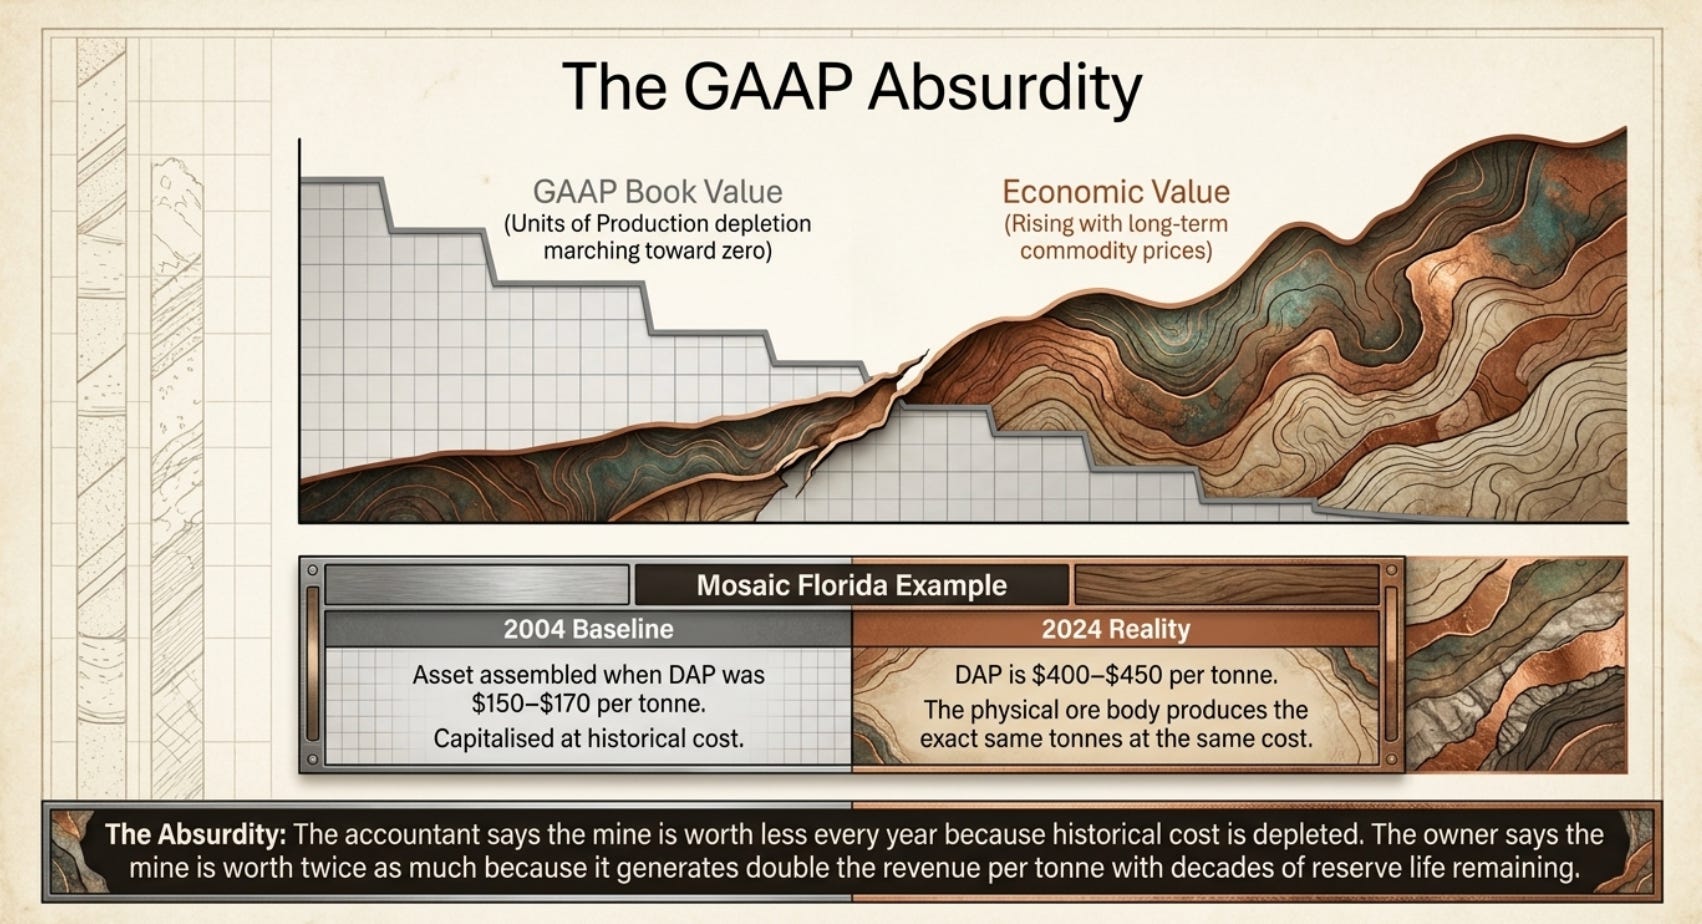
Under US GAAP (ASC 360 for PP&E, with specific guidance for extractive industries under ASC 932 and SEC Industry Guide 7), mineral reserves are not recognized as assets on the balance sheet. The underlying ore body — the billions of tonnes of phosphate rock or potash ore certified by independent geological engineers — carries a balance sheet value of exactly zero. What appears instead is the cost of acquiring the mineral rights and developing the mine, capitalized as Property, Plant, and Equipment, and then depleted against production using the Units of Production (UOP) method.
This creates a systematic and predictable gap. The depleted book value of a mine has three characteristics that distinguish it from economic value: it reflects what someone paid in the past, not what the ore is worth today; it declines as production continues (depletion reduces the carrying value), even as the mine may generate increasing value if commodity prices rise; and it bears no relationship to the replacement cost of an equivalent ore body, which would require 10–15 years of exploration and development capital.
Mosaic’s Florida phosphate operations were assembled primarily through the 2004 merger of IMC Global and Cargill’s crop nutrition business, at prices reflecting early-2000s commodity economics and early-2000s capital costs. The Florida phosphate ore body in 2004 was worth what it was worth in 2004 — DAP prices at the time were approximately $150–$170 per tonne. Today, DAP prices are $400–$450 per tonne even after the 2022 spike correction. The ore body produces the same tonnes at the same cost. The market pays more than twice as much for the finished product. Under GAAP, the carrying value of the asset has declined — because depletion systematically reduces the historical cost figure — while its economic value has roughly doubled.
This is the central absurdity. GAAP requires the balance sheet to show an asset that is worth less every year — because depletion charges reduce the historical cost figure — even as the asset’s economic value may be growing, because the commodity it produces is selling for more money. The accountant says: “This mine is worth less than it was five years ago, because we have depleted part of the historical cost.” The owner says: “This mine is worth more than it was five years ago, because DAP prices are higher, we still have 35 years of reserve life, and reserves barely decreased” Both statements are consistent with their respective measurement frameworks. Only one of them measures the actual economic value.
PART V: THREE CASE STUDIES IN PHOSPHATE AND POTASH VALUE ARBITRAGE
Case Study 1: The BHP Bid That Revealed Everything (2010)
In the summer of 2010, BHP Billiton’s $38.6 billion unsolicited bid for PotashCorp—at $130 per share—forced a stark realization upon the market. At the time, the industry was valuing PotashCorp using Discounted Cash Flow (DCF) models heavily weighted toward the prevailing spot prices. With potash trading near historic highs, these models produced valuations that mirrored the peak of the cycle. To the average analyst, PotashCorp was “fairly valued” because the math worked—as long as $800/tonne potash was the input.
The fundamental risk of this approach is that a DCF model is only as good as its price assumptions. In a cyclical commodity market, relying on current prices means:
During Booms: Valuations are inflated, making acquisitions seem prohibitively expensive or justifying “buying at the top.”
During Slumps: Valuations collapse, making world-class assets appear “broken,” leading investors to stay on the sidelines when they should be buying.
The Nutrien Reality Check
The flaw in spot-price DCF modeling is most evident when comparing the 2010 bid to the 2018 formation of Nutrien. By 2018, the industry was in an “ongoing slump,” with prices plummeting below $300/tonne. Consequently, the market’s DCF-driven valuation for the Agrium-PotashCorp merger was approximately $36 billion.
Think about the math: In 2010, the market accepted a $38.6 billion valuation for PotashCorp alone. Eight years later, the market valued that same asset base—plus Agrium’s massive retail network—at $2.6 billion less.
Potash Corp’s reported potash reserves did not change significantly in terms of total scale between 2010 and 2018, as they are part of massive, long-life Saskatchewan deposits
The geology hadn’t changed. The reserves hadn’t moved. Only the price input in the spreadsheets had shifted.
Some context on price: The primary reason the Nutrien merger valuation ($36 billion in 2018) appeared lower than BHP’s historical bid ($38.6–$43 billion in 2010) is a fundamental shift in the potash market and the differing nature of the two deals — BHP's bid occurred when potash prices were significantly higher, fueled by post-recession optimism and high global demand in 2010. By the time Agrium and PotashCorp merged, the industry was in an "ongoing slump". Over-supply and the breakdown of major potash cartels (like the 2013 Uralkali-Belaruskali split) had caused prices to plummet from over $800/tonne to below $300/tonne
Missing the Opportunity
If you value a company solely through a DCF lens tied to the current curve, you will almost always miss the biggest opportunities. A DCF makes an asset look least attractive exactly when it is most valuable to own: at the bottom of the cycle.
BHP’s bid represented a different logic—one that recognized a “floor” on intrinsic value. While the industry’s DCF models swung wildly between 2010 and 2018 based on the whims of potash cartels and global supply, the actual utility and irreplaceability of the Saskatchewan ore bodies remained constant. To capture true value in this sector, one must average out prices over the long term. Valuing an asset based on its mid-cycle earning power provides a tether to reality that a spot-price DCF simply cannot offer.
Case Study 2: The Cartel Crack and the $900 to $300 Collapse (2008–2015)
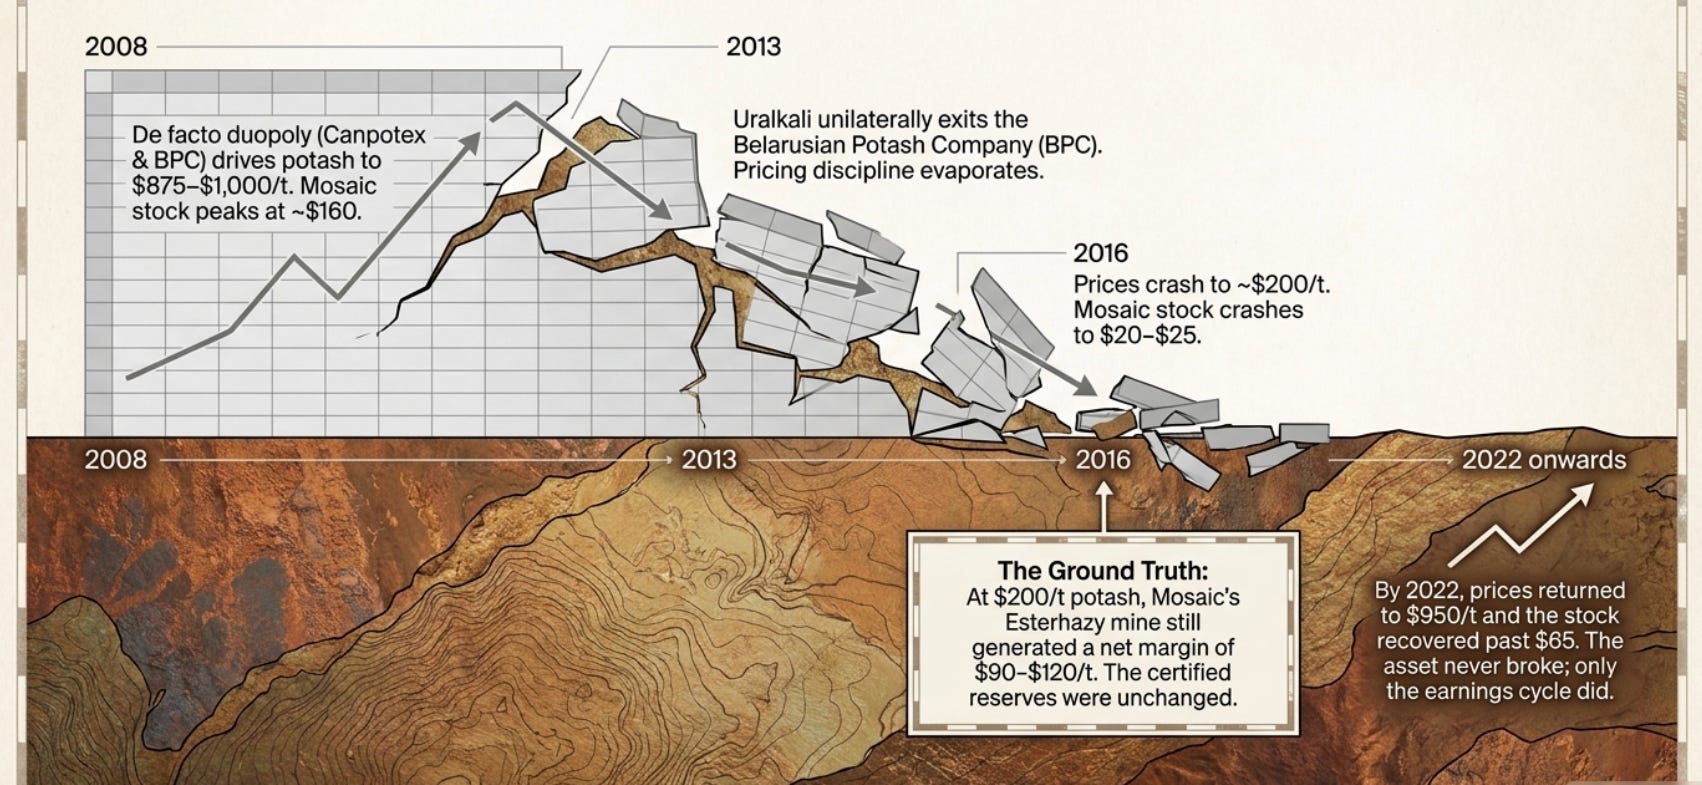
The potash market from roughly 2005 to 2013 operated under what was, in practical terms, a duopoly. On one side: Canpotex, the North American export marketing company jointly owned by PotashCorp, Mosaic, and Agrium, which collectively controlled roughly 35% of global potash supply. On the other side: the Belarusian Potash Company (BPC), which coordinated the export marketing of Belaruskali of Belarus and Uralkali of Russia, controlling another 35–40% of global supply. Together, these two marketing consortiums controlled approximately 70% of traded potash, and they managed that supply with the explicit goal of maintaining high prices by restricting output — a structure the financial press and economists correctly identified as a de facto cartel, referred to at the time as “the OPEC of potash.”
Market watchers and investors were broadly aware of this structure. The celebrated value investor Jeremy Grantham, in his July 2012 quarterly letter, warned explicitly about the potential for duopolistic price gouging in potash markets and the food security implications. Investment banks wrote reports about how Canpotex and BPC would sustain prices above $400/tonne indefinitely by coordinating their production volumes. The assumption was structural, embedded in models, and widely believed.
In 2008, driven partly by the food crisis and partly by cartel discipline, potash prices reached approximately $875–$1,000 per metric tonne — up from roughly $100/tonne in 2004. A 10x price increase in four years. The financial models extrapolated this trend; the earnings models for potash companies looked spectacular; and the market priced potash miners as if $500–$700/tonne potash was the new permanent equilibrium. Mosaic’s stock price reached approximately $160 per share in 2008.
On July 30, 2013, Uralkali — one of the world’s largest potash producers — announced that it was unilaterally withdrawing from the Belarusian Potash Company marketing consortium. The reason was a dispute with its Belarusian partners over accusations that Belaruskali had been selling volumes outside the agreed cartel framework. Regardless of the cause, the effect was immediate and dramatic: the informal pricing discipline that had held potash prices above $400/tonne for years evaporated overnight. Uralkali’s CEO, Vladislav Baumgertner, stated publicly that the company’s strategy was now to “increase volumes” — the explicit declaration that the cartel was over and price competition would follow. Potash prices fell from approximately $400/tonne to $300/tonne within months. By 2016, prices had reached approximately $200/tonne.
The financial models that had built $400–$500/tonne potash into their assumptions were catastrophically wrong. Mosaic’s earnings per share collapsed. Earnings multiples that had looked attractive suddenly became unattractive as earnings fell more than prices, due to operating leverage. The stock fell from its 2008 peak of $160 to approximately $20–$25 per share by 2015–2016. Analysts reduced price targets. Institutional investors sold. The market consensus shifted from “potash is a strategic asset with pricing power” to “potash is a cyclical commodity with competitive supply.”
The collapse in potash prices revealed something important about the distinction between earnings-based valuation and owner’s valuation. At $200/tonne potash and Mosaic’s cash operating cost of $80–$110/tonne for Esterhazy production, the mine was still generating a net margin of $90–$120/tonne. It was less than the $300–$400/tonne margin at peak prices, but it was real, positive, and ongoing. Esterhazy’s ore body had not changed. The certified reserves were unchanged. The mine’s physical capacity was unchanged. The financial models said the business was worth $20–$25 per share; the ore body said the asset was worth considerably more.
The confirmation came in 2021–2022, when Russia’s invasion of Ukraine triggered sanctions on Belaruskali — which had been the supply that broke the cartel — and simultaneously tightened Russian potash export capacity. With Belarusian and Russian supply constrained by sanctions, potash prices returned to approximately $950/tonne by April 2022. The same Esterhazy ore body, the same Saskatchewan geology, the same mine infrastructure — now worth dramatically more. Mosaic’s stock price recovered from its 2016 lows to above $65 per share in 2022. The owner who had looked at the ore body in 2016, calculated the margin at $200/tonne potash and $100/tonne cost, and understood that the asset would still be there when prices recovered — that investor earned a 200–250% return while the financial models told everyone else to sell.
The cartel collapse taught the market to price potash as a competitive commodity. The owner’s framework always treated it as something different: a certified geological reserve in an irreplaceable location, generating positive cash margins at any potash price above $100/tonne (Esterhazy’s approximate floor cash cost), with decades of reserve life remaining. The earnings collapsed. The asset did not. Confusing the earnings with the asset is the fundamental error that cyclical commodity investing requires you to avoid. The owner never confuses them.
Case Study 3: Intrepid Potash and the Market That Forgot the Mine (2022–2024)
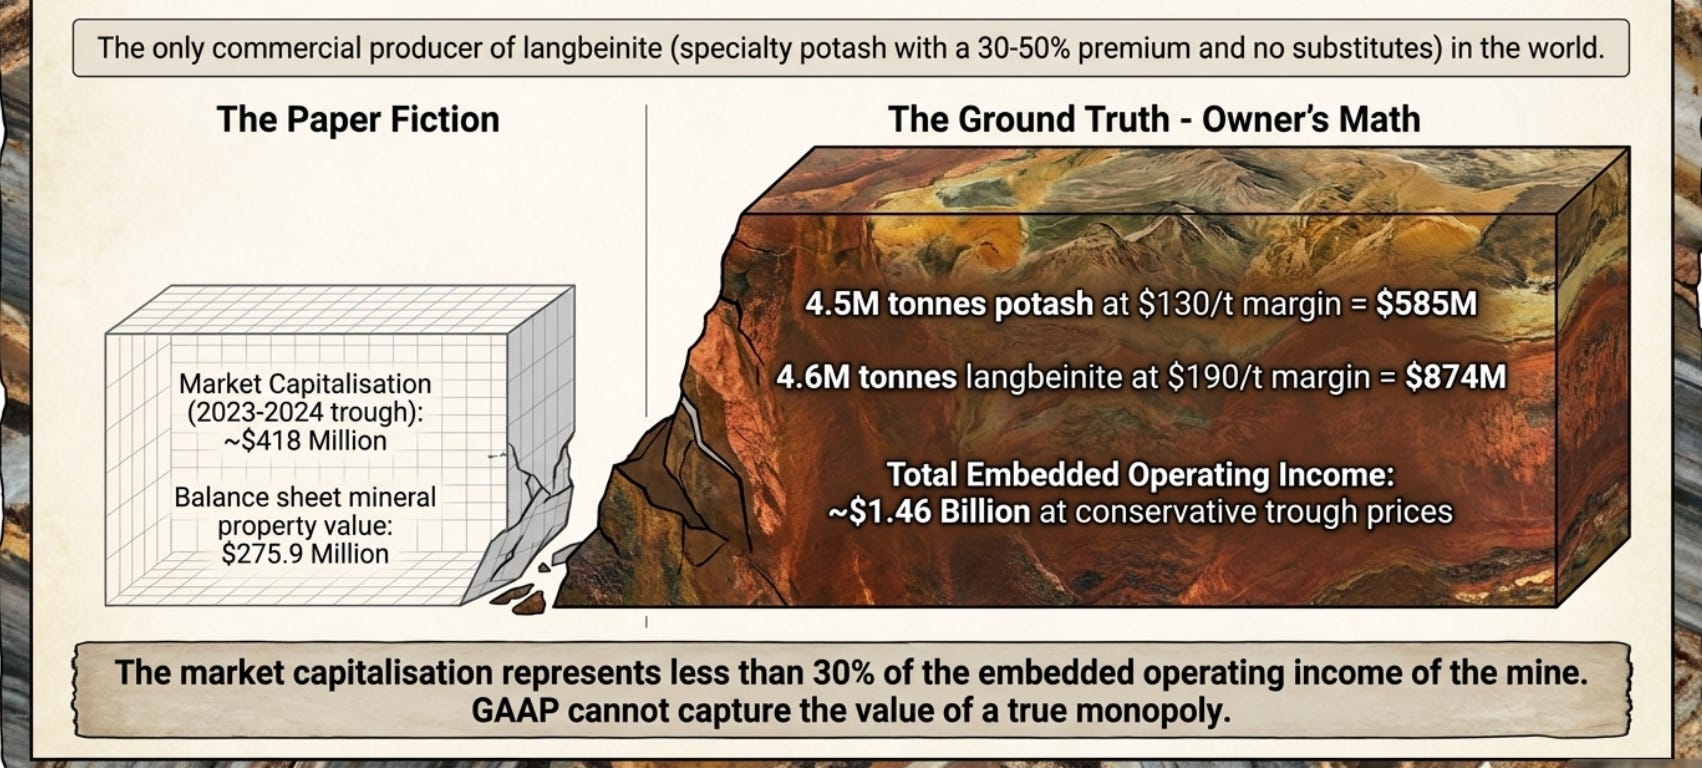
Intrepid Potash, Inc. (NYSE: IPI) is the only US-domiciled potash producer of any meaningful scale. It operates two conventional potash mines in New Mexico — the IPNM facility near Carlsbad, which uses solution mining (dissolving underground potash deposits and recovering the brine) and the Moab facility in Utah — plus a langbeinite operation producing a specialty potash product called langbeinite (K-Mag), which contains potassium, magnesium, and sulfur in a single mineral and has no commercial equivalent produced by any other company in North America.
This last fact is important enough to repeat: Intrepid Potash is the only commercial producer of langbeinite in the world. Langbeinite is particularly valuable for specialty agriculture — wine grapes, tree nuts, and organic crops where chloride sensitivity makes standard potassium chloride unsuitable. The premium for langbeinite versus standard potash historically ranges from 30–50%. There is no substitute product from any other supplier.
Per its SEC filings, Intrepid Potash’s New Mexico mineral reserves as of December 31, 2022 included: 5.4 million metric tonnes of proven potash reserves plus 4.6 million metric tonnes of proven langbeinite reserves at the IPNM facility, with net book values of the New Mexico property at approximately $172.3 million, Moab at $62.6 million, and Wendover at $41.0 million — a combined book value of approximately $275.9 million across all mineral properties.
When potash prices were at $950/tonne in early 2022, Intrepid’s revenue per tonne was approximately $700–$800 (blended across products). The company’s market capitalization at the 2022 peak was approximately $1.2 billion. Applying the owner’s arithmetic to the potash reserve: 4.5 million product tonnes of potash plus 4.6 million product tonnes of langbeinite, at margins of approximately $400–$500/tonne at peak prices, implied an extraordinary embedded operating income.
By late 2023 and into 2024, potash prices had corrected from their $950/tonne peak to approximately $280–$310/tonne standard MOP. Langbeinite prices also softened, though less severely given their specialty nature and Intrepid’s monopoly position. Intrepid’s quarterly revenue fell from peak levels. Reported earnings compressed. The stock fell from its 2022 peak of approximately $75 per share to approximately $18–$22 per share by 2023–2024.
At $22 per share and approximately 19 million diluted shares, the market capitalization was approximately $418 million. Set against this: the New Mexico mineral properties on the balance sheet at $172.3 million book value (conventional GAAP, historical cost, depleted). The owner’s arithmetic at trough prices: 4.5 million product tonnes of potash at $290/tonne current price, less approximately $160/tonne cash operating cost (per company disclosures), equals a $130/tonne margin on potash alone. 4.6 million product tonnes of langbeinite at $350/tonne price (approximate specialty premium), less $160/tonne operating cost, equals a $190/tonne margin. Total gross operating income embedded in the New Mexico reserves, at current trough prices: approximately $585 million from potash and $874 million from langbeinite — a combined $1.46 billion in embedded operating income from certified reserves, against a market capitalization of $418 million. The market capitalization was less than 30% of the embedded operating income of the mine at trough prices. The balance sheet said $275 million in mineral properties. The owner’s arithmetic said approximately $1.5 billion at conservative current pricing.
The specialty premium in langbeinite is particularly striking. Because Intrepid is the only producer, it has no comparable on the supply side. The market cannot replace Intrepid’s langbeinite with anything from any other company. The mine, the ore body, and the US specialty agriculture customer relationships Intrepid has built over decades are a bundled asset with genuine monopoly characteristics. This asset is carried on the balance sheet at historical development cost. The balance sheet treats it the same as any other mining property. It is categorically not the same as any other mining property.
The case remains in progress as of mid-2026, which makes it particularly instructive. The ore bodies have not been impaired. The langbeinite monopoly has not been challenged. Intrepid’s cash operating costs have not materially changed. The only thing that changed was the commodity price cycle. An owner looking at this situation sees a company priced at less than one-third of the embedded operating income of its certified reserves, at trough prices, with a genuinely irreplaceable specialty product that no competitor can supply. The thesis is the same thesis the owner always applies: the asset exists, the cash flows from it are real and positive, and the market is pricing the stock as if the business is impaired when the business is merely operating at a trough price point in a cycle that has historically turned.
The langbeinite monopoly in Intrepid’s case is the clearest possible illustration of the gap between accounting treatment and economic reality. GAAP says: this is a mining property at historical cost, depleted over time. The owner says: this is the only commercial langbeinite mine on earth, serving a premium specialty market with no alternative supplier, and the certified ore body runs for decades. Those are not the same asset. GAAP cannot capture what “only” means in a competitive market context.
PART VI: PURE-PLAY CASE STUDIES — ICL GROUP AND THE DEAD SEA
ICL Group: When the Mine Is a Geologic Miracle
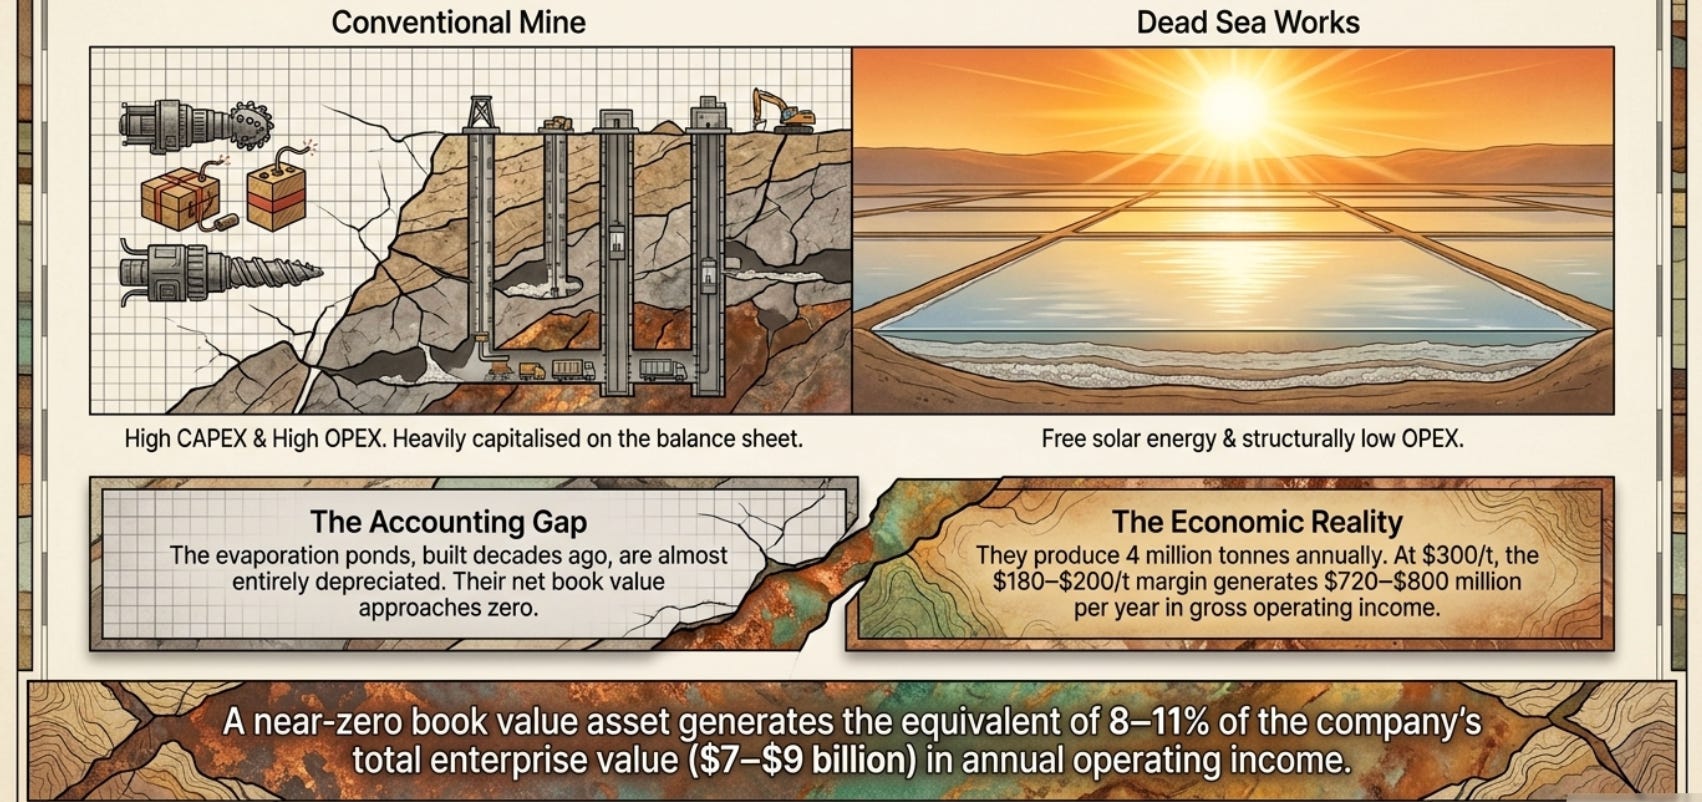
ICL Group (NYSE: ICL) operates its primary potash production from what may be the most operationally unusual mining asset in the world: Dead Sea Works, located on the southern shores of the Dead Sea in Israel. This is not a conventional underground mine. It is a solar evaporation operation. ICL pumps brine from the northern basin of the Dead Sea into a series of enormous, shallow evaporation ponds — 150 km² in total — where the Israeli desert sun does the work of concentrating the minerals. Carnallite (a potassium-magnesium mineral) precipitates from the concentrated brine and is harvested, processed, and refined into potassium chloride fertilizer at approximately 62% K₂O purity — among the highest concentrations in global potash production.
The economics of this process are unlike any underground mine. There is no conventional mining — no drilling, no blasting, no shaft sinking, no rock handling. The primary energy input is solar radiation, which is free. The primary infrastructure input is the evaporation ponds themselves, which once constructed have minimal maintenance requirements and effectively unlimited operational life as long as the Dead Sea itself continues to exist. ICL’s Dead Sea Works has been operating continuously since 1931 — nearly a century — and its concession from the Israeli government runs through 2030, with anticipated renewal.
Annual potash production capacity at Dead Sea Works is approximately 4.0 million metric tonnes, contributing to ICL’s position as the world’s sixth-largest potash producer. ICL also operates underground potash mines in Spain (ICL Iberia, with two mines near Barcelona producing approximately 1.5 million tonnes per year) and phosphate mining operations in Israel’s Negev Desert through ICL Rotem, which holds a long-term government concession for phosphate extraction.
The Accounting and Owner’s Gap for ICL
ICL’s evaporation ponds at Dead Sea Works are capitalized on the balance sheet at historical construction cost — the cost of building the pond infrastructure, roads, pumping stations, and processing facilities — minus accumulated depreciation over decades of operation. The older sections of the Dead Sea Works evaporation infrastructure, built in the 1930s–1950s, are almost entirely depreciated. Their net book value approaches zero.
Yet they produce 4 million tonnes of potash per year. At a current MOP price of approximately $300/tonne and an all-in operating cost that ICL has historically disclosed to be among the lowest in the industry — the solar evaporation process and the proximity of the brine source to the processing facility create a structural cost advantage — ICL’s Dead Sea potash segment operates at margins that are largely invariant to the capital cost of the evaporation infrastructure, because that infrastructure is already built and already paid for.
The owner’s calculation: 4 million tonnes per year, at approximately $180–$200/tonne margin (reflecting the cost-competitive solar evaporation process versus conventional underground mining), generates approximately $720–$800 million per year in gross operating income from the Dead Sea Works potash operation alone — from infrastructure with a near-zero net book value on the balance sheet. ICL’s total enterprise value as of 2023–2024 ranged from approximately $7–$9 billion. The Dead Sea Works potash operation, on a standalone owner’s metric, was generating the equivalent of 8–11% of the total enterprise value in annual operating income from near-zero-book-value assets.
ICL also disclosed a meaningful sensitivity: every $20 change in average potash CIF price produces approximately $100 million of annual EBITDA impact (disclosed in their Q4 2023 earnings release). This linear price-to-EBITDA relationship confirms the owner’s arithmetic in another form: the leverage to commodity prices is direct and predictable, because the operating cost structure of the Dead Sea is largely fixed and the marginal revenue from each additional tonne flows nearly entirely to the operating line.
PART VII: THE PHOSPHORUS SCARCITY ARGUMENT — THE LONG-TERM FLOOR NO MODEL CAPTURES
There is a layer of value in phosphate reserves that no financial model adequately captures because it operates on a timescale that exceeds any analyst’s forecast horizon. It is worth stating clearly because it is the single most important structural fact about phosphate as a resource.
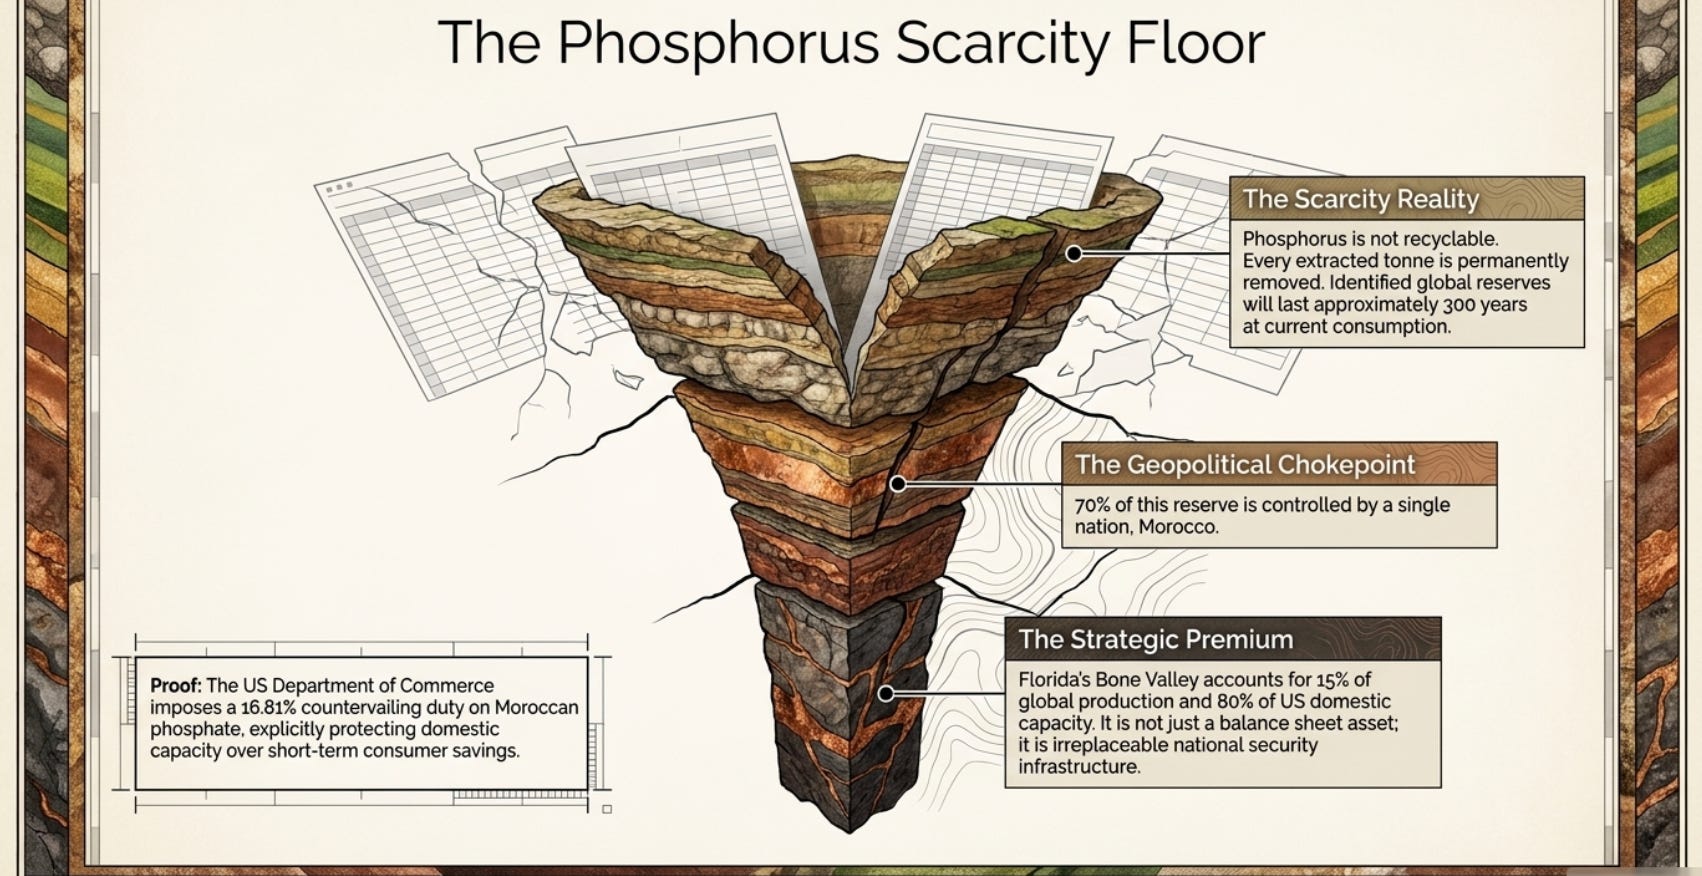
Phosphorus is not recyclable in the conventional sense. It leaves the farm in grain, travels through the food system, is consumed by humans and animals, and ultimately ends up in wastewater, rivers, and oceans — where it is effectively inaccessible. The US Geological Survey estimates that at current rates of global consumption, identified world phosphate rock reserves would last approximately 300 years. This sounds comfortable until you account for the concentration of those reserves: Morocco holds approximately 70%, and the second-largest holder is also an unstable jurisdiction from a Western supply-chain security perspective. Accessible, affordable, Western-controlled phosphate reserves are significantly more limited.
More importantly, there is no substitute. You cannot replace phosphorus in plant nutrition with any other element. You cannot synthesize it. You cannot extract it from the atmosphere. Every tonne of phosphate rock extracted from the ground and converted to fertilizer is a tonne permanently removed from the extractable reserve base.
Unlike potash, which at very high prices might eventually be substituted to a limited degree by different potassium sources, phosphorus has no substitute pathway at any price.
The Florida phosphate district — which accounts for 80% of US domestic phosphate capacity and roughly 15% of global phosphate rock production — is an irreplaceable national resource. Mosaic’s Florida reserves are not merely a balance sheet asset. They are a strategic agricultural infrastructure asset with no domestic alternative. The US cannot replace Florida phosphate rock with imports from Morocco at stable prices, because a shock to Moroccan supply (political instability, export restrictions, or OCP’s market pricing decisions) would immediately affect every American farmer who applies phosphate fertilizer to their fields.
The countervailing duty that the US Department of Commerce has imposed on Moroccan phosphate fertilizer imports — reached 16.81% as of November 2024 — is itself evidence of this dynamic. The US government has explicitly chosen to protect domestic phosphate production capacity precisely because the strategic value of owning the only significant domestic phosphate reserves exceeds the short-term consumer cost savings from importing cheaper Moroccan product.
PART VIII: CONFIRMED CATALYSTS — EVENTS ALREADY IN MOTION
A catalyst, in this context, is not a forecast or a hope. It is a confirmed event that is already in motion and that structurally tightens either the supply side or the demand side of the phosphate and potash market — increasing the net margin per tonne that flows to the owners of certified reserves.
Catalyst 1: Belarusian and Russian Supply Constrained by Sanctions — Structural, Not Cyclical
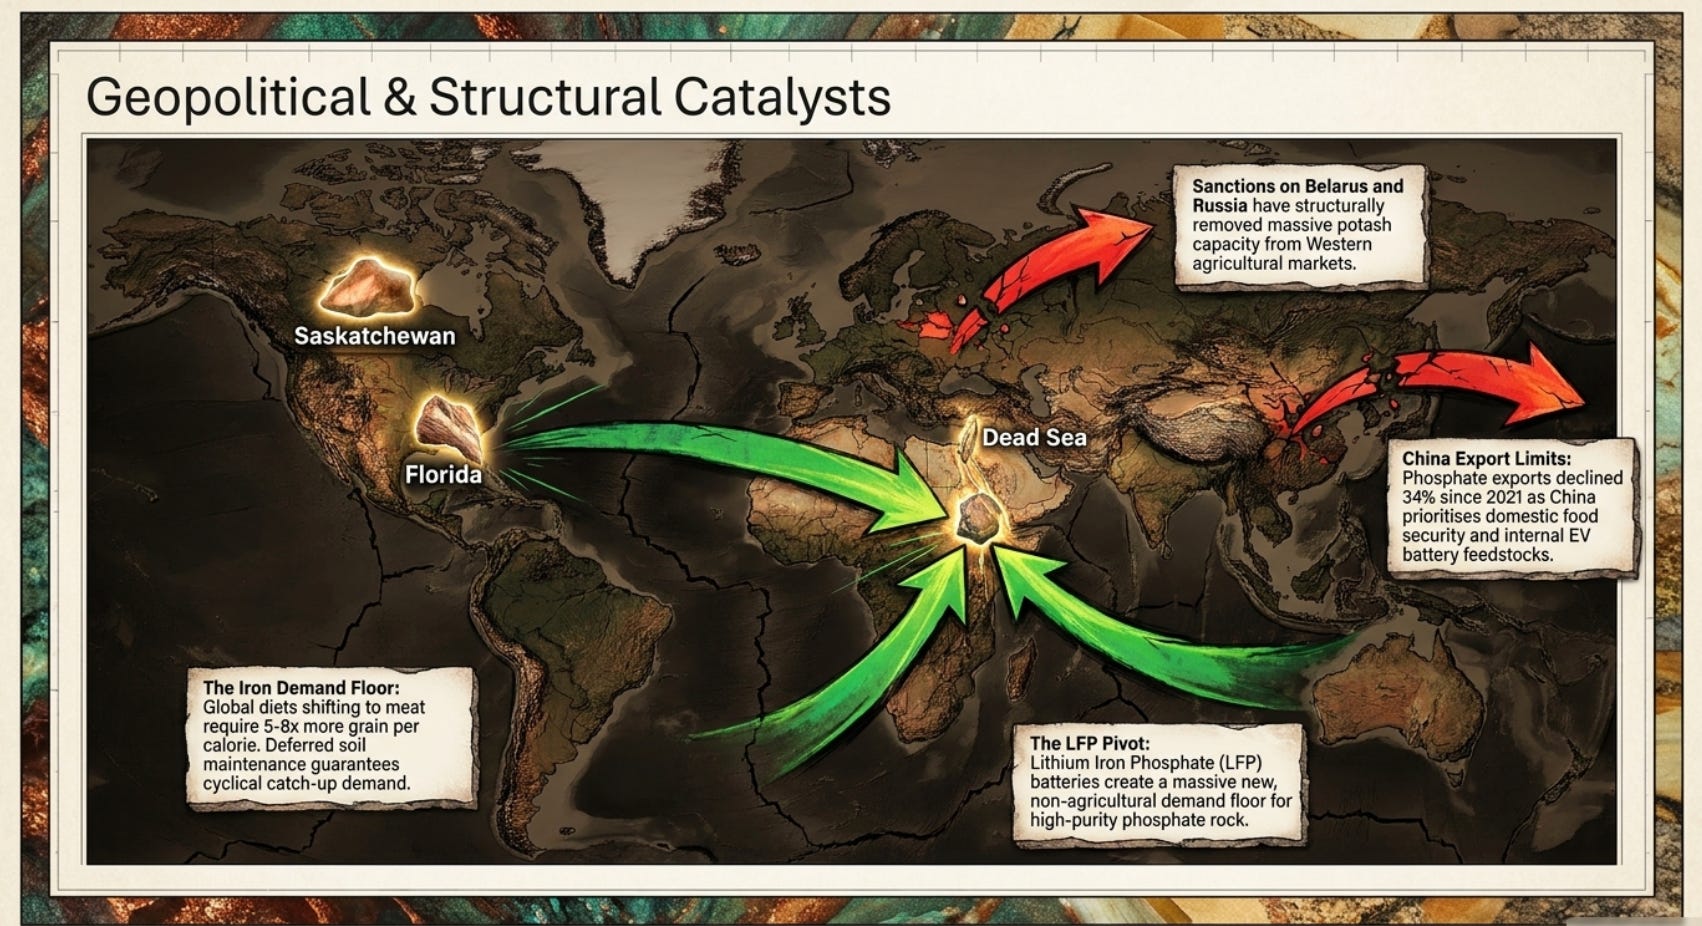
Belarus is the world’s third-largest potash producer by historical capacity, with Belaruskali controlling roughly 15–17% of global production capacity. Russia’s Uralkali and EuroChem collectively control another 20%+ of global capacity. Since the onset of European and US sanctions on Belarus following 2021’s disputed election crackdown, and since expanded sanctions on Russia following the February 2022 invasion of Ukraine, the ability of Belarusian and Russian potash to reach Western markets has been structurally constrained.
This is not a short-term disruption. Sanctions on Belarus are embedded in the political positions of the EU, UK, and US. The Lukashenko government shows no signs of changing its political alignment or behavior that might lead to sanctions relief. Russian sanctions are contingent on a geopolitical resolution to the Ukraine conflict that is unpredictable in timing and outcome. For Western agricultural markets — Europe and North America — the effective removal of Belarusian and Russian supply from the accessible supply pool is a permanent structural shift until geopolitical conditions change, and geopolitical conditions are moving slowly in the wrong direction for Minsk and Moscow.
The beneficiaries are the companies holding Western-controlled, sanctions-immune potash reserves: Nutrien in Saskatchewan, Mosaic at Esterhazy, and ICL Group at Dead Sea and Spain. Every tonne of potash demand that previously came from Belarusian or Russian supply and now must come from Western sources directly increases the utilization rate and pricing power of Esterhazy, Dead Sea Works, and Iberia mines. This is not a forecast. It is current market reality.
Catalyst 2: China’s Phosphate Export Restrictions — Tightening Global Supply
China is the world’s largest producer of phosphate fertilizers by volume, historically exporting approximately 9–10 million metric tonnes of ammoniated phosphates per year (DAP and MAP). Since spring 2021, China has intermittently restricted phosphate fertilizer exports, citing domestic food security concerns. In 2024, Chinese phosphate exports declined to approximately 6.6 million metric tonnes, per IFPRI data — a 34% reduction from the 2021 volume. These restrictions have been implemented unilaterally and without advance notice to global markets.
The second driver of Chinese export restriction is less discussed but structurally more important for the long term: the rapid growth of domestic Chinese demand for phosphate rock as a feedstock for lithium iron phosphate (LFP) battery cathode materials for electric vehicles. LFP batteries require high-purity iron phosphate as a key input, and China — which manufactures the vast majority of the world’s LFP batteries — is consuming increasing quantities of domestic phosphate rock to feed this industrial demand. Domestic industrial demand for phosphate competes directly with export supply. As Chinese EV production scales up, the domestic consumption of phosphate rock for non-agricultural purposes will increase, further constraining the export volume available for global agricultural markets.
This catalyst is already active. It is also self-reinforcing: as Chinese exports decline, global phosphate prices rise, which makes Mosaic’s Florida operations and ICL Rotem’s Negev Desert operations more valuable, because they are producing into a tighter market. The reserves in the ground are worth more per tonne when global supply is constrained and their marginal revenue increases.
Catalyst 3: Growing Population, Dietary Transition, and the Iron Demand Floor
Global population is expected to reach approximately 9.7 billion by 2050, per the UN World Population Prospects. The caloric demand associated with feeding this population, particularly as Asian and African living standards rise and diets shift toward higher protein consumption (which requires 5–8x the agricultural land per calorie compared to grain-based diets), translates directly into demand for fertilizer.
The International Fertilizer Association (IFA) in its November 2024 report noted a downward revision of near-term phosphate demand growth to account for affordability constraints — some farmers in price-sensitive developing markets cut application rates when prices are high. But the same report acknowledged that structural underuse of fertilizers in sub-Saharan Africa, Southeast Asia, and South Asia means that long-term demand growth is not constrained by soil saturation — it is constrained only by affordability, which is a temporary cycle, not a structural ceiling.
When affordability recovers — which it does at every price cycle — deferred fertilizer applications come back as catch-up demand, often concentrating in a single agricultural season. The farmers who skipped a phosphate application in 2023 due to high prices will have measurably lower soil phosphorus levels in 2024–2025, requiring larger-than-normal applications to restore productivity. This deferred demand effect is not captured in any quarterly earnings model. It is the background physics of soil chemistry, operating on a longer timescale than any analyst’s price forecast.
Catalyst 4: LFP Battery Demand Creating a New, Non-Agricultural Market for Phosphate
ICL Group has been pursuing a strategic pivot that, if successful, would create a second demand base for its phosphate chemical assets that is entirely disconnected from agricultural markets: lithium iron phosphate (LFP) cathode active materials for electric vehicle batteries.
LFP batteries are structurally simpler, cheaper, and more thermally stable than nickel-manganese-cobalt (NMC) batteries, making them preferred for lower-cost EVs and stationary energy storage. Their one disadvantage — lower energy density — is acceptable for short-range vehicles and fixed storage applications, and ongoing cell chemistry improvements are reducing this gap. LFP battery demand is growing rapidly, and LFP requires high-purity iron phosphate as a core input.
ICL had begun constructing a facility in St. Louis, Missouri to produce LFP cathode active materials — having received a US Department of Energy loan guarantee commitment for approximately $380 million. The project was cancelled in October 2025 after the Trump administration rescinded the federal funding commitment as part of broader cuts to green energy subsidies. A parallel European JV with Chinese partner Dynanonic was also restructured.
The LFP pivot represents a technology catalyst with uncertain near-term execution risk but confirmed long-term structural logic: a company that mines phosphate and has spent decades developing high-purity phosphate chemistry has a natural advantage in producing the downstream phosphate chemicals required for battery manufacturing. The value of ICL’s phosphate mining infrastructure is higher if it can serve both agricultural and industrial demand than if it serves only agriculture. The exact timing of this realization depends on battery market economics, policy certainty, and execution — which is why this catalyst carries more conditionality than the geopolitical supply catalysts above.
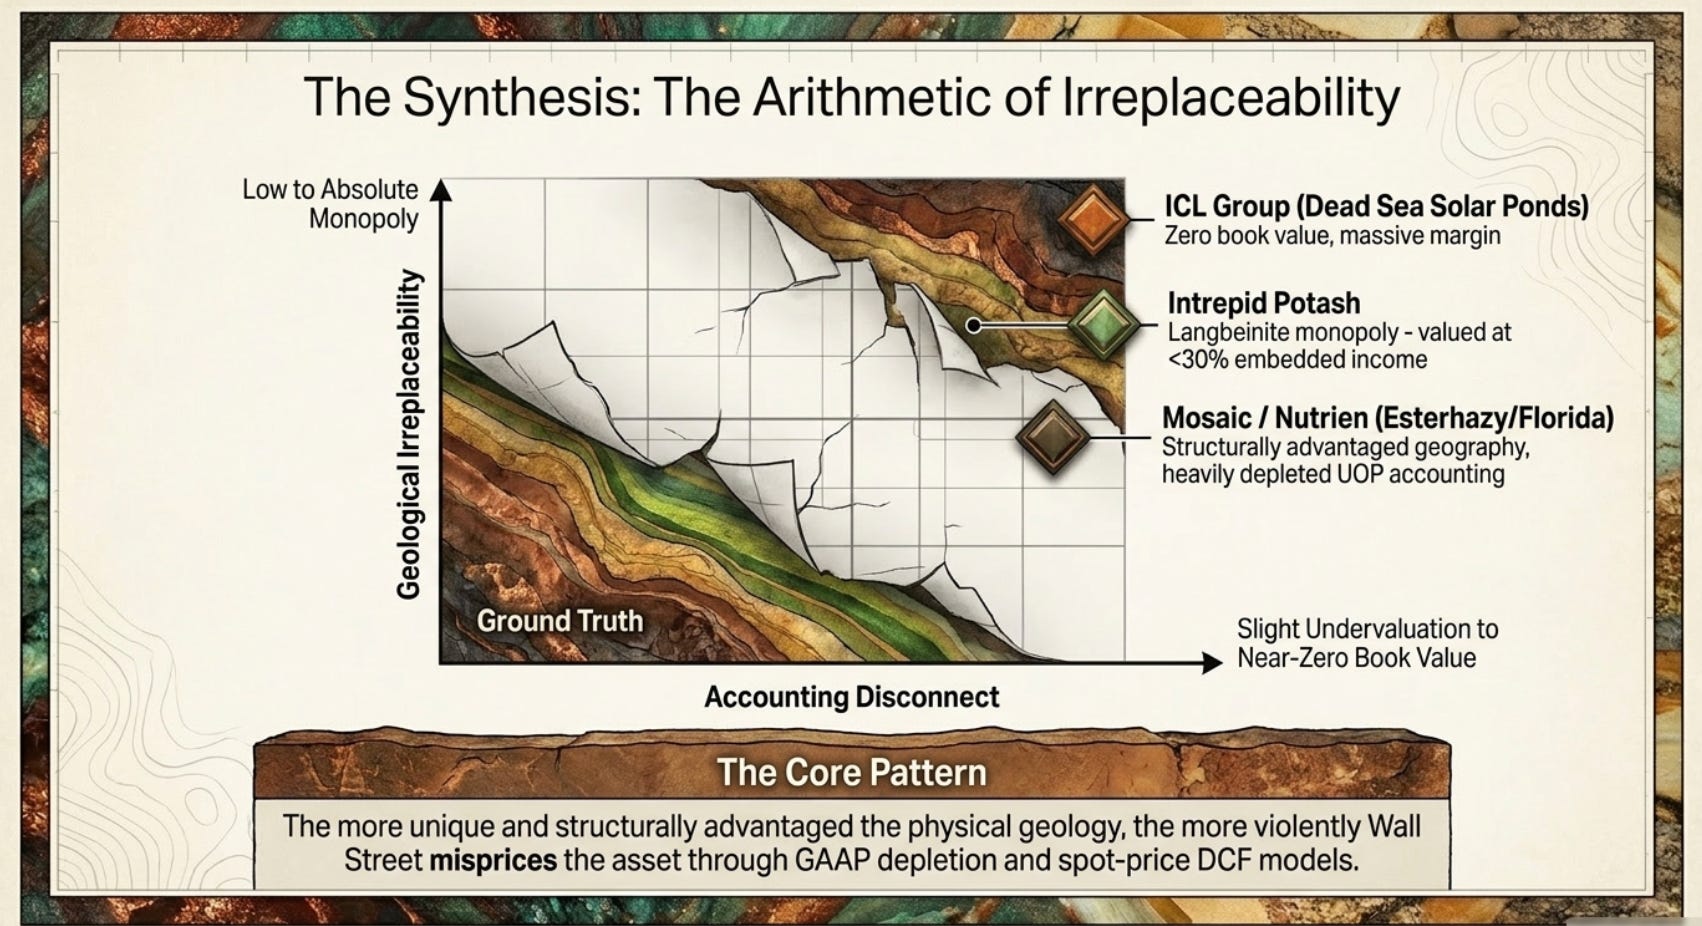
CONCLUSION: THE ARITHMETIC OF IRREPLACEABILITY
The core insight of this paper is simple enough to state in two sentences.
Phosphorus and potassium must be mined. The companies that own the best mines in the best locations — Florida, Saskatchewan, the Dead Sea, the Negev Desert — own assets that are certified in tonnes by geological engineers, that produce measurable margins at today’s prices, that have decades of remaining reserve life, and that cannot be replicated by any competitor at any capital budget within any commercially relevant timeframe.
GAAP records these assets at what someone paid for them 20 years ago, minus accumulated depletion. The assets have not declined in economic value since then. In most cases, they have increased in value, because the commodity prices they produce have risen and the scarcity of equivalent replacement assets has increased. The gap between the balance sheet’s answer and the owner’s answer is not an artifact of market irrationality. It is a systematic consequence of an accounting standard designed to track historical cost, applied to an asset whose value is determined by current geology and current commodity economics — neither of which has any relationship to what someone paid in 2004.
The earnings will fluctuate. They always do in commodity businesses. The ore body will not. And the ore body — irreplaceable, certified, producing positive margins at today’s prices — is what you are actually buying.
This white paper is for educational and informational purposes only. All reserve figures, cost data, transaction prices, and market statistics are drawn from publicly available company annual reports (10-Ks, 20-Fs), SEC filings, regulatory submissions, USGS mineral commodity summaries, World Bank commodity data, and industry sources as cited throughout. Nothing herein constitutes investment advice.
If you like this read, check out my other writings 👇
Rust, Rigs, and the Recurring Revenue Hidden in Plain Sight: A Deep Dive into Beng Kuang Marine (SGX: BEZ)

The Old Steel and the Sea: Why You Should Care About a Ship Maintenance Company
Investment Reflection #2 — The Grand Play: 100 Years of the World’s Nations as Characters in the Greatest Story Ever Told

“The world is not a chessboard. It is a living organism, where every cell — every nation — eats, competes, cooperates, and occasionally tries to eat the others. Understanding it requires not just memorizing moves, but understanding hunger.”

The Tide Is Going Out: Commodity Houses, Private Credit, and the AI Debt Bomb

Start Here: What This Article Is About
Why I Passed on Graftech (EAF): Riding The Battery Hype, Or Perhaps Not...

There is a kind of company that is the most dangerous thing in investing. It is not the fraudulent company. It is not the obviously bad company with terrible products and incompetent management. Those are easy — you just avoid them. The truly dangerous company is the one with a
The Beautiful Trap: Why I'm Passing on The Hour Glass (SGX: AGS)

There’s a peculiar kind of investment that keeps you up at night — not because it’s bad, but because it’s genuinely good. Good enough to admire. Not good enough to buy.
The Diamond in the Rough That Isn't Quite Yours: Why I Passed on Boustead (SGX: F9D)

There is an old saying that investors have borrowed, bent, and quoted so many times it has nearly lost its sharpness: a bird in the hand is worth two in the bush. Warren Buffett, characteristically, gave it a precise mathematical form. The value of any investment, he wrote, is determined by three questions:
The Schoolteacher's Secret Insurer: Why Horace Mann (NYSE:HMN) Is Sitting on My Watchlist

“The stock market is a device for transferring money from the impatient to the patient.” — Warren Buffett

The Dormitory King That Couldn't Leave Home: Why I Passed on Centurion (SGX: OU8)

There is a deceptively simple question that Warren Buffett borrowed from Aesop’s ancient fable, and has repeated across decades of shareholder letters: “How many birds are in the bush? How sure are you they’re there? And how long until you get them out?”
The Children's Place: A $90 Million Bet on a Company That Used to Be Worth $2 Billion (NYSE: PLCE)

There is a classic scene in every heist movie. The detective walks into a room, sees the chalk outline, the scattered evidence, the broken window, and immediately knows something went terribly wrong long before anyone called the police. You do not need the full autopsy report to read the body.
World War 3 In Iran and Why Oil Price Will Continue Increasing — It Arrived Sooner Than Anyone Expected

This is Part 2 of a continuing analysis of California Resources Corp (CRC). Part 1 built the foundational investment case: a company trading at $44 per share against a conservative intrinsic value of $108–$156, built on 567 million barrels of proved developed oil reserves in California, and a management team spending hundreds of millions buying back its…
The Most Overlooked Oil Company in America — And Why That Might Be the Opportunity of the Decade

Date of analysis: 28 December 2025
The Art Of Saying No - MYPS: Playstudios Inc

PLAYSTUDIOS (MYPS) is a Las Vegas-based mobile gaming company that operates free-to-play social casino games and a loyalty platform called playAWARDS, which lets players redeem points for real-world rewards at places like MGM Resorts, Norwegian Cruise Line, and Wolfgang Puck restaurants. On the surface, this sounds like a clever moat. A loyalty program.…
The Art Of Saying No - UGP: Ultrapar Participacoes S.A (Part 2 of 2)

Question 2: How Certain Are You?
The Art Of Saying No - GLIBK: GCI Liberty Inc

Picture this: a single telecommunications company — the dominant one — serves over 200 communities scattered across the largest state in the United States. Alaska. A state with just over one person per square mile. A state where 39% of residents are underserved by broadband. A state where, until recently, some villages received internet via satellite li…

The Art Of Saying No - UGP: Ultrapar Participacoes S.A (Part 1 of 2)

The Setup: A Value Investor Dream?


The Art of Saying No - RIG: Transocean LTD

“The difference between successful people and really successful people is that really successful people say no to almost everything.” — Warren Buffett
The Art of Saying No - KPRX: Kiora Pharmaceuticals Inc

“The difference between successful people and really successful people is that really successful people say no to almost everything.” — Warren Buffett
The Art of Saying No - DNUT: Krispy Kreme Inc

“The difference between successful people and really successful people is that really successful people say no to almost everything.” — Warren Buffett

🎓 A Business Strategy Primer Part 7 - Learning From Great Companies

The Billion-Dollar Playbook: How Market-Based Management Powered Koch Industries’ Unstoppable Rise
The Art of Saying No - MRX: Marex Group PLC

“The difference between successful people and really successful people is that really successful people say no to almost everything.” — Warren Buffett


The Art of Saying No - SFIX: Stitch Fix Inc

“The difference between successful people and really successful people is that really successful people say no to almost everything.” — Warren Buffett
🎓 A Business Strategy Primer Part 2 - Brainstorming Solutions With Value At The Core

Creating An Irresistible Offer
The Art of Saying No - TDOC: Teladoc Health Inc

“The difference between successful people and really successful people is that really successful people say no to almost everything.” — Warren Buffett

The Art of Saying No - MDU: Mdu Resources Group Inc

“The difference between successful people and really successful people is that really successful people say no to almost everything.” — Warren Buffett


The Art of Saying No - AFCG: Advanced Flower Capital Inc

“The difference between successful people and really successful people is that really successful people say no to almost everything.” — Warren Buffett
The Art Of Saying No - VYX: NCR Voyix Corp

“The difference between successful people and really successful people is that really successful people say no to almost everything.” — Warren Buffett
The Art of Saying No - VSTS: Vestis Corp

“The difference between successful people and really successful people is that really successful people say no to almost everything.” — Warren Buffett

🛢️Basic Energy Primer Part 2 - Business and Competitive Landscape

The Man Who Bet Everything on Being Wrong
The Art of Saying No - CISS: C3is Inc

“The difference between successful people and really successful people is that really successful people say no to almost everything.” — Warren Buffett
The Art of Saying No - PSHG: Performance Shipping Inc

“The difference between successful people and really successful people is that really successful people say no to almost everything.” — Warren Buffett

The Art Of Saying No - MAGN: Magnera Corp

The Magnera Corporation Analysis Nobody Asked For (But Everyone Needs)
The Art of Saying No - CHR: Cheer Holding Inc

“The difference between successful people and really successful people is that really successful people say no to almost everything.” — Warren Buffett
The Art of Saying No - WIMI: WiMi Hologram Cloud Inc.

“The difference between successful people and really successful people is that really successful people say no to almost everything.” — Warren Buffett
⚡️Alternative Energy Primer Part 3 - Industry and Sector Technicals

The €2.2 Billion Mistake That Revealed Everything
⚡️Alternative Energy Primer Part 2 - Business & Competitive Landscape

The Shipwreck That Changed Everything

🏥 A U.S. Health Insurance (Managed Care Organizations) Sector Primer

1️⃣ Industry Fundamentals & Macro View

