
PART I: WHAT A STEEL DISTRIBUTOR ACTUALLY DOES, AND WHY THE INVENTORY IS EVERYTHING
The Middleman with the Warehouse
To understand why steel distributors’ inventory is so consequential, you need to understand what these companies actually do — because it is not glamorous, and the business model is not complicated, which is precisely why the accounting distortion within it is so easy to miss.
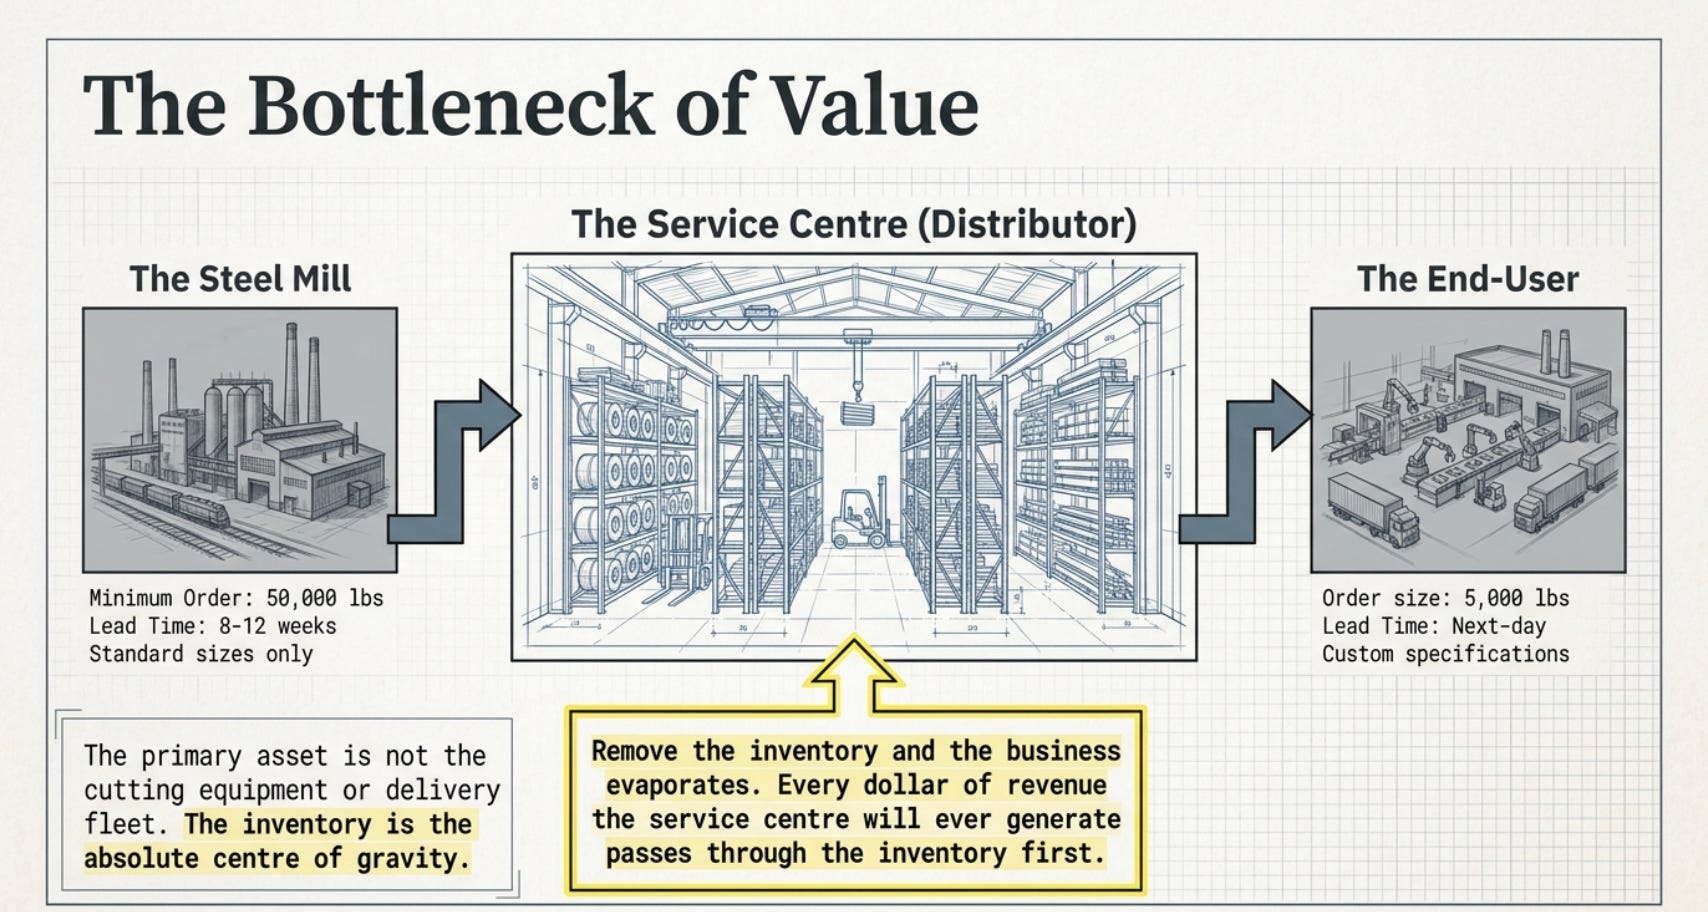
A steel service centre — companies like Ryerson Holding Corporation, Olympic Steel, Metals USA, or the smaller pure-plays like Worthington Steel and Friedman Industries — sits between the steel mills and the industrial end-users. The mills produce steel in enormous quantities: hot-rolled coil, cold-rolled sheet, galvanised steel, structural beams, plate, and tube. They sell in large minimum order quantities, often measured in railcar or truckload lots. A manufacturer that needs 5,000 pounds of stainless steel sheet in a specific gauge and finish does not buy directly from the mill. The mill’s minimum order might be 50,000 pounds, its lead time might be eight to twelve weeks, and its products come in standard sizes that may not match the manufacturer’s specifications.
The service centre solves this problem. It buys large quantities from the mill at prevailing market prices, warehouses the material, and resells it in smaller quantities, to tighter specifications, with shorter lead times, to thousands of customers across automotive, construction, manufacturing, and energy industries. It earns a spread — a margin between what it paid the mill and what it charges the customer. This spread is not fixed. It fluctuates with steel prices, with supply-demand dynamics at the mill level, and with competitive pressure from other distributors and from direct mill sales.
The primary asset of this business is not the warehouse. It is not the cutting equipment or the delivery fleet. It is the inventory — the steel sitting on the racks and coil cradles in the warehouse, purchased at some point in the past and held until a customer needs it. The inventory is what allows the distributor to promise next-day delivery on a 500-pound order. It is what justifies the service centre’s existence as a business. Remove the inventory and the business evaporates. Every dollar of revenue the service centre will ever generate passes through the inventory first.
This makes the valuation of inventory the single most important question in assessing what a steel distribution business is worth. And this is precisely where the accounting system introduces a gap between what the balance sheet says and what the business is actually worth.
PART II: LIFO — THE ACCOUNTING ELECTION THAT CHANGED EVERYTHING
How a Tax Decision Became an Information Crisis
The Last-In, First-Out (LIFO) inventory accounting method was not designed to obscure asset values. It was designed to be economically sensible from a tax perspective in inflationary environments. The logic is straightforward: if prices are rising, the most recently purchased inventory is the most expensive. Under LIFO, when you sell a unit of inventory, you match the sale revenue against the cost of the most recently purchased inventory — the highest cost. This reduces reported gross profit in an inflationary period, which reduces taxable income, which reduces taxes owed. For a steel distributor operating during the extended inflationary period of the 1960s and 1970s, this was an extremely attractive feature. Hundreds of US companies adopted LIFO and have never switched back, because switching would create an enormous tax liability from the recognition of the accumulated LIFO reserve.
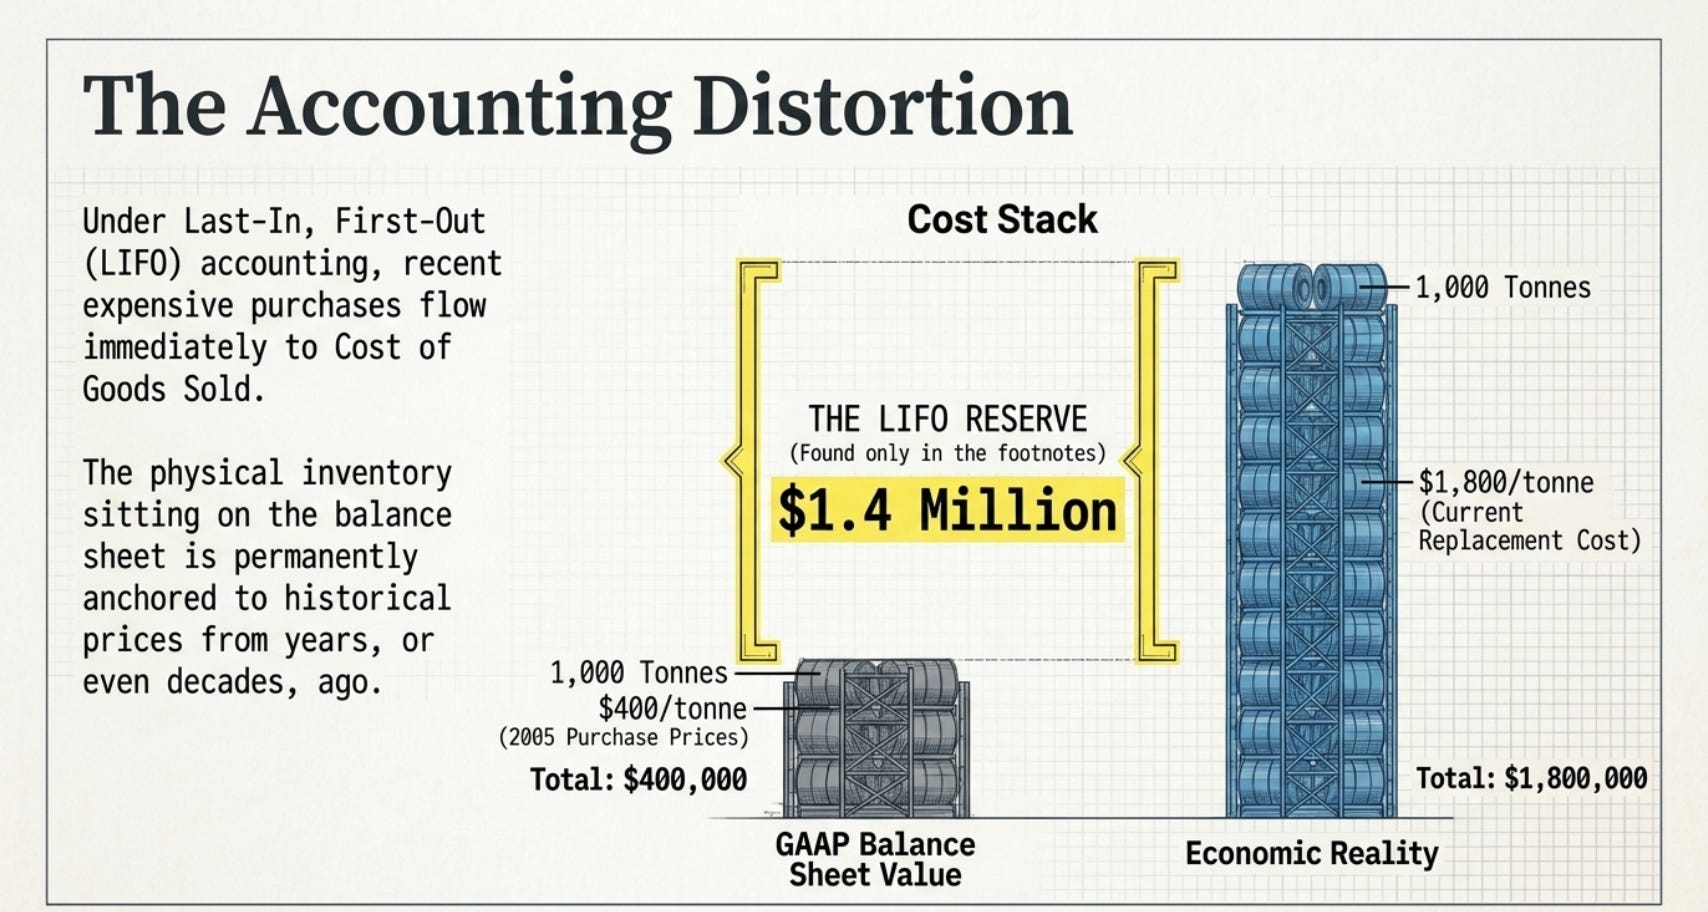
The accounting consequence of LIFO, however, is one that most financial analysts do not fully internalise. In an inflationary environment, LIFO means that the inventory sitting on the balance sheet is valued at the oldest, cheapest cost layers. Recent purchases — at higher current prices — flow through to Cost of Goods Sold immediately. Old purchases — at lower historical prices — accumulate in the balance sheet as the residual “unsold” inventory. This residual is called the LIFO base stock. Over decades of inflation, the LIFO base stock can be valued at prices from the 1970s, 1980s, or 1990s, depending on when the company established its inventory position.
The difference between what the inventory is worth today at current replacement cost and what LIFO shows on the balance sheet is the LIFO Reserve — a number that every US LIFO company is required to disclose in the notes to its financial statements. It is not hidden. It is disclosed. It is just in a footnote, expressed in a way that most investors ignore or misunderstand.
The Mechanics of the Gap: An Actual Story
Imagine you run a steel service centre and you bought 1,000 tonnes of hot-rolled coil steel in 2005 for $400 per tonne. You still have that steel on your books. Under LIFO, that 1,000 tonnes appears on your balance sheet at $400/tonne — $400,000 in inventory value. But it is now 2022, and hot-rolled coil steel is trading at $1,800 per tonne (which it actually did in mid-2021, briefly reaching that level). The replacement cost of your 1,000 tonnes is $1.8 million. The balance sheet says $400,000. The LIFO reserve for that tonnage is $1.4 million — the gap between what the inventory is worth and what the balance sheet says it is worth.
A business owner buying this distribution company asks: what is the inventory worth? The answer is $1.8 million. The company can sell those 1,000 tonnes tomorrow at $1,800/tonne. That is what they are worth. The GAAP balance sheet says $400,000. The footnote — buried in Note 4 or Note 6 of the financial statements — discloses the LIFO reserve and allows you to reconstruct the true inventory value. But you have to look for it.
This is the gap. It is systematic. It is structural. It is not an error or an anomaly. It is a predictable consequence of an accounting election that hundreds of US companies made decades ago and have maintained ever since, because the alternative — switching to FIFO and recognising the accumulated LIFO reserve as income — would trigger a tax bill that could exceed the company’s annual earnings for several years running.
PART III: THE NUMBERS, FROM ACTUAL FILINGS
Ryerson: The $245 Million Footnote in 2022
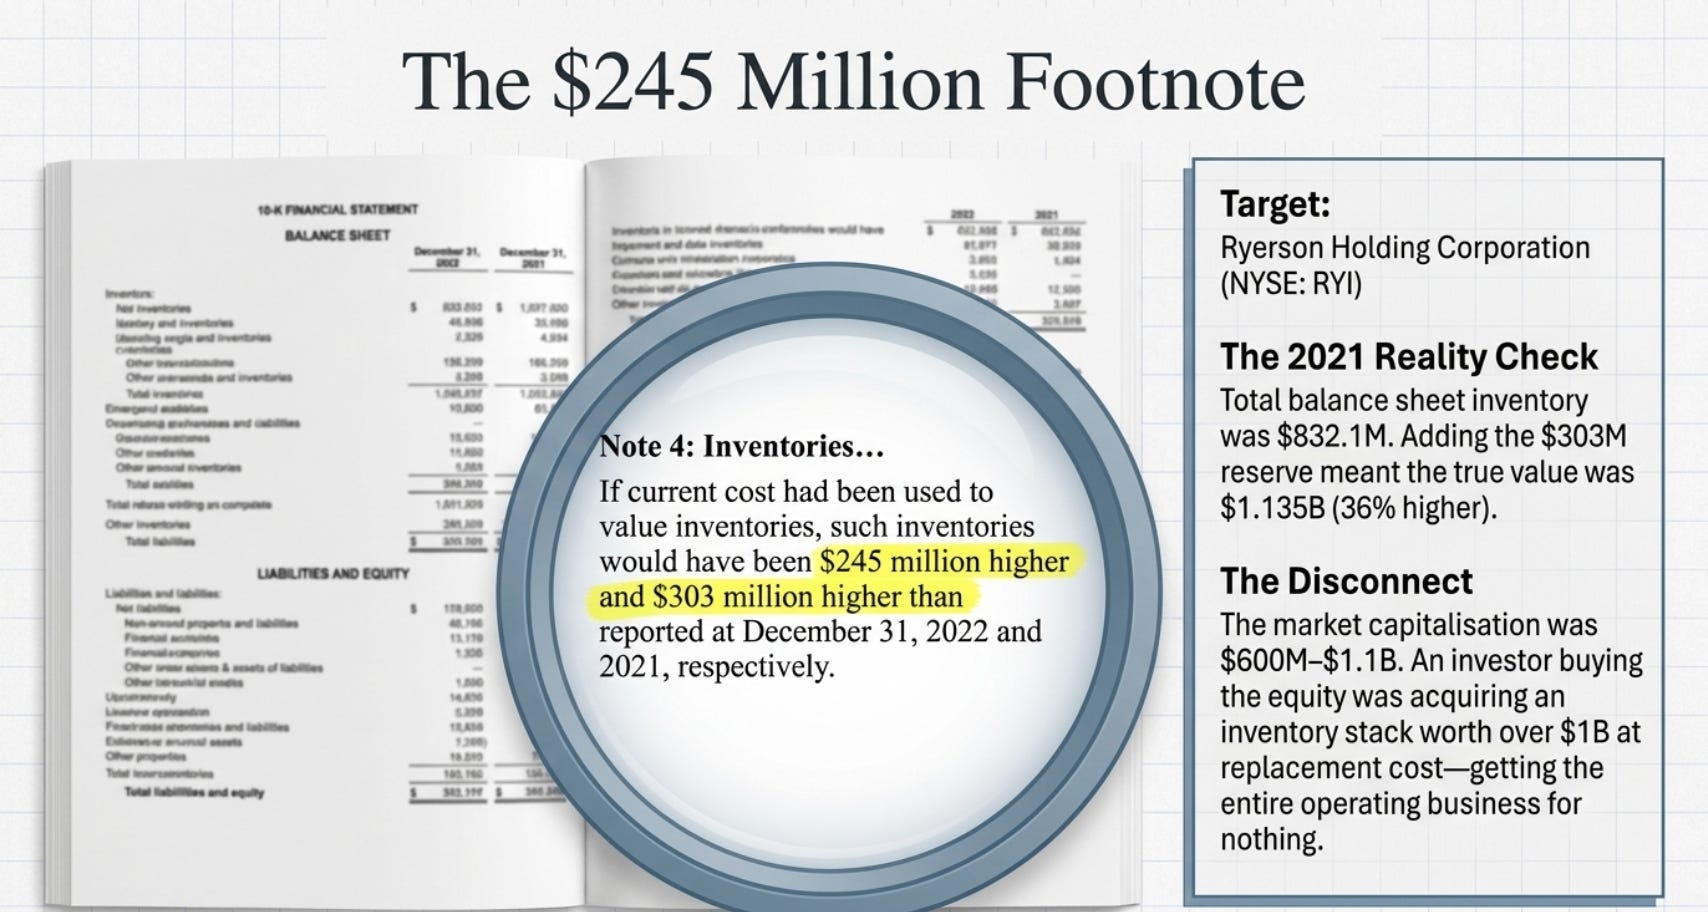
Ryerson Holding Corporation (NYSE: RYI) is one of the largest steel and metals service centres in North America, with approximately $5.1 billion in revenue in 2023. In its December 31, 2022 10-K filing, Ryerson disclosed the following in Note 4 (Inventories): “If current cost had been used to value inventories, such inventories would have been $245 million higher and $303 million higher than reported at December 31, 2022 and 2021, respectively.”
Read that again carefully. The inventory sitting in Ryerson’s warehouses on December 31, 2022 — steel that would be sold to customers in the following weeks and months — was worth $245 million more at current replacement cost than what appeared on the balance sheet. Not in 20 years. Not after a series of favourable business developments. Today, at prices already established in the market. The inventory had already been purchased. It was sitting in the warehouse. A buyer could walk in and offer to buy it at current market prices and receive $245 million more than the balance sheet suggested it was worth.
In 2021, the gap was even larger at $303 million. Ryerson’s total inventory on the balance sheet at year-end 2021 was $832.1 million. Adding back $303 million means the inventory was actually worth approximately $1.135 billion — 36% more than the balance sheet showed.
Ryerson’s market capitalisation during much of 2022 ranged from approximately $600 million to $1.1 billion. At the lower end of that range, an investor buying all of Ryerson’s equity was paying $600 million for a business whose inventory alone — the primary working asset — was worth over $1 billion at replacement cost. The equity below the inventory. This is not a forecast. This is what the 10-K disclosed.
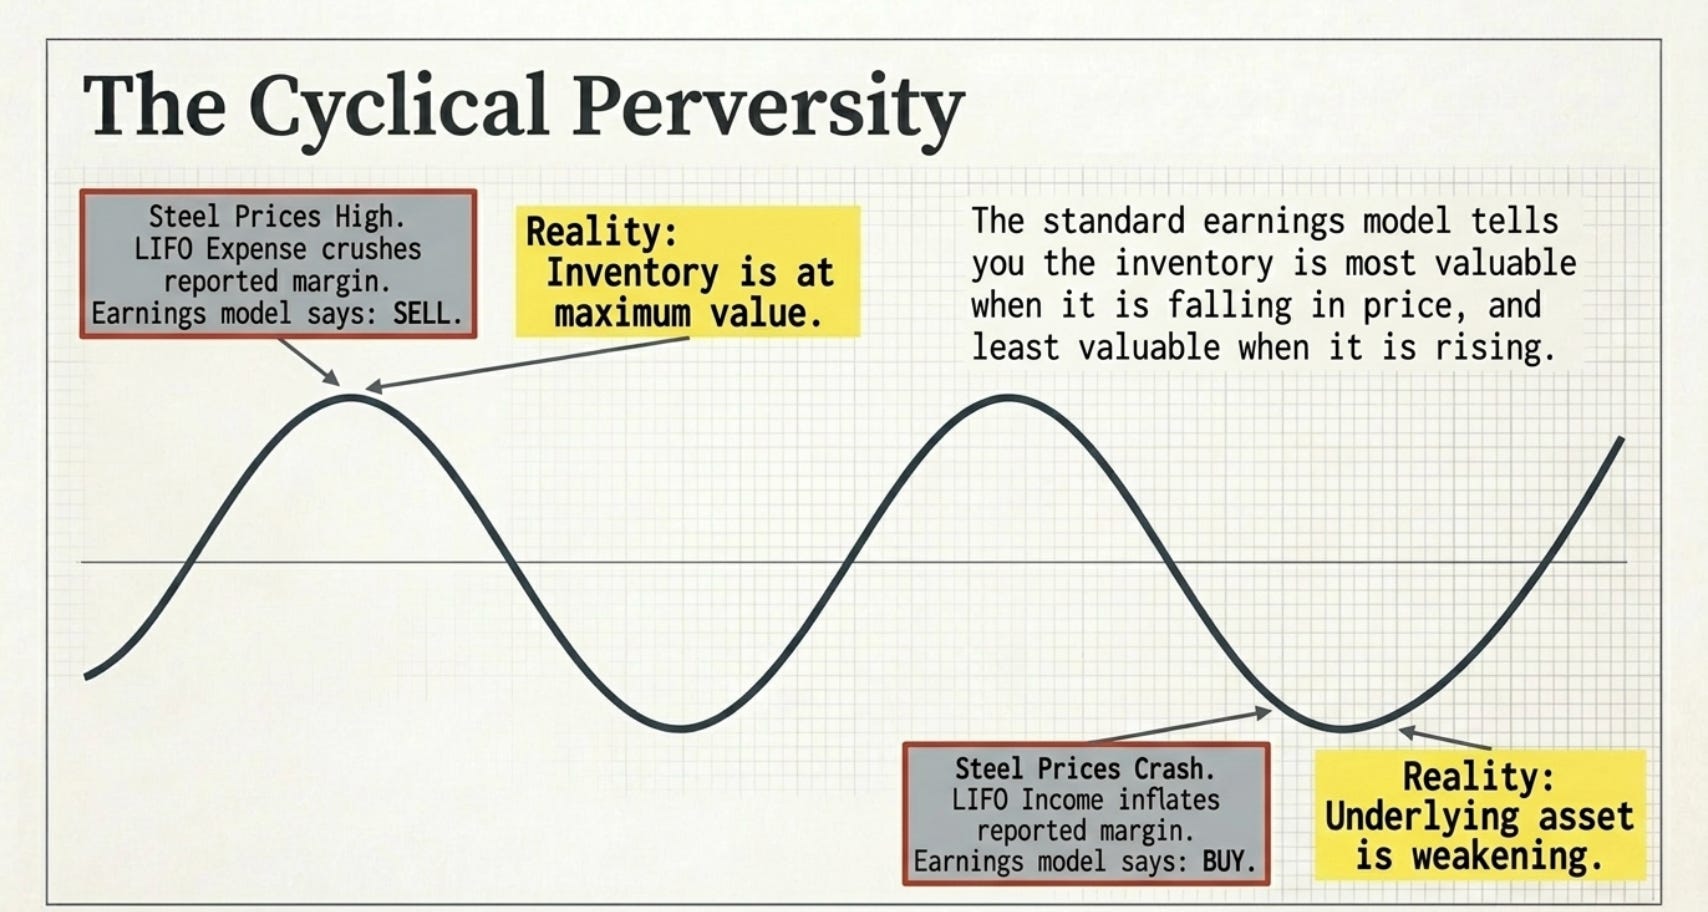
During the same period, Ryerson’s reported gross margin was being crushed by LIFO expense. In Q4 2021, Ryerson reported LIFO expense of $76 million — meaning $76 million of cost that in economic reality did not exist (no cash left the company, no inventory was lost) flowed through the income statement and reduced reported earnings. Analysts looking at the earnings model saw compressed margins and reduced their price targets. The inventory footnote told a completely different story: the inventory was appreciating, not depreciating. The earnings model was penalising the company for owning more valuable inventory than the LIFO method acknowledged.
The Wild Swing Back: Q4 2023
The opposite phenomenon appeared in Q4 2023. Ryerson disclosed LIFO income of $59.3 million in that quarter. Steel prices had declined from their 2022 peaks, meaning the cost of recently purchased inventory had fallen below the cost of older inventory layers on the books. Under LIFO mechanics, when prices fall, the recent cheap purchases flow through to Cost of Goods Sold, while the older expensive layers remain on the balance sheet. This generates LIFO income — a non-cash accounting gain that inflates reported earnings without any economic benefit.
Analysts who anchored to the earnings number saw improving results. The earnings model showed strong gross margins in Q4 2023. The inventory footnote told the counterpoint: the LIFO reserve had shrunk because inventory replacement cost had fallen, meaning the inventory was worth less in absolute terms than it had been in 2022. The earnings model was flattering the company at exactly the moment the underlying asset was weakening.
This is the pattern that repeats across every steel price cycle and every steel distributor on the LIFO system: earnings are systematically overstated when prices are falling (LIFO income artificially inflates margins) and systematically understated when prices are rising (LIFO expense artificially compresses margins). The earnings model is exactly backwards as a predictor of inventory value — it tells you the inventory is most valuable when it is falling in price, and least valuable when it is rising.
Nucor: The $1.1 Billion You Cannot See on the Balance Sheet
Nucor Corporation (NYSE: NUE) is the largest steel manufacturer in the United States and also operates steel distribution and fabrication businesses through its various subsidiaries. In its 2022 annual report, Nucor disclosed a LIFO reserve of approximately $1.1 billion. This single footnote item means that Nucor’s inventory — as disclosed on the face of the balance sheet — was understated by $1.1 billion relative to current replacement cost.
Tax-effect this at the current US corporate rate of 21%: the after-tax impact on net asset value is approximately $869 million. This is not an estimate. It is the disclosed difference between LIFO-stated inventory and FIFO replacement cost, adjusted for the tax liability that would be triggered if the LIFO reserve were recognised as income. An analyst computing Nucor’s Price-to-Book ratio using reported book value is comparing market price to a book value that is approximately $869 million lower than the economically correct figure.
The perversity of this becomes clear when you run through the cycle. In 2020, when steel prices were depressed by COVID-related demand destruction, Nucor’s LIFO reserve was much smaller — perhaps a few hundred million dollars. Reported book value looked relatively high relative to economic book value. The P/B ratio looked lower, suggesting the stock was relatively cheap by that metric. But the inventory was less valuable in economic terms. In 2021 and 2022, when steel prices surged to multi-year highs, the LIFO reserve expanded dramatically — meaning the inventory became dramatically more valuable. But reported book value grew slowly because the LIFO reserve was not recognised. The P/B ratio looked higher, suggesting the stock was more expensive. But the inventory was more valuable in economic terms. The metric pointed precisely the wrong direction, at precisely the wrong time, every time.
PART IV: THE MARKET’S TOOLS AND WHY THEY FAIL HERE
What Happens When the Analyst Runs the Earnings Model
The standard sell-side approach to a steel distributor is built around revenue per tonne, gross margin per tonne, operating expense per tonne, and an earnings multiple. The analyst models the steel price, estimates volumes, calculates spread, subtracts operating costs, arrives at EBITDA, applies a multiple, and produces a price target. This model has three structural problems when applied to a LIFO company in a volatile steel price environment.
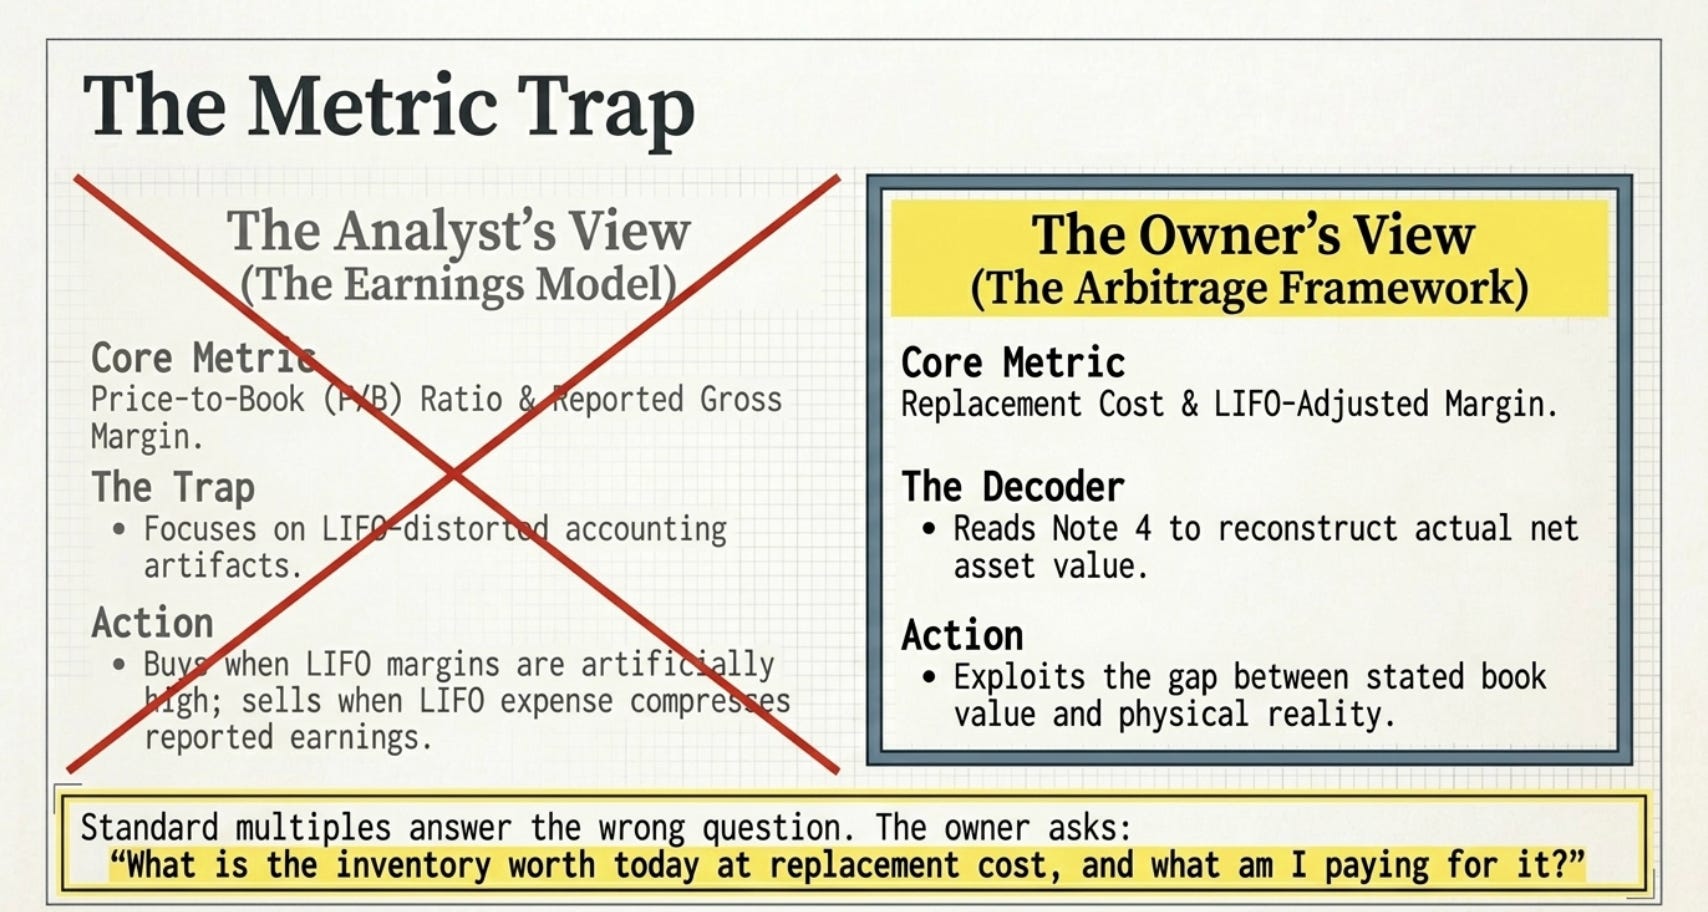
The first problem is that LIFO expense and income make reported gross margin a particularly unreliable indicator of underlying business performance. When Ryerson reported $76 million of LIFO expense in a single quarter, its gross margin looked terrible by historical standards. But the gross margin, excluding LIFO, was actually quite healthy — Ryerson disclosed its EBITDA excluding LIFO explicitly because management understood that the LIFO-adjusted earnings figure was the economically meaningful one. Analysts who used reported gross margin were measuring an accounting artifact, not a business outcome. The inventory was getting more valuable. The spread between purchase price and sale price — the actual economics of the business — was widening. The earnings model said the opposite.
The second problem is that the P/B ratio, which investors use as a valuation shortcut for asset-heavy businesses, is calculated on a LIFO-stated book value that systematically understates the value of the primary asset. When steel prices are high and inventory is most valuable, the LIFO reserve is largest, book value is most understated, and P/B looks most expensive. When steel prices are low and inventory is least valuable, the LIFO reserve is smallest, book value is least understated, and P/B looks cheapest. The ratio signals the market to buy when the inventory is cheapest and sell when the inventory is most valuable — exactly the reverse of what an asset-value-oriented investor should do.
The third problem is that none of the standard metrics — P/E, EV/EBITDA, P/B — answer the owner’s question. The owner’s question is not “what is this company earning this quarter?” It is: “what is the inventory worth today at replacement cost, and what am I paying for it?” That question has a concrete, calculable, non-forecasted answer. It requires reading one footnote and doing one subtraction.
PART V: STORIES FROM THE WAREHOUSE — CASE STUDIES IN STEEL DISTRIBUTION VALUE ARBITRAGE
The Reckoning of 2021: When Steel Went Vertical and the Earnings Model Got Lost
The story of the US steel market in 2021 is one of the most dramatic commodity price episodes in recent American industrial history, and it produced the clearest possible illustration of why LIFO accounting hides value precisely when the value is greatest.
In January 2021, US hot-rolled coil steel was priced at approximately $700 to $800 per short ton. By August 2021, the price had reached approximately $1,900 per short ton — a roughly 150% increase in seven months. The causes were multiple and simultaneous: COVID-era fiscal stimulus created massive demand for manufactured goods that consume steel; automotive production disruptions from semiconductor shortages created unusual patterns of mill output; and the large integrated steel mills, having taken production offline in the COVID lockdowns of 2020, were slow to restart capacity. Supply was tight, demand surged, and prices moved in a way the market had not seen in modern memory.
For steel service centres, this environment was economically extraordinary. A company that had purchased hot-rolled coil at $700/tonne in Q4 2020 and was selling it at $1,800/tonne in Q3 2021 was earning margins that would be almost unrecognisable in a normal market. The spread between purchase price and sale price — the distributor’s gross profit — had expanded enormously.
But the earnings model, applied naively, told investors an alarming story. Ryerson’s full-year 2021 LIFO expense was enormous — the company was buying new inventory at $1,800/tonne and flowing that high cost through to Cost of Goods Sold immediately under LIFO, while the older, cheaper inventory layers remained on the balance sheet. Reported gross margins looked compressed relative to what they would have been under FIFO accounting. Ryerson disclosed that on a FIFO basis, diluted earnings per share would have been dramatically higher than the LIFO-reported figure.
Ryerson also disclosed its LIFO reserve grew from $303 million at year-end 2021, compared to a much smaller figure in 2020 — meaning the inventory the company was holding had appreciated by hundreds of millions of dollars in a single year. That appreciation was entirely invisible to an investor looking at the income statement. The inventory line on the balance sheet grew in dollar terms because volumes stayed roughly constant while prices rose, but the LIFO reserve — buried in the footnote — captured the true magnitude of the inventory appreciation.
Investors who read the footnote, added back the LIFO reserve to book value, and compared the adjusted inventory value to Ryerson’s market capitalisation found a company whose primary working asset was worth substantially more than the market was pricing the whole enterprise. They bought. The company’s shares, which had started 2021 at approximately $14 per share, finished the year at approximately $22 per share — not quite capturing the full inventory appreciation, because LIFO accounting continued to suppress reported earnings — but meaningfully up nonetheless. The footnote readers were rewarded. The earnings-model readers were confused.
The lesson: in an inflationary steel price environment, LIFO accounting creates a systematic optical illusion. Reported earnings look worse than economic reality because LIFO expense flows through the income statement. Inventory on the balance sheet looks flat or only modestly higher because the appreciation is captured in the LIFO reserve, not in the stated inventory value. And the LIFO reserve itself grows — in the footnote — representing hundreds of millions of dollars in real, tangible, immediately realisable value that the standard metrics completely miss.
Friedman Industries: The Tiny Company with the Transparent Footnote
Friedman Industries, Inc. (NYSE American: FRD) is a steel processor and service centre headquartered in Longview, Texas, with annual revenues of roughly $500 to $700 million — a fraction the size of Ryerson, and largely ignored by institutional investors and sell-side analysts. This makes it a particularly clean case study, because there is very little Wall Street noise to obscure the underlying inventory arithmetic.
Friedman operates hot-rolled coil processing facilities at several locations in the US South, purchasing coils directly from the mills, slitting and cutting them to customer specifications, and selling flat-rolled steel to manufacturers primarily in the pipe and tube, agricultural equipment, and industrial machinery sectors. The company has used LIFO inventory accounting consistently across its history.
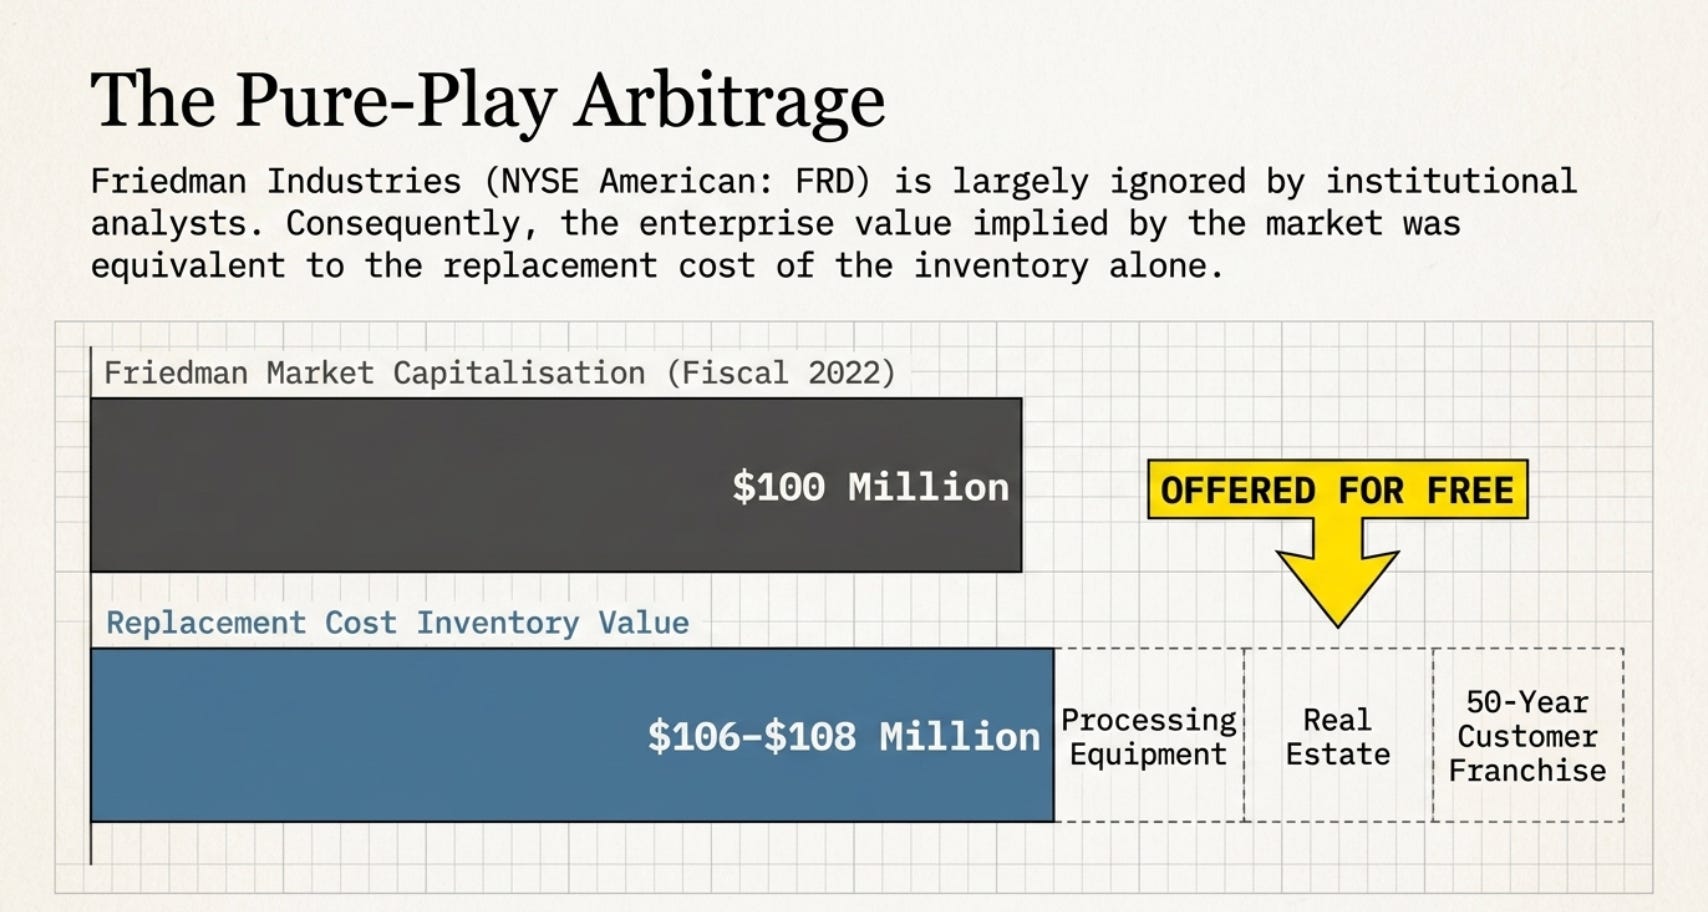
In its fiscal year 2022 annual report (Friedman’s fiscal year ends March 31), the company disclosed steel inventories valued at approximately $78 million under LIFO. The LIFO reserve at fiscal year end 2022 was disclosed in the notes as approximately $28 to $30 million — meaning the inventory was worth approximately $106 to $108 million at current replacement cost, roughly 37% more than the balance sheet showed.
Friedman’s market capitalisation during fiscal 2022 ranged from approximately $100 to $160 million. At the lower end of that range, an investor was paying approximately $100 million for a business whose inventory alone was worth $106 to $108 million at replacement cost, plus processing equipment, accounts receivable, and the operational franchise of a 50-year-old customer relationships with regional manufacturers. The enterprise value implied by the market was, at times, essentially equivalent to the replacement cost of the inventory stack alone — the processing equipment, the real estate, the customer relationships, and the ongoing business operations were being offered for free.
The earnings model was not helpful here. Friedman’s reported earnings in fiscal 2022 were compressed by LIFO expense — the steel price run-up in 2021 had caused large LIFO charges that flowed through the income statement. P/E looked high. P/B looked slightly elevated because book value was understated by the LIFO reserve. EV/EBITDA looked middling. None of the standard metrics communicated what the footnote communicated: this is a business where the inventory alone is worth close to the entire market capitalisation.
What happened next validated the owner’s analysis. As steel prices peaked and inventory turns continued, Friedman generated substantial cash earnings from liquidating high-value inventory that had been purchased at lower prices. The company distributed the profits through a combination of dividends and share buybacks that, over a 24-month period, returned a significant fraction of its market capitalisation directly to shareholders. The shareholders who had read the footnote and understood that the inventory was worth more than the market price had effectively been paid to wait.
Olympic Steel and the $20 Million Reserve That Told a Different Story
Olympic Steel, Inc. (NASDAQ: ZEUS) is a Cleveland-based flat-rolled steel distributor with approximately $2 billion in annual revenues, serving customers primarily in the manufacturing, automotive, and construction industries. It is mid-sized by industry standards, covered by a handful of sell-side analysts, and largely ignored by generalist investors.
In its December 31, 2022 10-K filing, Olympic disclosed a LIFO reserve of $20.3 million — meaning its LIFO-stated inventory of $416.9 million would have been $437.2 million under FIFO at current replacement cost. Compared to Ryerson or Nucor, the absolute dollar amount of the reserve is modest. But the proportion matters more than the absolute number.
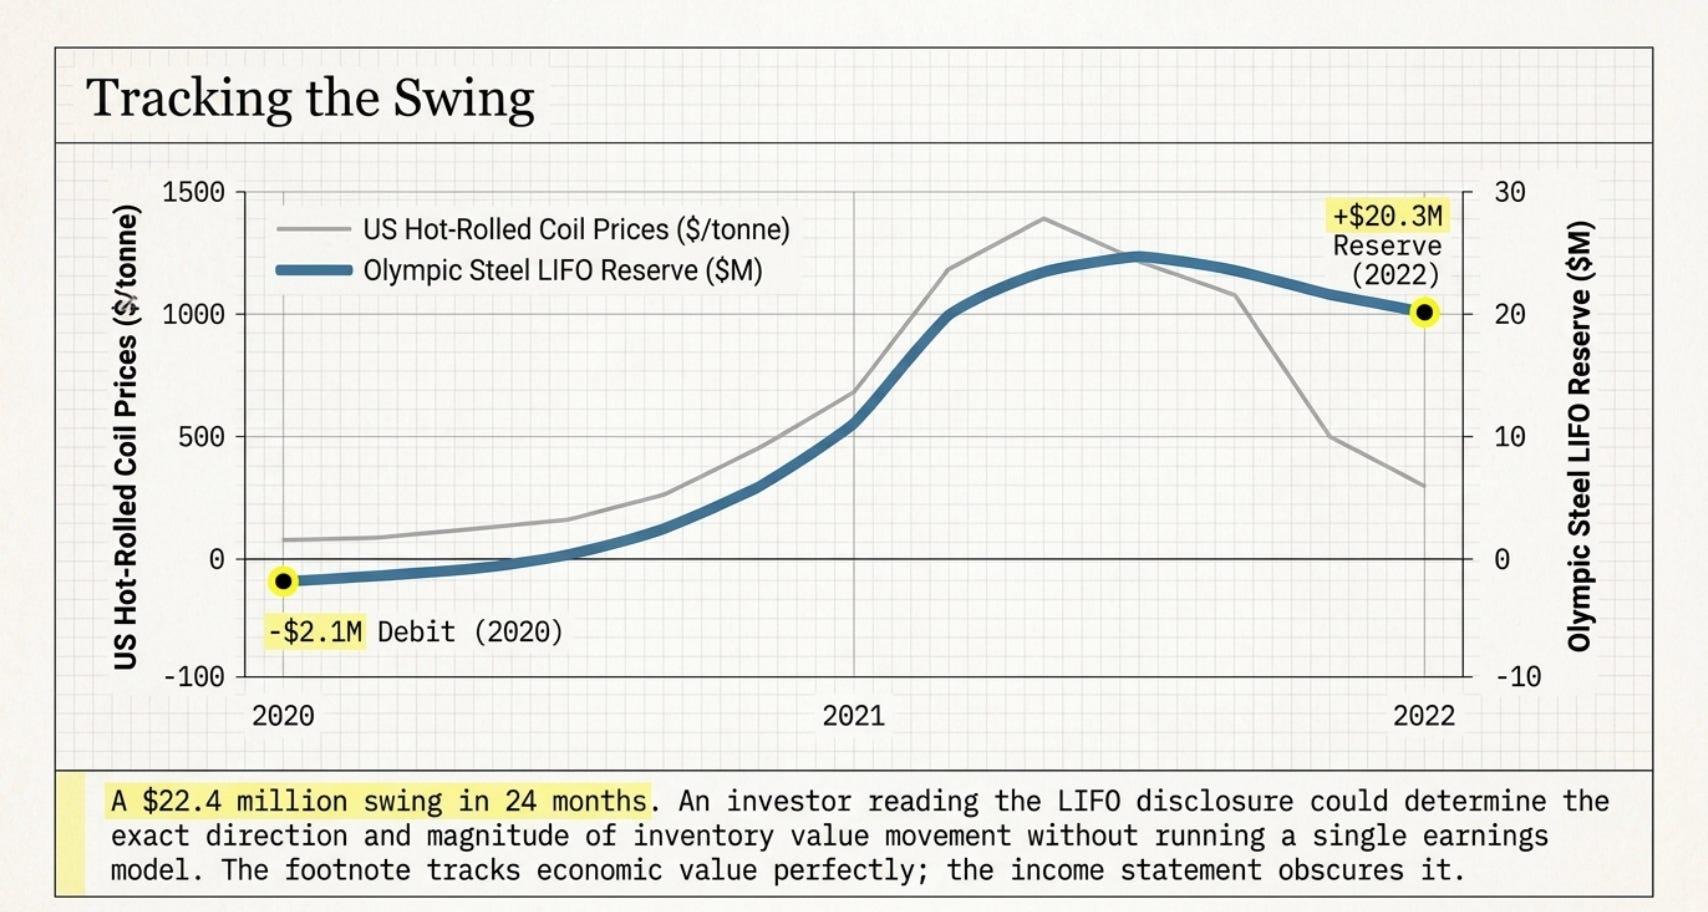
What is more instructive about Olympic Steel’s filing is what happens when you compare the LIFO reserve across years. At December 31, 2020, Olympic had a LIFO debit of $2.1 million — meaning inventories under LIFO were actually slightly higher than FIFO cost, because prices had recently fallen and recent (lower-cost) purchases had been absorbed into the LIFO cost stack while older (higher-cost) layers lingered. By December 31, 2021, the reserve had swung to a positive $19.7 million. By December 31, 2022, it stood at $20.3 million.
This swing from a $2.1 million debit to a $20.3 million reserve — a $22.4 million change in the LIFO reserve — occurred in exactly two years, across a period when US hot-rolled coil prices went from approximately $500/tonne to over $1,800/tonne and back to approximately $800/tonne. The LIFO reserve was measuring, in real time, the gap between what the inventory cost when purchased and what it is worth today. When the reserve is growing, the inventory is accumulating value that the balance sheet does not show. When the reserve is shrinking, the inventory value is reverting toward cost.
An investor who read the LIFO reserve disclosure across two consecutive years — not even across a full cycle — could determine the direction and magnitude of inventory value movement without running a single earnings model. The footnote was doing the work that the income statement obscures.
Olympic Steel’s share price over this period moved from approximately $20 in early 2020 to a peak of approximately $55 in early 2022, before retreating toward $35 as steel prices normalised. The investors who tracked the LIFO reserve expansion rather than the reported earnings had a better framework for understanding when the company was accumulating hidden value and when that value was being realised.
PART VI: WORTHINGTON STEEL — WHERE THE LIFO RESERVE REVEALS A VALUATION STORY
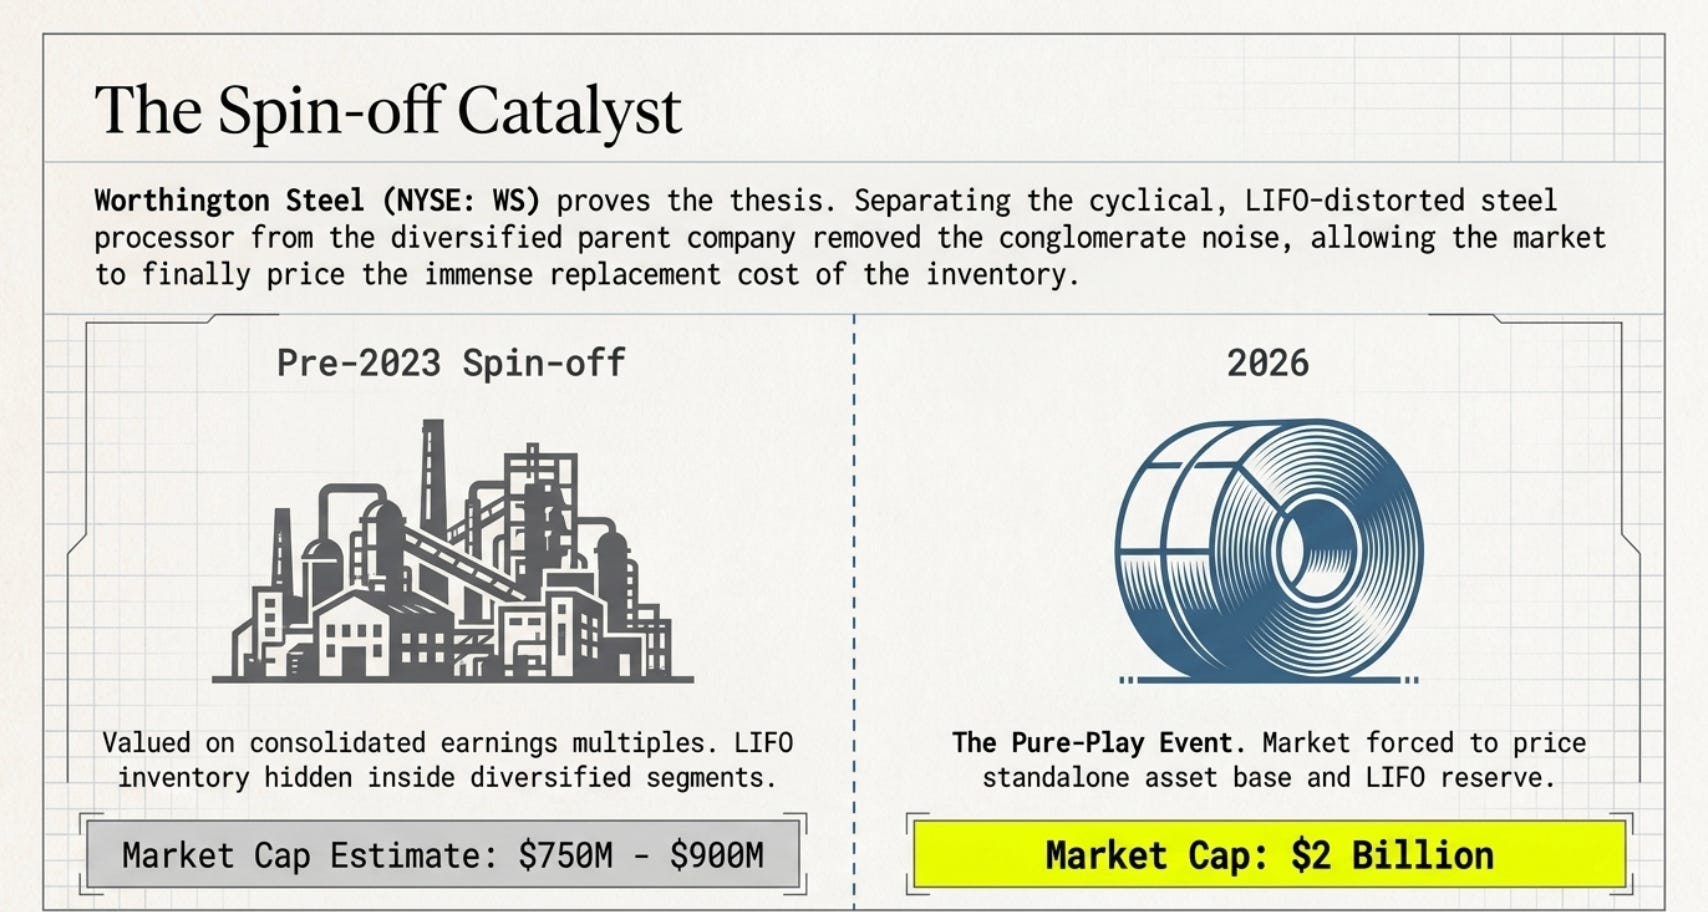
Worthington Steel, Inc. (NYSE: WS) was spun off from Worthington Enterprises in December 2023, separating the steel processing business from the diversified consumer products and building products businesses that had historically been combined under the Worthington Industries umbrella. The spin-off created a pure-play steel processor and service centre for the first time — a company focused entirely on value-added steel processing for automotive, construction, and industrial customers.
The creation of a standalone Worthington Steel was an event that itself illustrated the owner’s vs. market valuation gap in a direct way. The combined Worthington Industries entity had been valued by the market primarily on the earnings multiple of its diversified businesses, which included pressurised cylinders, cooling products, and building systems — businesses with different margin profiles and valuation frameworks than steel processing. The steel processing segment, with its LIFO-distorted inventory accounting and cyclical earnings, was being valued as an appendage of a diversified industrial company rather than as a standalone asset base.
The spin-off forced the market to value the steel assets separately. The initial market capitalisation of Worthington Steel post-spin was approximately $750 million to $900 million. Its disclosed LIFO reserve at the time of separation — inherited from the Worthington Industries steel processing segment — represented meaningful hidden inventory value that would now be visible to investors evaluating a pure-play steel service centre rather than a conglomerate.
As of today (2026), Worthington Steel is worth almost $2 billion in market cap.
PART VII: IRON ORE — THE UPSTREAM PARTNER IN THE SAME STORY
Where the Steel Comes From
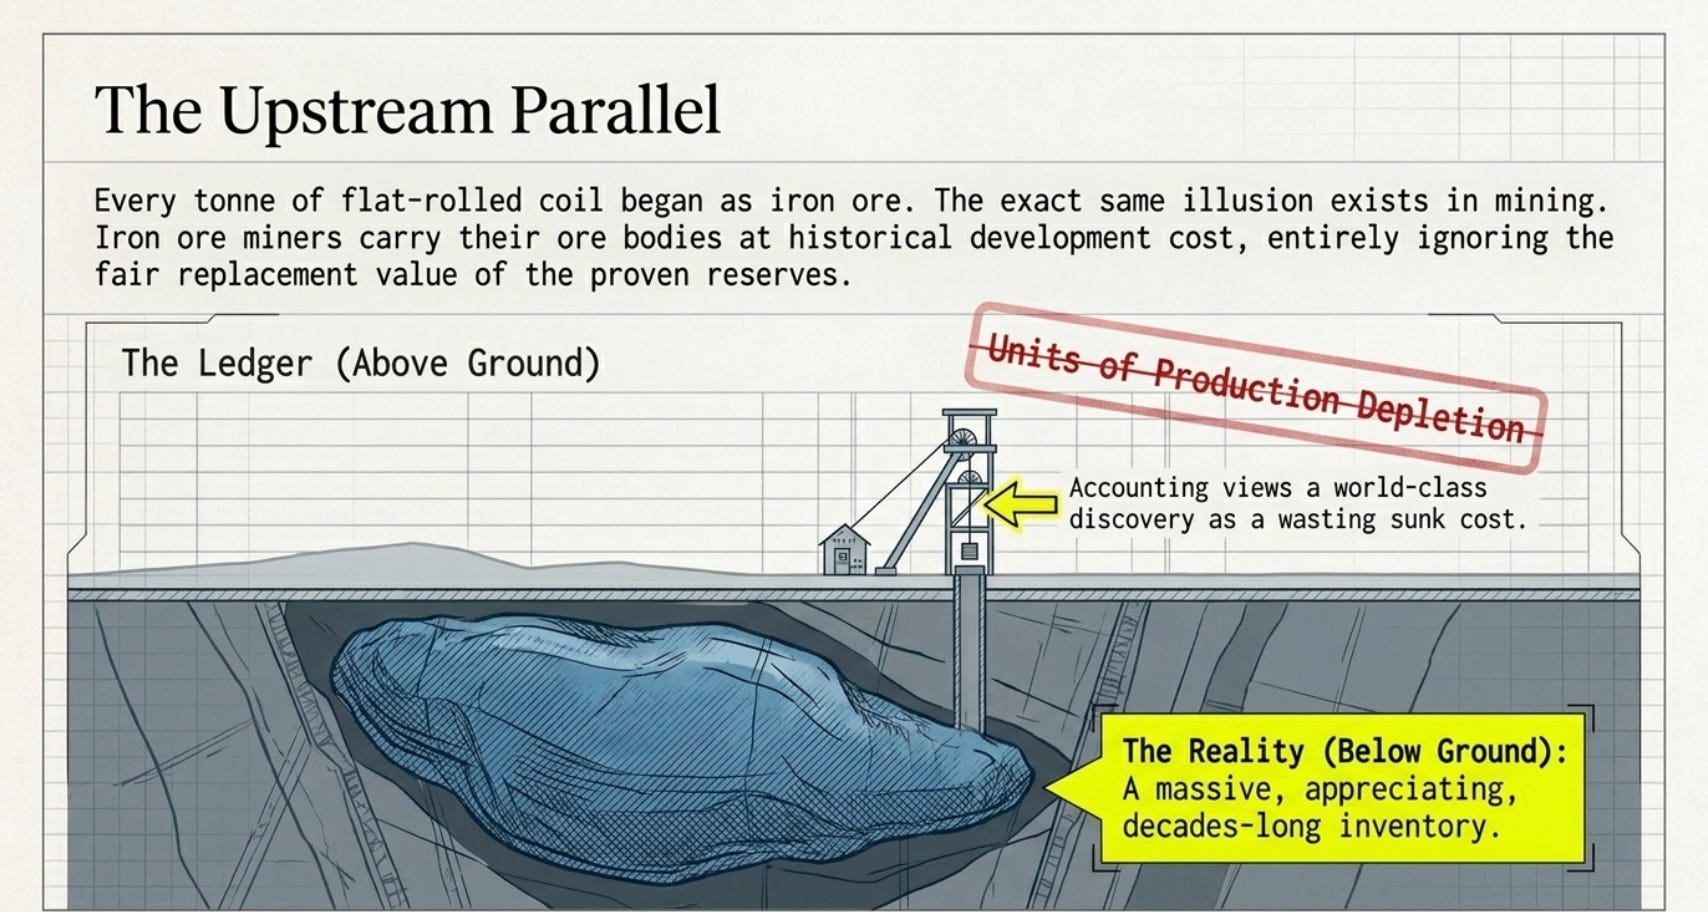
Iron ore is the raw material from which steel is made. Every tonne of flat-rolled coil that fills a steel service centre’s warehouse began as iron ore — typically magnetite or hematite rock mined in Australia, Brazil, West Africa, or the US, shipped to a steel mill, reduced to molten pig iron in a blast furnace, refined to steel in a basic oxygen furnace or electric arc furnace, rolled into sheet or plate, and then distributed through the service centre network.
The economics of iron ore mining have their own version of the same accounting gap we have seen in steel distribution — and the same disconnect between what the balance sheet records and what a business owner would pay for the asset today.
The Ore Body Valuation Gap
Iron ore miners carry their ore bodies on the balance sheet at historical development cost, depleted against production using the Units of Production method. This accounting treatment effectively treats a world-class geological discovery as a wasting expense rather than a massive, appreciating inventory. The ore body itself is never recognized at fair value; what appears on the balance sheet is merely the “sunk cost” of the steel and concrete used to access it.
Rio Tinto: The Multi-Billion Tonne Disconnect
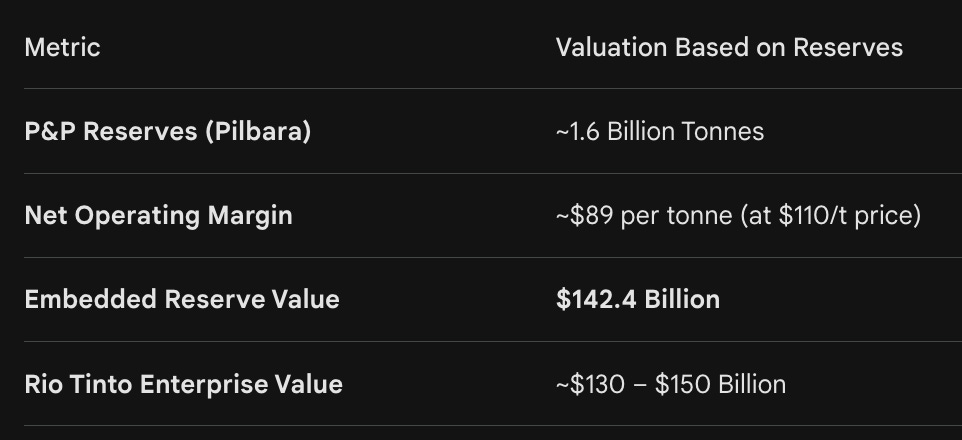
Rio Tinto’s Pilbara operations are not just a production machine pumping out 330 million tonnes a year; they are a massive geological warehouse. As of recent disclosures, Rio Tinto maintains Proved and Probable (P&P) Reserves in the Pilbara totaling approximately 1.5 to 1.7 billion tonnes, with an additional Resource base that extends significantly further.
The Smaller Producers Where the Gap Is More Acute
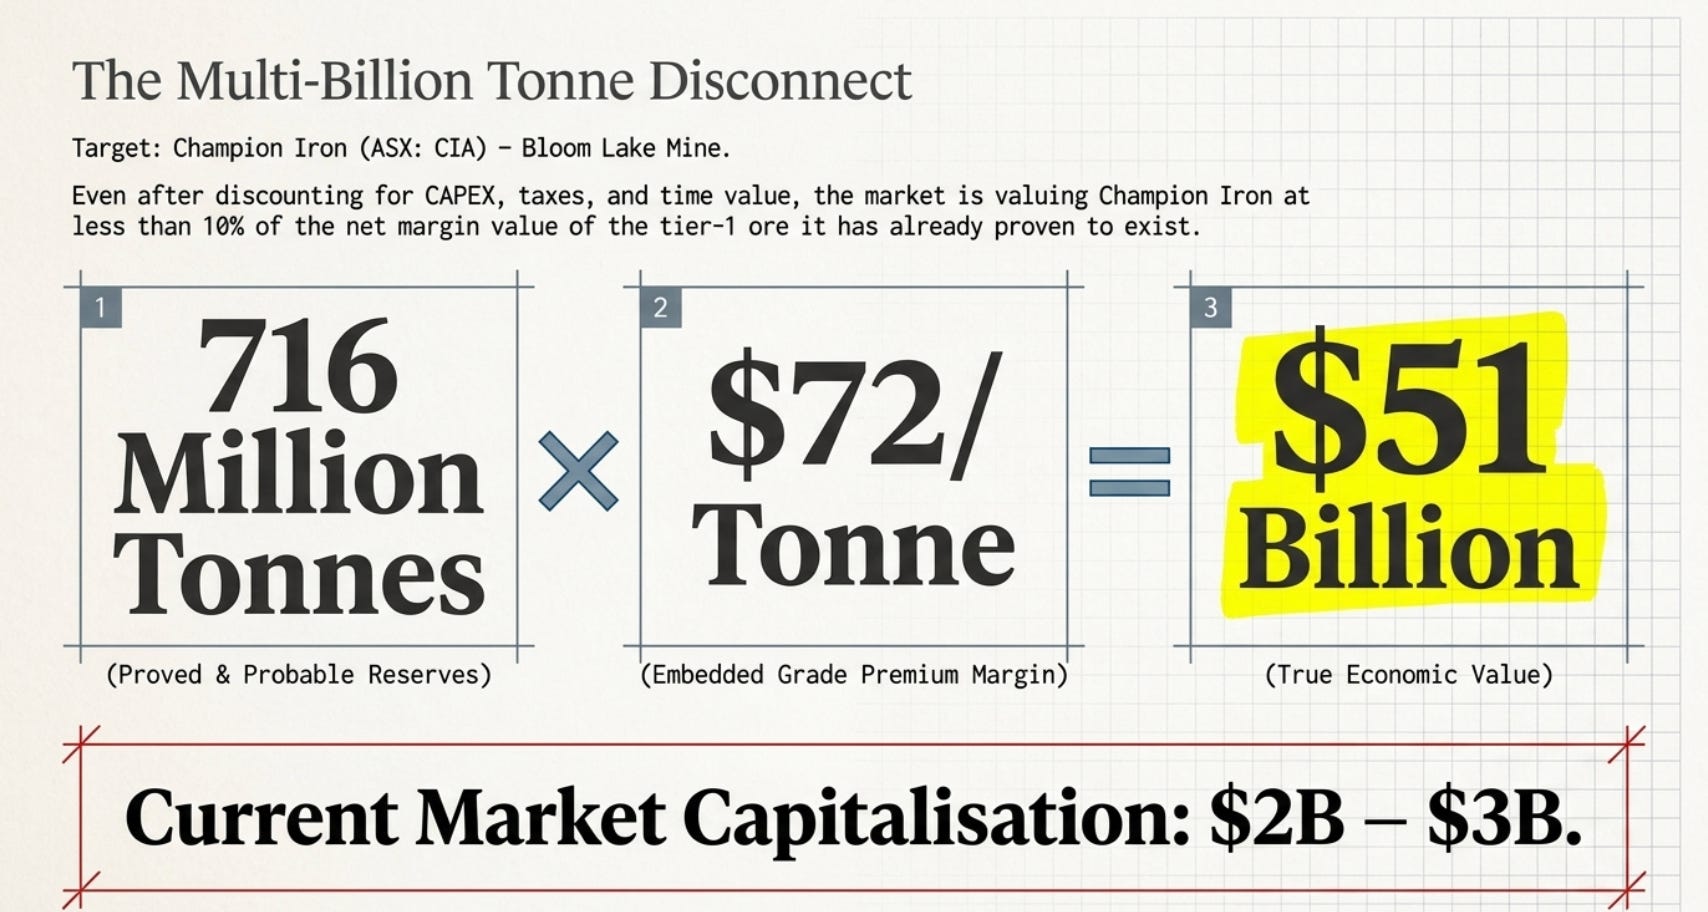
The gap between “book value” and “reserve value” becomes an abyss for smaller, high-grade producers. Champion Iron (ASX: CIA), operating the Bloom Lake mine in Quebec, offers a concentrated example of this mispricing.
Bloom Lake isn’t just a 15–20 million tonne-per-annum (Mtpa) producer; it is a Tier-1 asset with a reserve life that spans decades.
The Reserve Base: Champion Iron reports Proved and Probable Reserves of approximately 700 million tonnes at Bloom Lake.
The Grade Premium: Because it produces a 66.2% Fe concentrate, the “embedded margin” per tonne is higher than the Pilbara benchmark, estimated at ~$72 per tonne (at $120/t benchmark prices).
The “Shadow” Balance Sheet
If we multiply the 716 million tonnes of reserves by the $72/tonne margin, we find an embedded value of roughly $51 billion.
Yet, Champion Iron’s market capitalization typically sits between $2 billion and $3 billion. Even after accounting for future capital expenditures, taxes, and the time value of money (discounting), the market is essentially valuing the company at less than 10% of the net margin value of the ore it has already proved to exist.
The “Units of Production” depletion method on the balance sheet treats each tonne mined as a loss of value. In reality, the “proven” nature of these decades-long reserves provides a margin of safety and a duration of cash flow that traditional earnings-per-share (EPS) models, which often look only 12–24 months ahead, fail to capture.
PART VIII: CONFIRMED CATALYSTS — WHAT IS ALREADY IN MOTION
Catalyst 1: US Section 232 Steel Tariffs — Confirmed and Structurally Active
The Trump administration’s Section 232 tariffs on steel imports, first imposed in March 2018, have been maintained, expanded, and reinforced through multiple subsequent administrations. The reimposition and strengthening of Section 232 tariffs in early 2025 — under the new Trump administration — added an additional layer of import protection on top of the existing baseline. As of 2025, most foreign steel entering the United States faces a 25% ad valorem tariff, with country-specific quota arrangements for a small number of allied nations.
The effect of sustained Section 232 tariffs is to create a domestic steel price floor. When global steel prices are below US prices plus the tariff, imports are non-competitive and domestic mills can maintain higher prices than the global market would otherwise support. For steel service centres holding domestic inventory — purchased at domestic mill prices that already reflect the tariff floor — this means their inventory value is supported by a government-maintained price floor that does not exist in most commodity markets.
This is not a cyclical factor. It is a policy factor that has now persisted for seven years across two administrations with opposing economic philosophies, suggesting bipartisan durability rooted in domestic political economy rather than abstract trade theory. Service centres whose LIFO reserves were built at pre-tariff price levels hold inventory whose replacement cost is permanently elevated relative to global commodity prices by the tariff differential. The LIFO reserve measures this gap precisely, and the gap is sustained by enacted, currently-operative law.
Catalyst 2: Infrastructure Spending and the Steel Demand Baseline
The US Infrastructure Investment and Jobs Act (IIJA) of 2021 authorised approximately $1.2 trillion in federal spending over five years, including roughly $550 billion in new spending on transportation, broadband, water infrastructure, and the power grid. The specific steel content of this infrastructure investment is substantial: bridges, structural beams for elevated highways, rebar for concrete construction, pipe for water systems, and structural steel for transmission towers all require domestic steel supply under the Buy America provisions of the act.
Infrastructure spending works through steel distributors for a significant fraction of its requirements. Large construction contractors and fabricators purchase structural steel, plate, and other products from service centres for customisation and just-in-time delivery to construction sites. The IIJA’s multi-year spending profile creates a sustained demand baseline that reduces the volatility in steel service centre revenues relative to purely cyclical demand patterns. For companies like Olympic Steel, which focuses on flat-rolled products including those used in manufacturing and construction equipment, the infrastructure programme creates a multi-year demand tailwind that makes the inventory — and the LIFO reserve attached to it — more defensible as an asset.
Catalyst 3: Automotive Electrification and the Hidden Steel Story
The transition from internal combustion engine vehicles to battery electric vehicles involves an often-overlooked fact about steel consumption: EVs require substantially more electrical steel — specifically non-grain-oriented (NGO) electrical steel — for their motors than ICE vehicles require for any equivalent application. The motor stators and rotors in an EV motor use laminated electrical steel to manage magnetic flux. A single EV traction motor might require 30 to 60 kilograms of electrical steel sheet. Large EV motors — in performance vehicles, SUVs, and commercial trucks — require more.
Steel service centres that have invested in processing capabilities for electrical steel — precision slitting to tight width tolerances, surface protection to prevent corrosion, flatness control to meet motor lamination requirements — are positioned to benefit from the EV transition in a way that the standard automotive steel distributor is not. Worthington Steel has explicitly identified electrical steel processing as a growth focus, having invested in capabilities to serve motor lamination customers. The installed processing capability — the slitters, tension levellers, and quality control systems capable of handling electrical steel — represents an asset that is valued on the balance sheet at historical capital expenditure cost, not at the forward value of the customer contracts and market position it enables.
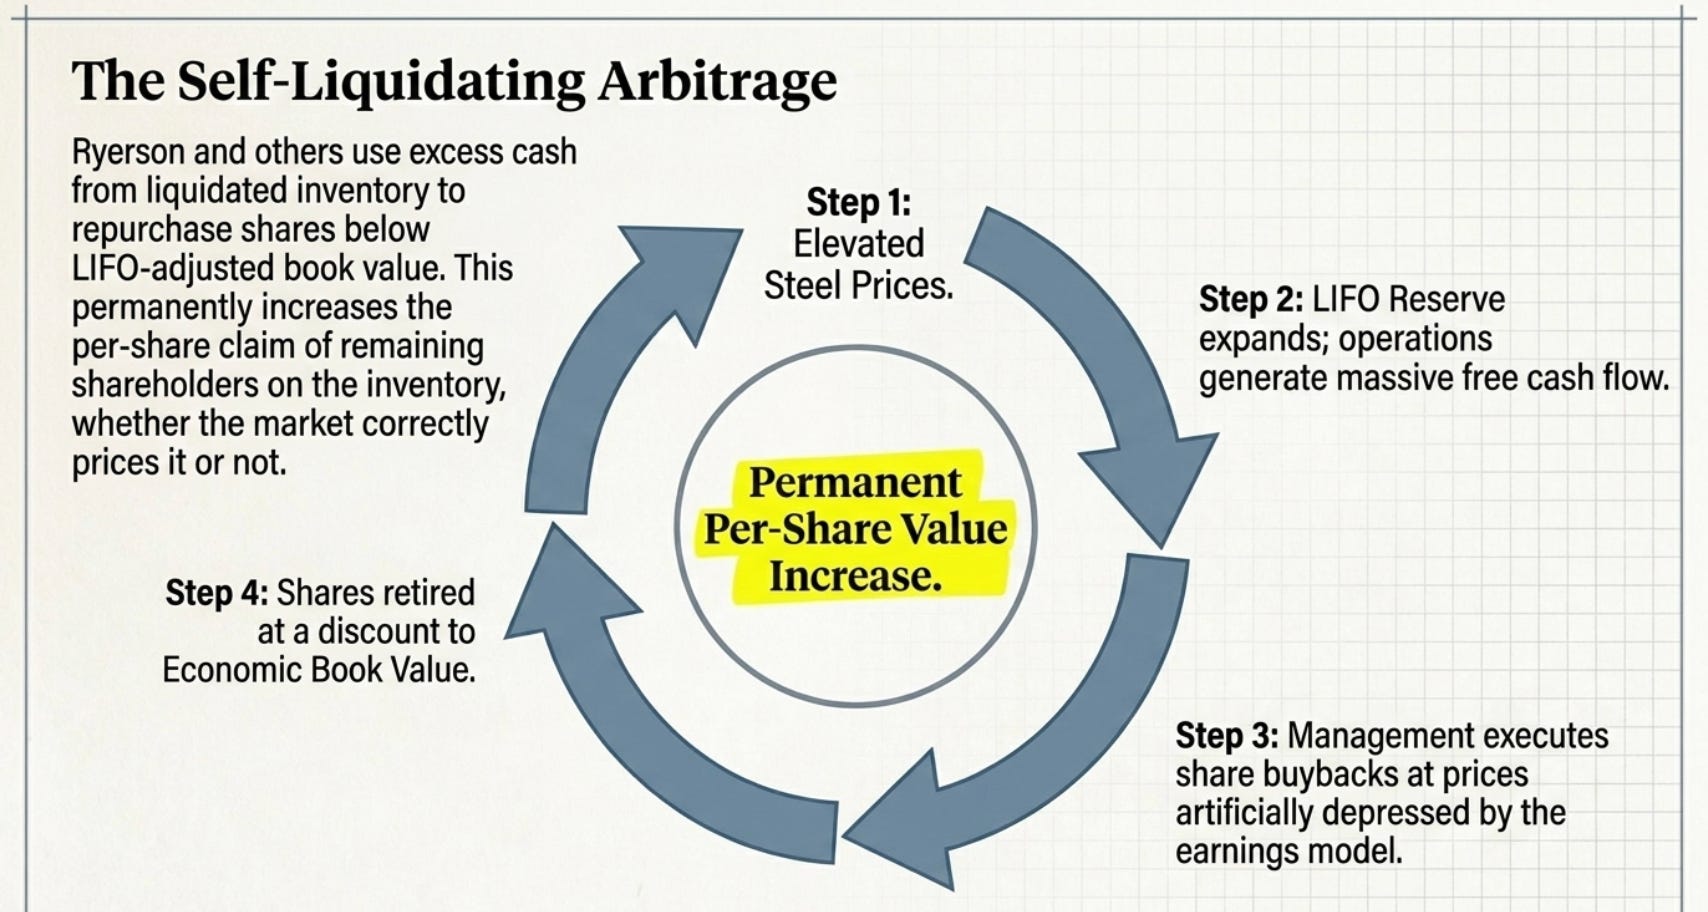
Catalyst 4: The LIFO Reserve as a Buyback Mechanism — The Self-Liquidating Value
There is a final catalyst for steel distribution value arbitrage that is less obvious than policy or demand, but more direct in its effect on shareholder returns: the LIFO reserve itself creates the conditions for highly accretive share buybacks.
Here is the mechanism. When steel prices are elevated and the LIFO reserve is large, service centres generate substantial cash earnings from their operations — the spread between purchase price and sale price is wide, inventory is turning at elevated prices, and cash is accumulating. Management can choose to return this cash to shareholders through buybacks. The stock price, artificially depressed by the earnings model’s failure to credit the LIFO reserve, means the buyback is purchasing shares at a discount to their economically adjusted book value. The company is essentially converting excess inventory value — recognised in the footnote but not in the market price — into permanent per-share value through repurchasing shares at below-economic-book-value prices.
Ryerson specifically highlighted this dynamic during its capital allocation discussions in 2021 and 2022, when the company was generating substantial free cash flow from its inflated-price inventory liquidation and using a portion of that cash to repurchase shares. The share count declined during a period when the share price did not fully reflect the inventory value. Each repurchased share at below-economic-book-value permanently increases the per-share claim of remaining shareholders on the inventory value — whether or not the market ever correctly prices it.
The catalyst here is confirmed in a simple way: these companies have historically been consistent repurchasers of their own shares during periods of elevated steel prices, and the buybacks have consistently been executed at prices that, on an LIFO-adjusted basis, were below economic book value. The pattern is documented in proxy statements, earnings releases, and annual reports. It does not require a forecast to expect to continue — it follows mechanically from the financial incentive structure.
CONCLUSION: THE FOOTNOTE AS THE MOST HONEST NUMBER IN THE DOCUMENT
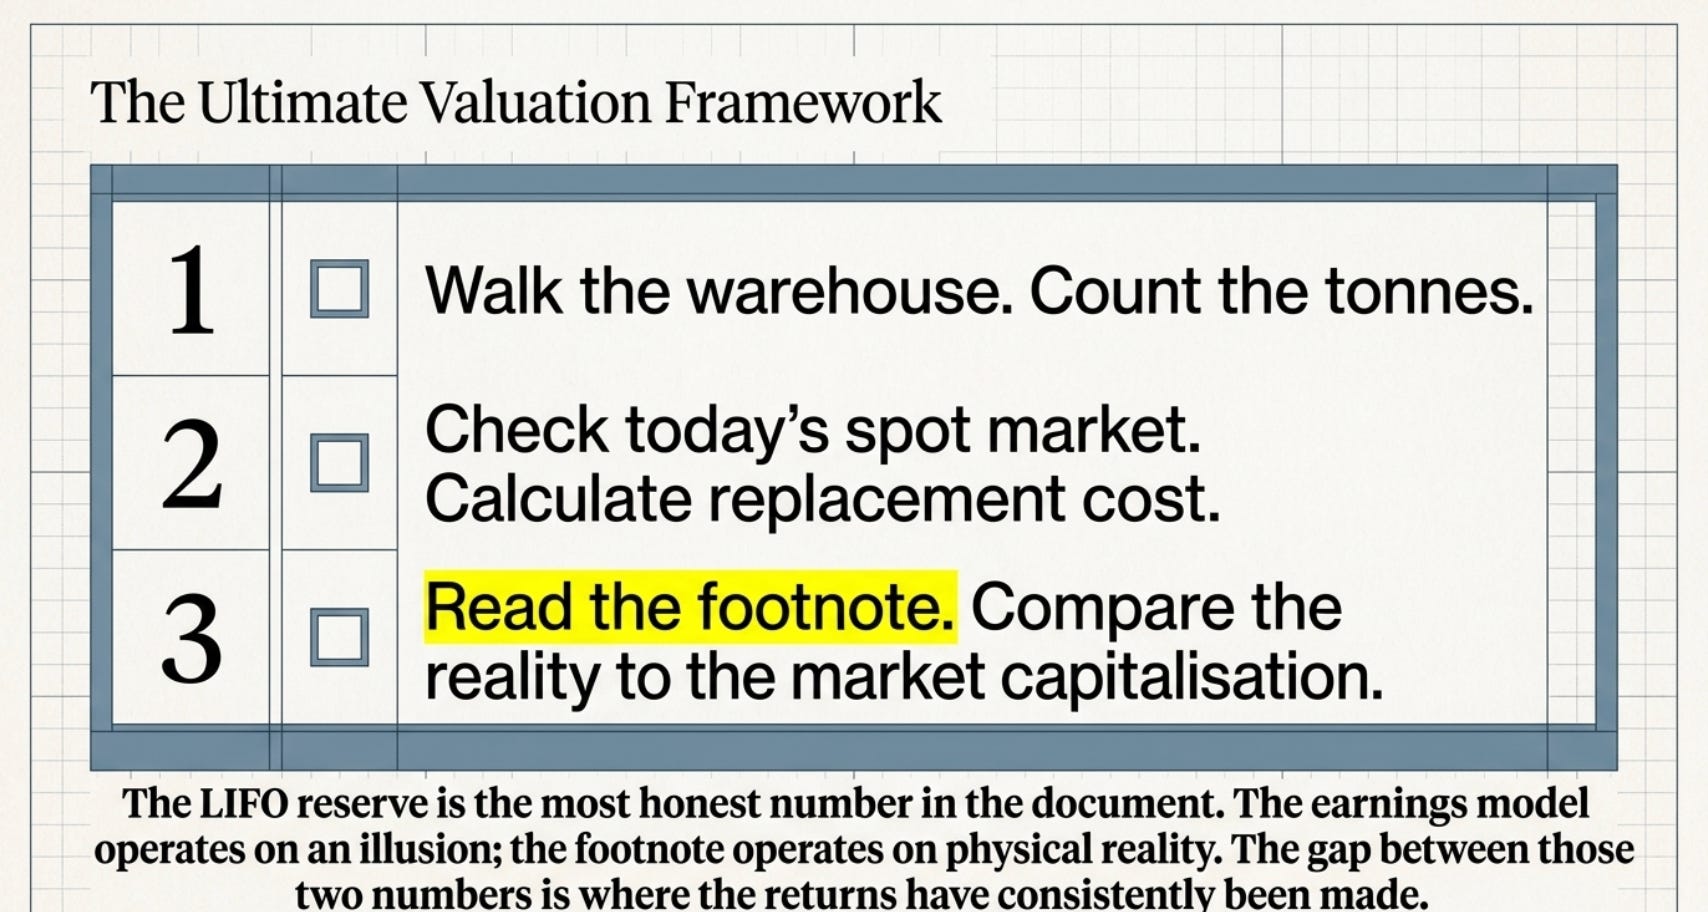
There is something almost absurd about the structure of the value arbitrage described in this paper. The information that creates the opportunity is not hidden. It is disclosed. It is required to be disclosed by US GAAP, in every annual report filed by every LIFO-method company, in the notes to the financial statements. The LIFO reserve tells you, in plain numbers, exactly how much the inventory is understated relative to current replacement cost. It is the most honest number in the document — it is the number that says, “here is how much more the inventory is actually worth than what the balance sheet shows.”
And yet the market persistently underweights it, because the earnings model does not use it, because the P/E ratio ignores it, because the EV/EBITDA calculation is built on reported earnings rather than LIFO-adjusted earnings, and because institutional investors are trained to look at the income statement first, the balance sheet second, and the notes to the financial statements almost never.
The business owner who is considering buying a steel service centre does not start with the income statement. They walk the warehouse, count the tonnes, check today’s steel price on the spot market, calculate the replacement cost of what is on the racks, and compare that to the acquisition price. The LIFO reserve footnote is that owner’s calculation, disclosed in regulatory-mandated format, sitting in plain view on EDGAR for any investor who cares to look.
The pattern is consistent across the companies in this sector. Ryerson’s inventory was worth $245 million more than the balance sheet showed at year-end 2022. Nucor’s was understated by $1.1 billion. Friedman’s by approximately 37% of its stated inventory value. Olympic Steel’s reserve grew from negative $2 million to positive $20 million in two years, tracking the steel price cycle in a way that the reported gross margin did not. Every one of these numbers was in a footnote. Every one of them told a more accurate story about asset value than the earnings model did.
The iron ore producers tell the same story from a different direction: ore bodies carried at depleted historical cost, generating annual operating income many multiples of their balance sheet value, priced by the market on earnings multiples that are most compressed precisely when the ore price is highest and the balance sheet value is furthest below replacement cost.
In both cases — the steel distributor with its LIFO reserve and the iron ore producer with its depleted mineral property — the accounting is doing what accounting was designed to do: recording historical cost conservatively. The market is doing what it usually does: anchoring on the most visible, most frequently reported metrics. The business owner is doing something simpler and more direct: asking what the asset is worth today, at today’s prices and today’s costs, and comparing that to what the market is charging for it.
The gap between those two numbers is where the returns have consistently been made.
This white paper is for educational and informational purposes only. All financial figures cited are drawn from publicly available company filings including 10-Ks, 20-Fs, 40-Fs, and earnings releases as filed with the SEC or equivalent regulatory bodies. Specific footnote disclosures cited include Note 4 (Inventories) of Ryerson Holding Corporation’s December 31, 2022 10-K and the corresponding disclosures of Olympic Steel and other companies named. Nothing herein constitutes investment advice.
If you like this read, check out my other writings 👇
Rust, Rigs, and the Recurring Revenue Hidden in Plain Sight: A Deep Dive into Beng Kuang Marine (SGX: BEZ)

The Old Steel and the Sea: Why You Should Care About a Ship Maintenance Company
Investment Reflection #2 — The Grand Play: 100 Years of the World’s Nations as Characters in the Greatest Story Ever Told

“The world is not a chessboard. It is a living organism, where every cell — every nation — eats, competes, cooperates, and occasionally tries to eat the others. Understanding it requires not just memorizing moves, but understanding hunger.”

The Tide Is Going Out: Commodity Houses, Private Credit, and the AI Debt Bomb

Start Here: What This Article Is About
Why I Passed on Graftech (EAF): Riding The Battery Hype, Or Perhaps Not...

There is a kind of company that is the most dangerous thing in investing. It is not the fraudulent company. It is not the obviously bad company with terrible products and incompetent management. Those are easy — you just avoid them. The truly dangerous company is the one with a
The Beautiful Trap: Why I'm Passing on The Hour Glass (SGX: AGS)

There’s a peculiar kind of investment that keeps you up at night — not because it’s bad, but because it’s genuinely good. Good enough to admire. Not good enough to buy.
The Diamond in the Rough That Isn't Quite Yours: Why I Passed on Boustead (SGX: F9D)

There is an old saying that investors have borrowed, bent, and quoted so many times it has nearly lost its sharpness: a bird in the hand is worth two in the bush. Warren Buffett, characteristically, gave it a precise mathematical form. The value of any investment, he wrote, is determined by three questions:
The Schoolteacher's Secret Insurer: Why Horace Mann (NYSE:HMN) Is Sitting on My Watchlist

“The stock market is a device for transferring money from the impatient to the patient.” — Warren Buffett

The Dormitory King That Couldn't Leave Home: Why I Passed on Centurion (SGX: OU8)

There is a deceptively simple question that Warren Buffett borrowed from Aesop’s ancient fable, and has repeated across decades of shareholder letters: “How many birds are in the bush? How sure are you they’re there? And how long until you get them out?”
The Children's Place: A $90 Million Bet on a Company That Used to Be Worth $2 Billion (NYSE: PLCE)

There is a classic scene in every heist movie. The detective walks into a room, sees the chalk outline, the scattered evidence, the broken window, and immediately knows something went terribly wrong long before anyone called the police. You do not need the full autopsy report to read the body.
World War 3 In Iran and Why Oil Price Will Continue Increasing — It Arrived Sooner Than Anyone Expected

This is Part 2 of a continuing analysis of California Resources Corp (CRC). Part 1 built the foundational investment case: a company trading at $44 per share against a conservative intrinsic value of $108–$156, built on 567 million barrels of proved developed oil reserves in California, and a management team spending hundreds of millions buying back its…
The Most Overlooked Oil Company in America — And Why That Might Be the Opportunity of the Decade

Date of analysis: 28 December 2025
The Art Of Saying No - MYPS: Playstudios Inc

PLAYSTUDIOS (MYPS) is a Las Vegas-based mobile gaming company that operates free-to-play social casino games and a loyalty platform called playAWARDS, which lets players redeem points for real-world rewards at places like MGM Resorts, Norwegian Cruise Line, and Wolfgang Puck restaurants. On the surface, this sounds like a clever moat. A loyalty program.…
The Art Of Saying No - UGP: Ultrapar Participacoes S.A (Part 2 of 2)

Question 2: How Certain Are You?
The Art Of Saying No - GLIBK: GCI Liberty Inc

Picture this: a single telecommunications company — the dominant one — serves over 200 communities scattered across the largest state in the United States. Alaska. A state with just over one person per square mile. A state where 39% of residents are underserved by broadband. A state where, until recently, some villages received internet via satellite li…

The Art Of Saying No - UGP: Ultrapar Participacoes S.A (Part 1 of 2)

The Setup: A Value Investor Dream?


The Art of Saying No - RIG: Transocean LTD

“The difference between successful people and really successful people is that really successful people say no to almost everything.” — Warren Buffett
The Art of Saying No - KPRX: Kiora Pharmaceuticals Inc

“The difference between successful people and really successful people is that really successful people say no to almost everything.” — Warren Buffett
The Art of Saying No - DNUT: Krispy Kreme Inc

“The difference between successful people and really successful people is that really successful people say no to almost everything.” — Warren Buffett

🎓 A Business Strategy Primer Part 7 - Learning From Great Companies

The Billion-Dollar Playbook: How Market-Based Management Powered Koch Industries’ Unstoppable Rise
The Art of Saying No - MRX: Marex Group PLC

“The difference between successful people and really successful people is that really successful people say no to almost everything.” — Warren Buffett


The Art of Saying No - SFIX: Stitch Fix Inc

“The difference between successful people and really successful people is that really successful people say no to almost everything.” — Warren Buffett
🎓 A Business Strategy Primer Part 2 - Brainstorming Solutions With Value At The Core

Creating An Irresistible Offer
The Art of Saying No - TDOC: Teladoc Health Inc

“The difference between successful people and really successful people is that really successful people say no to almost everything.” — Warren Buffett

The Art of Saying No - MDU: Mdu Resources Group Inc

“The difference between successful people and really successful people is that really successful people say no to almost everything.” — Warren Buffett


The Art of Saying No - AFCG: Advanced Flower Capital Inc

“The difference between successful people and really successful people is that really successful people say no to almost everything.” — Warren Buffett
The Art Of Saying No - VYX: NCR Voyix Corp

“The difference between successful people and really successful people is that really successful people say no to almost everything.” — Warren Buffett
The Art of Saying No - VSTS: Vestis Corp

“The difference between successful people and really successful people is that really successful people say no to almost everything.” — Warren Buffett

🛢️Basic Energy Primer Part 2 - Business and Competitive Landscape

The Man Who Bet Everything on Being Wrong
The Art of Saying No - CISS: C3is Inc

“The difference between successful people and really successful people is that really successful people say no to almost everything.” — Warren Buffett
The Art of Saying No - PSHG: Performance Shipping Inc

“The difference between successful people and really successful people is that really successful people say no to almost everything.” — Warren Buffett

The Art Of Saying No - MAGN: Magnera Corp

The Magnera Corporation Analysis Nobody Asked For (But Everyone Needs)
The Art of Saying No - CHR: Cheer Holding Inc

“The difference between successful people and really successful people is that really successful people say no to almost everything.” — Warren Buffett
The Art of Saying No - WIMI: WiMi Hologram Cloud Inc.

“The difference between successful people and really successful people is that really successful people say no to almost everything.” — Warren Buffett
⚡️Alternative Energy Primer Part 3 - Industry and Sector Technicals

The €2.2 Billion Mistake That Revealed Everything
⚡️Alternative Energy Primer Part 2 - Business & Competitive Landscape

The Shipwreck That Changed Everything

🏥 A U.S. Health Insurance (Managed Care Organizations) Sector Primer

1️⃣ Industry Fundamentals & Macro View

