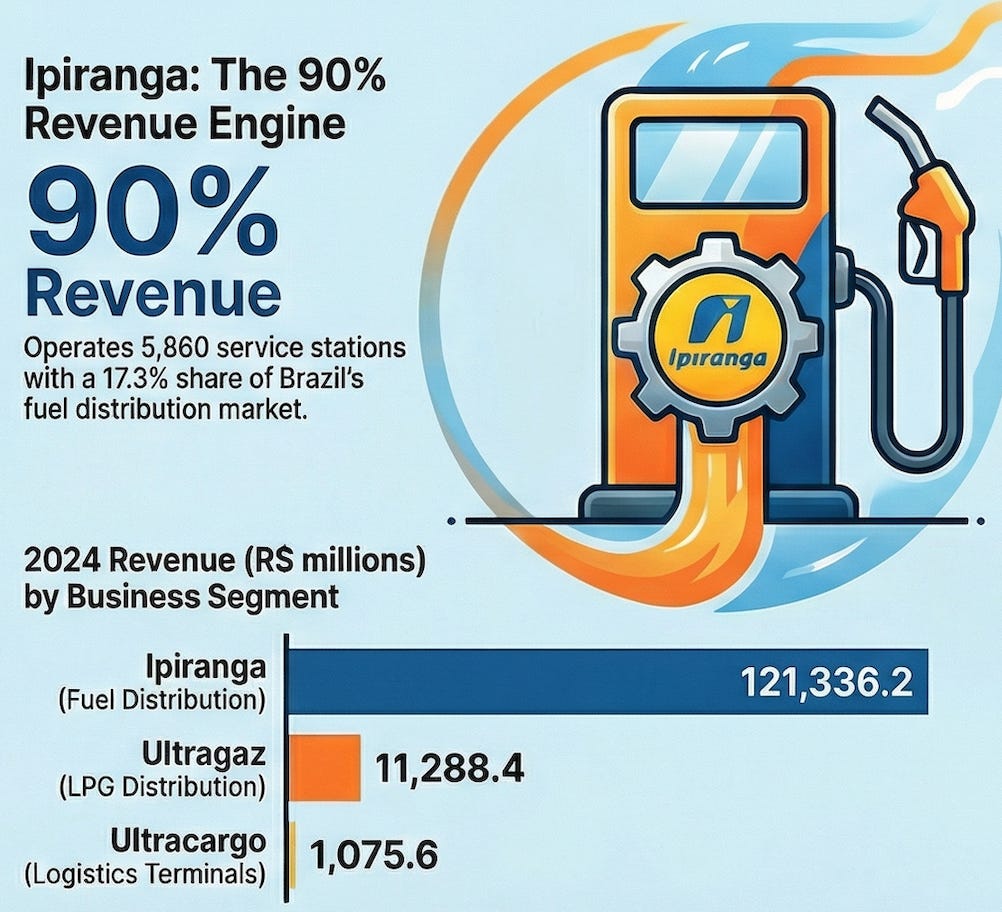
Picture this: You are scanning through emerging market opportunities, and you stumble upon a Brazilian company that looks almost too good to be true. Ultrapar Participacoes S.A., trading on the NYSE under ticker UGP, presents metrics that make value investors salivate: a P/E ratio of 7.5, a P/B of 1.5, a P/S of 0.13, and an ROE of 18%. The company dominates Brazil’s fuel distribution market with a 17.3% market share through its Ipiranga brand, operates 5,860 service stations, runs one of Brazil’s top 8 loyalty programs, and controls strategic storage terminals positioned at crucial logistics corridors.
On paper, this is the kind of situation Warren Buffett talks about when he says buying quality merchandise when it is marked down. The numbers are shouting undervalued at volumes that would make Graham and Dodd proud.
Yet, after a deep dive into Ultrapar’s operations, competitive positioning, and financial structure, I am passing on this opportunity. Not because the company is bad, quite the opposite. Ultrapar is a well-run business with genuine competitive advantages and solid execution. But as Charlie Munger once quipped, it is better to hold excess cash than to invest in mediocre opportunities. This is a case where the right answer is to sit this one out.
The reason? A fundamental principle that often gets lost in the excitement of finding cheap stocks: it is not just about the birds in the bush, it is about the native of those birds.
This article walks through the three-question framework that guides every investment decision: (1) How many birds are in the bush? (2) How certain are you? (3) How long until you get them out? For Ultrapar, while the first two questions yield promising answers, it is the third question, complicated by systemic risk, that turns this apparent bargain into a pass.
Understanding the Beast: What Ultrapar Actually Does
Before we can intelligently discuss whether Ultrapar is a good investment, we need to understand what it actually does. Too many investors skip this step, jumping straight to the numbers. As Peter Lynch famously said, never invest in any idea you cannot illustrate with a crayon. So let us draw the picture.
The Three-Legged Stool
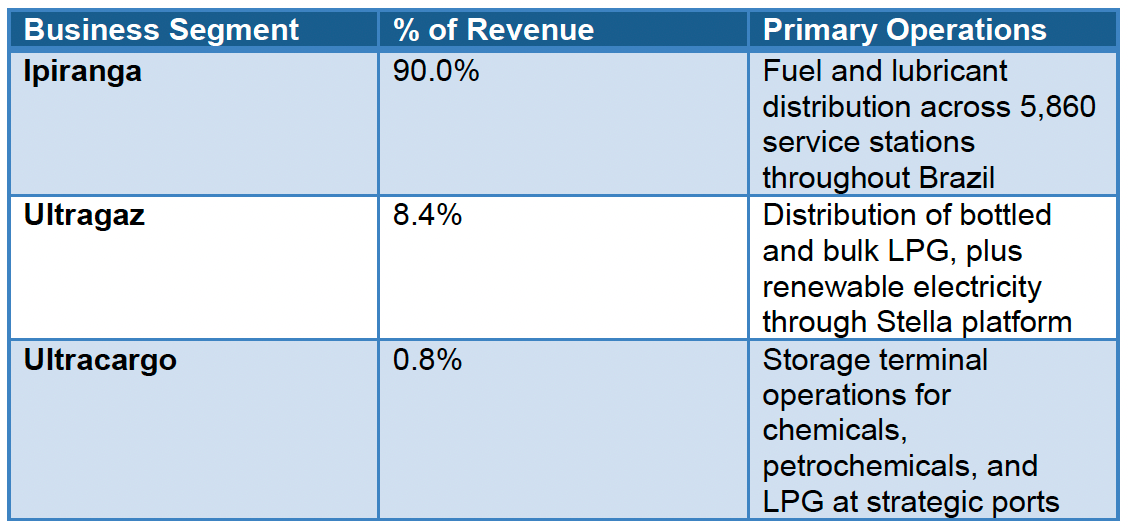
Ultrapar operates through three main business segments, though one clearly dominates:
When 90% of your revenue comes from one segment, that is not really a three-legged stool, it is more like a pogo stick. Ipiranga is Ultrapar for all practical investment purposes. So let us focus there.
Ipiranga: The Asset-Light Fuel Distribution Model
Here is where Ultrapar’s business model gets interesting, and it is crucial to understand this to appreciate both its strengths and its limitations.
Ipiranga’s fuel distribution revenues are made up mostly of Diesel (more than 50%), followed by Gasoline then Lubricants and greases.
However, unlike traditional oil companies that own massive refining operations and retail real estate, Ipiranga operates under what is predominantly an asset-light model. Of those 5,860 service stations, 90% follow a structure where the operator or a third party owns the land and constructs the facility, typically financed by Ipiranga. The company then provides:
Exclusive fuel distribution contracts
Brand licensing (Ipiranga, and now Texaco through a 2024 Chevron partnership)
Technical and financial support
Marketing and advertising
Franchise opportunities for complementary services and ecosystem support e.g. AmPm, KMV, JetOil, Krispy Kreme (which brings us back to our DNUT 0.00%↑ analysis)
Think of it like the McDonald’s model, but for fuel. McDonald’s does not own most of its restaurant real estate; franchisees do. But McDonald’s controls the brand, the supply chain, and the standards. This generates strong returns on capital because you are not tying up enormous amounts in land and buildings.
The Franchise Ecosystem: Where Ultrapar Really Shines
But Ultrapar has built something more sophisticated than just fuel distribution. They have created an ecosystem that captures multiple revenue streams from each customer interaction. This is where understanding the concept of customer lifetime value (CLV) becomes critical.
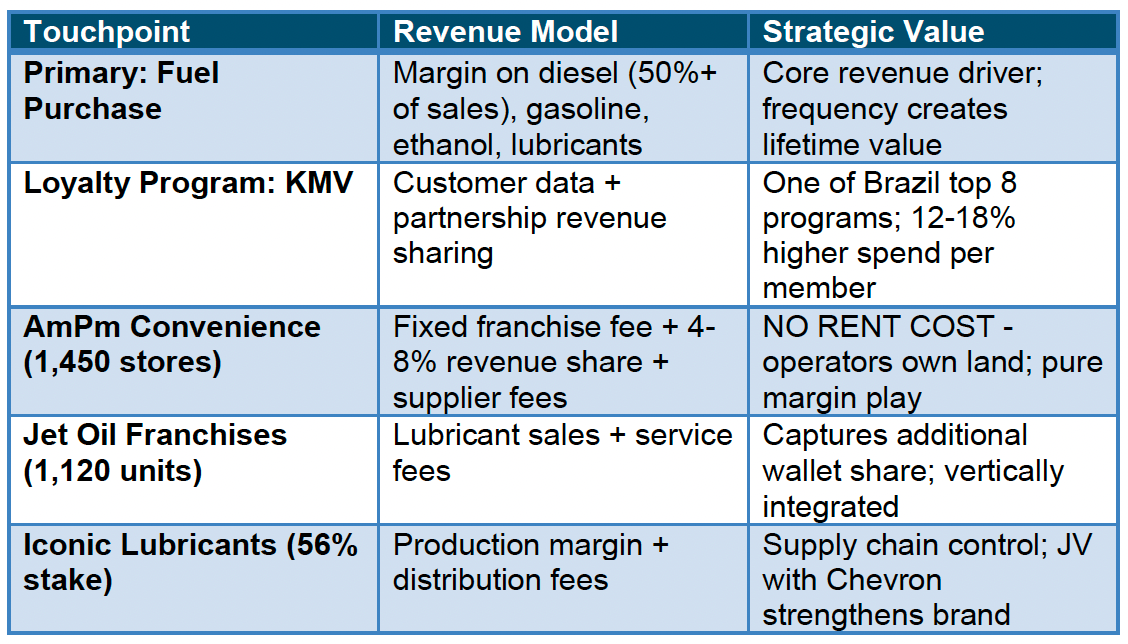
Consider what happens when a customer pulls into an Ipiranga station:
Thanks for reading Compounding Zero! Subscribe for free to receive new posts and support my work.
The Economics of AmPm: The Hidden Gem
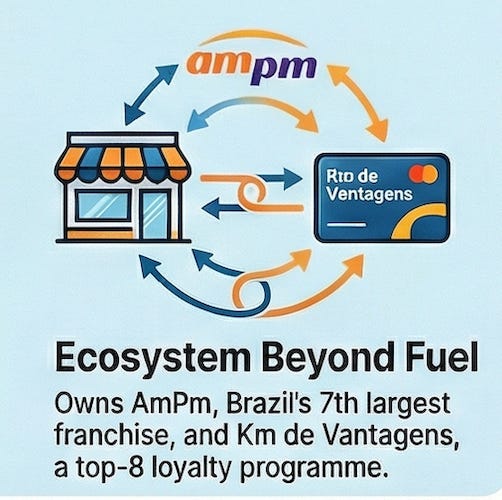
AmPm deserves special attention because it represents one of the most elegant aspects of Ultrapar’s model. As Brazil’s seventh-largest franchise network with 1,450 stores and 25% penetration in Ipiranga service stations, AmPm operates under a unique economic structure that most analysts overlook.
Here is the key insight: rent DOES NOT make up a major operating cost of AmPm like most retailers (at least that’s what the annual report suggests). Since 90% of Ipiranga’s stations are on land owned by the operators themselves, AmPm operates under a licensing plus revenue-sharing model. The station operator, who already owns the property for fuel distribution, simply adds the AmPm franchise. Ultrapar earns revenue through:
Fixed franchise fees (recurring income regardless of performance)
4-8% of store revenues (variable income that scales with success)
Merchandising fees from supplier agreements (additional margin from brands wanting shelf space)
This structure means AmPm enjoys exceptional unit economics. There is no rent expense eating into margins, no property taxes, no facility maintenance costs. The operators bear those expenses as part of their fuel station operations. Ultrapar simply layers on the franchise brand and supply chain, capturing 4-8% of top-line revenue as nearly pure profit.
Even more impressively, as AmPm optimizes its format, the number of stores has actually shrunk while revenue has increased. This is the mark of intelligent capital allocation: focusing on high-performing locations rather than chasing store count. By the end of 2024, 632 stores were operating under the new optimized format, including 626 franchises and 6 company-operated units.
The house of brands strategy adds another layer. AmPm has expanded partnerships with Pizza Hut, Nathan’s Famous, Oakberry, and Mr. Cheney Cookies, driving greater engagement and profitability for franchisees. In 2024, the company advanced a joint venture with Krispy Kreme, bringing the leading U.S. donut brand to Brazil, with multiple store formats planned for São Paulo. Each brand partnership generates additional supplier fees while increasing customer traffic and average transaction size.
Customer Acquisition Cost vs. Lifetime Gross Profit
This ecosystem structure is brilliant because it addresses the fundamental challenge all retailers face: customer acquisition cost (CAC) versus customer lifetime value.
Research consistently shows that acquiring a new customer costs 5-7 times more than retaining an existing one. In competitive fuel retail, CAC is particularly high because customers have numerous alternatives and brand switching is relatively frictionless. You cannot lock someone into buying your gasoline. However, Ipiranga’s ecosystem approach fundamentally changes the equation.
Let us walk through the mathematics (note that this is just an example as a walkthrough to my thought process, numbers are not meant to scale):
A typical fuel distributor acquires a customer through location convenience, pricing, and advertising. Let us say the blended CAC is $50 per customer when you account for location costs, marketing spend, and initial promotions. That customer might visit twice monthly, spending $60 per visit on fuel with a 5% net margin. Annual value: 24 visits x $60 x 5% = $72 gross profit.
Now layer on the ecosystem:
KMV loyalty program membership increases visit frequency by 12-18%. Same customer now visits 27-28 times annually instead of 24. That is an additional $216-$288 in annual fuel revenue.
AmPm convenience store visit on 30% of fuel stops. Average convenience purchase $8 with 40% margin = $3.20 gross profit per visit. At 8 convenience visits per year = $25.60 additional profit.
Jet Oil service once annually (oil change, filter). Average transaction $45 with 25% margin = $11.25 profit.
Loyalty program redemption partners generate $0.50-$1.00 per member annually through data monetization and partnership fees.
If the average customer relationship lasts 5 years (conservative, given loyalty program stickiness), the lifetime gross profit is $680. Against a $50 CAC, that is a 13.6:1 ratio. Even accounting for retention costs and churn, this is extraordinary unit economics.
Compare this to competitors who rely solely on fuel margins. They have the same $50 CAC but generate only $72 annually, or $360 over five years - a 7.2:1 ratio. Ultrapar generates nearly double the lifetime value from the same customer acquisition investment.
This is why the ecosystem matters. It is not about being clever or trendy. It is about fundamentally superior economics that compound over time as the customer base grows and matures within the loyalty program.
The Competitive Landscape: Ipiranga vs. Vibra vs. Raizen
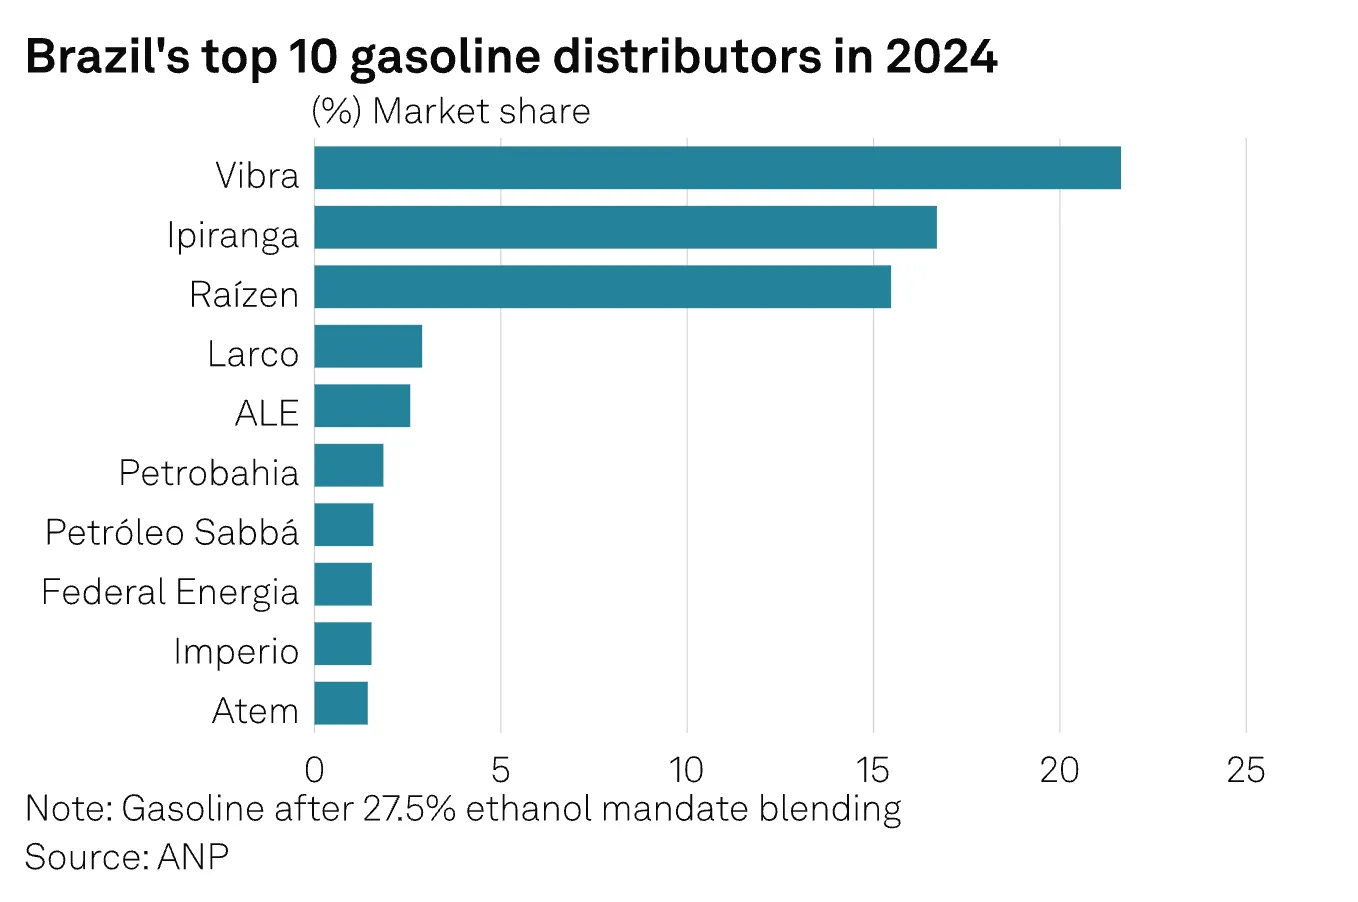
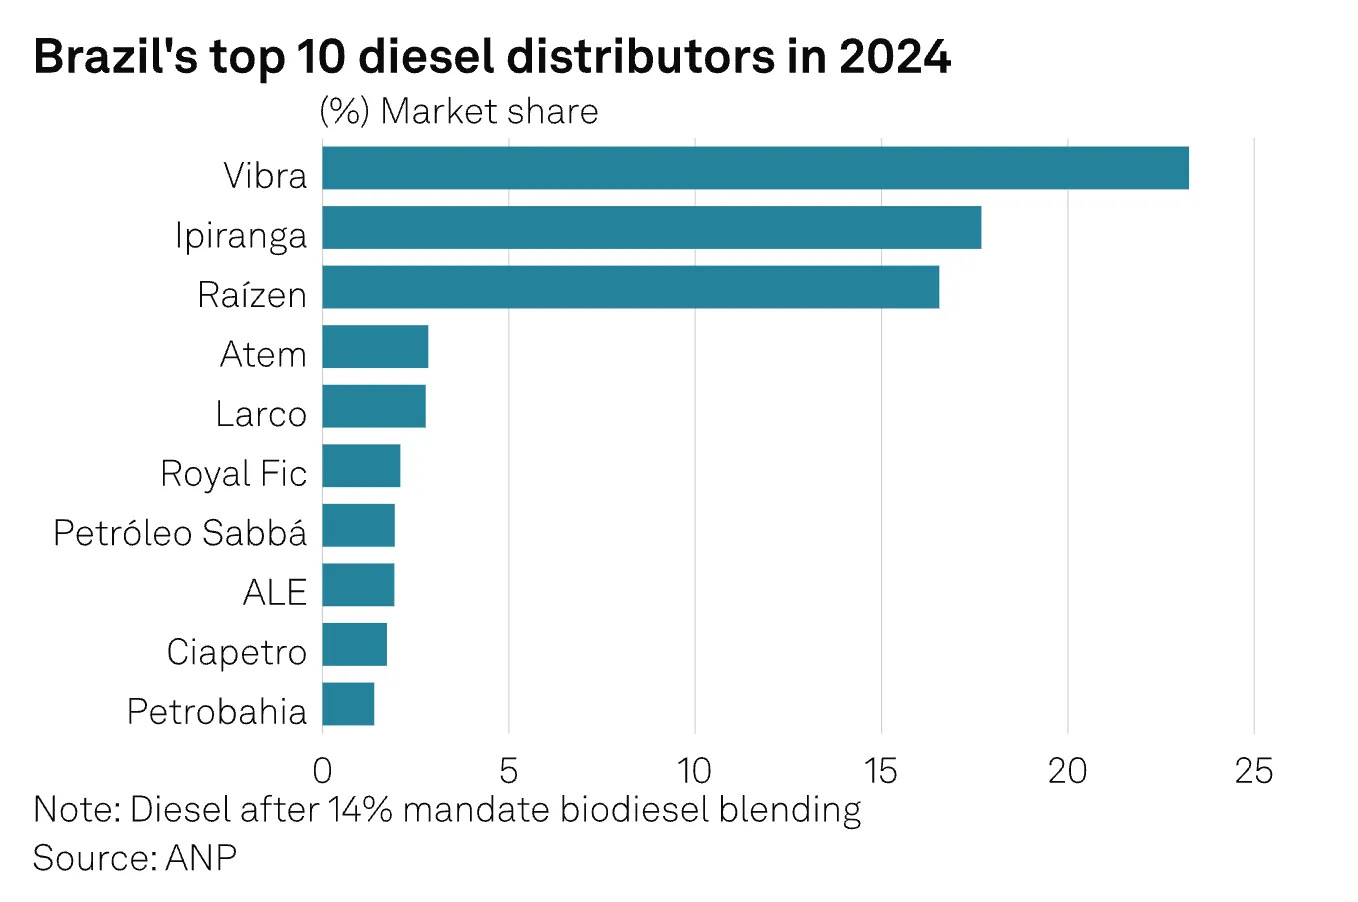
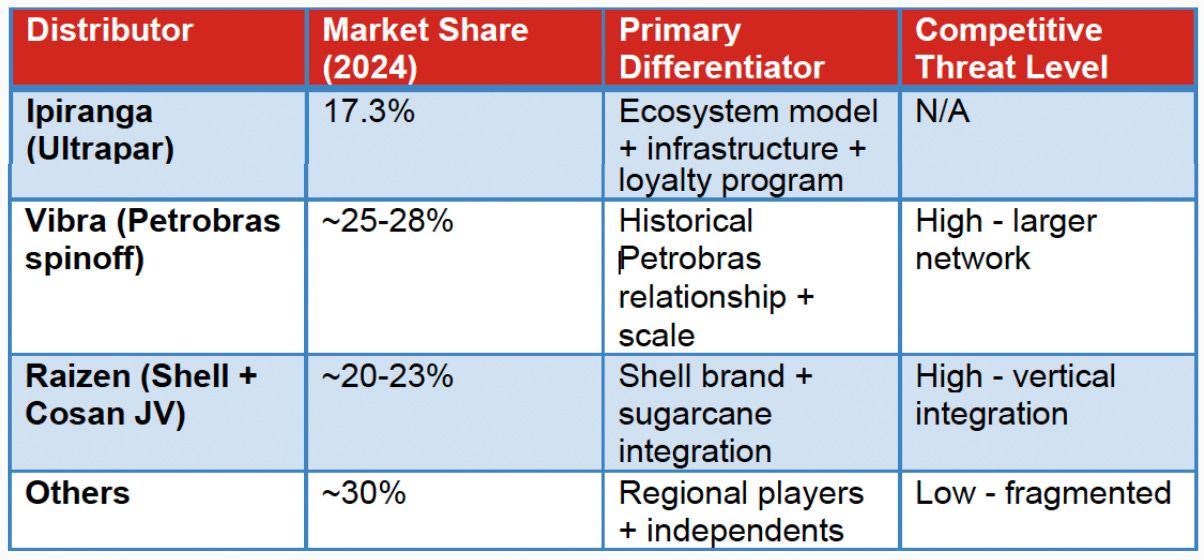
Ipiranga’s 17.3% market share makes it one of Brazil’s largest fuel distributors, but this is not a monopoly. Understanding the competitive dynamics requires examining who Ultrapar faces and where its advantages lie.
Vibra, formerly BR Distribuidora, emerged from Petrobras’s restructuring and maintains advantages from its legacy relationship with Brazil’s dominant oil company. With approximately 25-28% market share, Vibra operates the largest distribution network. However, Petrobras’s 2021 decision to end guaranteed fuel supply to the Brazilian market has diminished this advantage. All distributors now face similar supply chain challenges.
Raizen, a joint venture between Shell and Cosan, brings formidable competitive strengths. With 20-23% market share and Shell’s global brand, Raizen has deep pockets and international operational expertise. More critically, Raizen’s integration with sugarcane production through Cosan gives it unique advantages in ethanol distribution, a significant consideration in Brazil’s flex-fuel market.
What separates Ipiranga? Three things:
First, the franchise ecosystem. Neither Vibra nor Raizen has replicated AmPm’s scale (1,450 stores) or Jet Oil’s service network (1,120 franchises). While competitors have convenience store concepts, none has achieved the same penetration or the elegant economic model that results from Ipiranga’s operator-ownership structure (although this structure is common throughout Brazil).
Second, geographic positioning and infrastructure. This is where Ultracargo becomes strategically relevant despite contributing only 0.8% of revenue. More on this shortly.
Third, Km de Vantagens loyalty program strength. While all major distributors operate loyalty programs, KMV ranks among Brazil’s top 8 across all industries, not just fuel. The data moat this creates, enabling precision pricing, targeted promotions, and most importantly, increasing customer lifetime value and stickiness, represents a genuine competitive advantage.
That said, this is an oligopoly, not a monopoly. Vibra and Raizen are formidable, well-capitalized competitors with their own strategic advantages. Ipiranga must continuously defend and expand its position. This is not a sleepy utility collecting rents. It is a competitive market where execution matters.
The Hidden Infrastructure Advantage: Why Ultracargo and Storage Terminals Matters
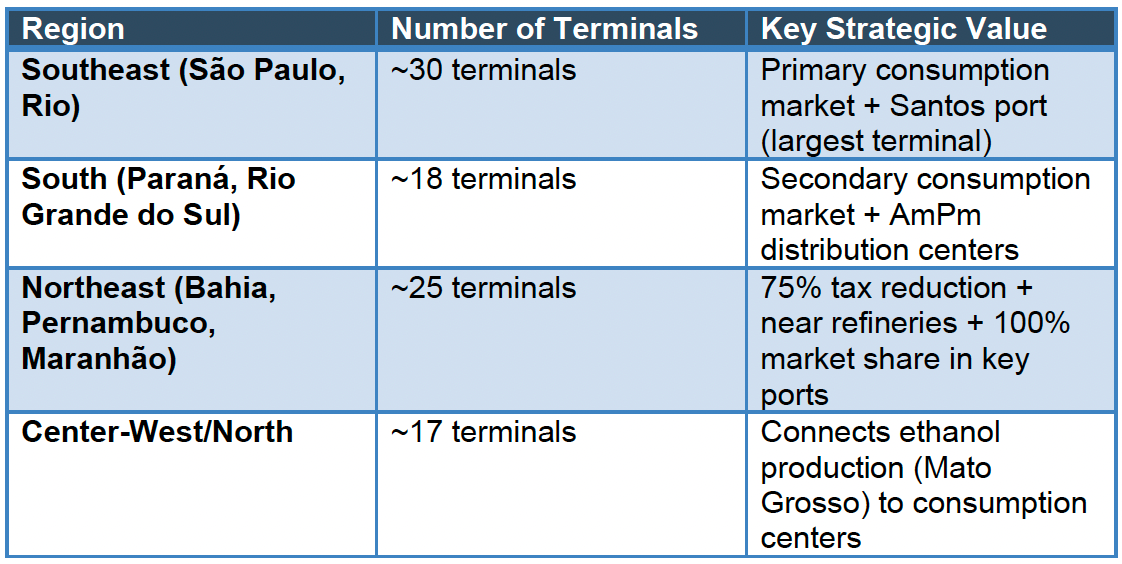
Market Share of Ultracargo and competitors
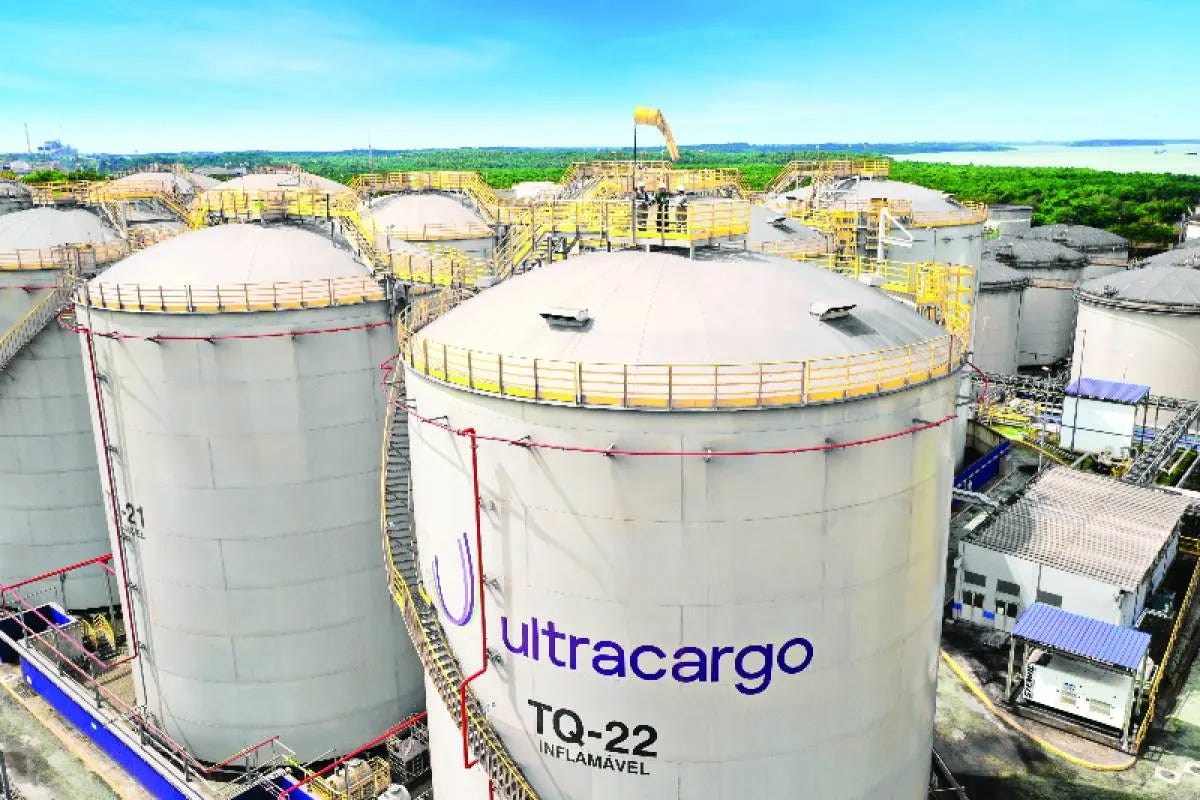
While most investors focus on Ipiranga’s retail-facing operations, Ultracargo, though tiny by revenue (0.8%), plays an outsized strategic role. This is infrastructure as competitive moat. Why? Because Ultracargo operates massive "gateway" terminals at major ports for long-term storage, while Ipiranga utilizes a much larger network of smaller distribution bases to move fuel to the end consumer.
8 Total liquid bulk storage terminals
Ipiranga itself operates 90 smaller storage terminals for fuel distribution with total capacity of 1.132 million cubic meters. But as in real estate, location is everything. These terminals are not randomly distributed. They are positioned along Brazil’s critical logistics corridors with surgical precision.
Thanks for reading Compounding Zero! Subscribe for free to receive new posts and support my work.
Let us examine why this positioning creates competitive advantages:
The São Paulo - Mato Grosso Logistics Corridor
The SP-MT corridor is critical for understanding Brazil’s fuel economics. Mato Grosso is a major corn ethanol production center. The Rondonópolis terminal serves as a key hub for transporting this ethanol to Paulínia in São Paulo, one of Brazil’s main storage and distribution hubs. From there, product flows to Greater São Paulo (Brazil’s largest consumption market) and the Port of Santos.
Santos is where Ultracargo’s largest storage terminal sits, strategically positioned to handle fuel imports and ethanol exports. This matters because since Petrobras stopped guaranteeing domestic fuel supply in 2021, distributors must source internationally. In 2024, 23% of diesel and 8% of gasoline in the Brazilian market were imported. Having established terminal capacity at the country’s busiest port is not just convenient - it is a competitive necessity.
Smaller competitors without Santos terminal access must either negotiate spot storage at higher rates or face logistical constraints during supply shortages. Ultrapar’s infrastructure converts a potential problem (import dependency) into a relative advantage.
The Northeast Tax Advantage
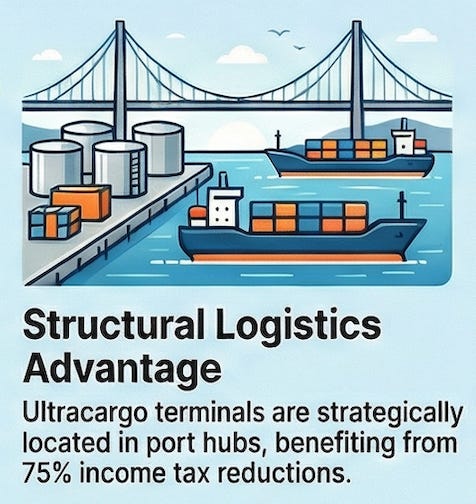
Brazilian legislation provides a 75% income tax reduction for businesses located in the Northeast region, subject to SUDENE approval. Ultracargo’s terminals at Itaqui, Suape, and Aratu enjoy this benefit until 2025, 2030, and 2032 respectively.
But tax benefits only matter if you have business to tax. Here is where market position matters:
Itaqui: 100% market share in storage capacity + 45% share of overall port activity
Aratu: 65% market share
Suape: 21% market share
The 100% market share in Rio de Janeiro and Vila do Conde, plus dominant positions in the Northeast, create genuine barriers to entry. You cannot simply build competing terminals. You need:
Regulatory approval from ANP (National Agency of Petroleum, Natural Gas and Biofuels) plus environmental clearances
Prime coastal or rail-connected real estate that may no longer be available
Years of bureaucratic navigation through Brazil’s complex regulatory environment
Massive capital investment with uncertain payback periods given established competition
The “know-how” and engineering expertise concerning proper coating and cooling temperatures of its tanks to avoid chemical reactions that could affect safety.
The company explicitly states this “enables competitive and efficient distribution and sales processes, dilution of advertising, marketing and new product development expenses, and gains from economies of scale in administrative functions”. This is not marketing speak, nor just “scale” that enables reduced cost. This is structural cost advantage.
Concentrated and strategically placed terminals close to refiners and the smaller “90 distribution terminals” (most in South, Northeast and Southeast of Brazil) → Reduces operating (e.g. admin, storage, distribution) costs of service stations & access to fuel market → Attractive franchising opportunities for landlord operators → More traffic points for service ecosystem (e.g. AmPm, JetOil, Krispy Kreme) as franchise service station increases → More attractive and valuable product mix for consumers, increasing customer lifetime value (especially in South & Southeast) → More franchisees/ distribution location → Increased requirements of fuel distribution in that specific region, leading to increased capacity and lower marginal costs → Cycle continues indefinitely…
Question 1: How Many Birds Are in the Bush?
This is where Ultrapar starts to look genuinely attractive. Let us examine the value proposition through the lens of fundamental metrics that matter.
The Numbers That Make Value Investors Pay Attention
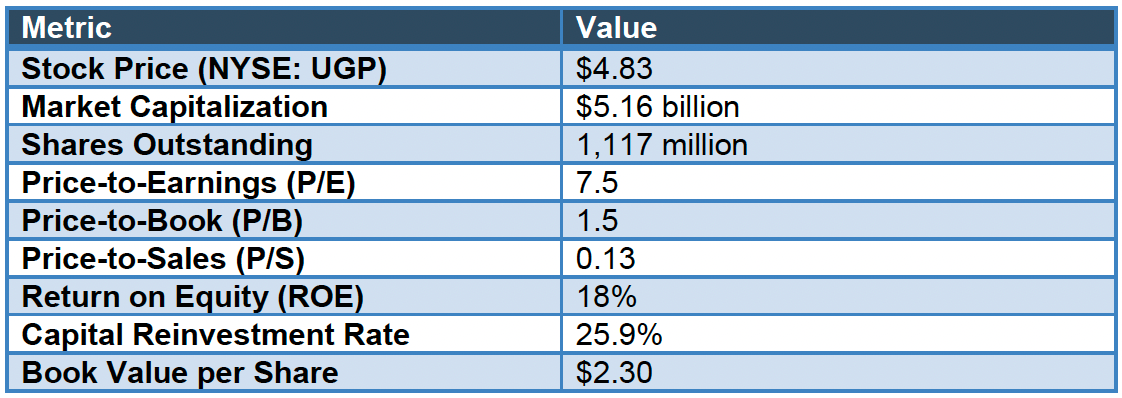
As of January 30, 2026, Ultrapar presents the following profile:
Let us unpack what these numbers actually tell us. A P/E of 7.5 means you are paying $7.50 for every dollar of annual earnings. An 18% ROE indicates the company generates $0.18 in profit for every dollar of shareholder equity - well above the 12-15% threshold typically considered excellent for established businesses.
The Capital Reinvestment Rate of 25.9% deserves explanation. This metric reveals how much capital the company can reinvest from 1 cycle of business to generate incremental-scalable earnings. In other words, this measures operating leverage. The calculation: $652 million average annual EBIT divided by working capital plus fixed assets (current assets of $2,630 million minus current liabilities of $1,720 million, plus PP&E of $1,444 million and goodwill of $161 million) equals 25.9%.
What does this mean? Ultrapar is able to reinvest approximately $0.26 of capital investment for each dollar required to keep the business running. This is respectable efficiency. For context, truly exceptional capital-light businesses like software might have reinvestment rates of 10-15%.
Revenue Resilience: The Diesel Story
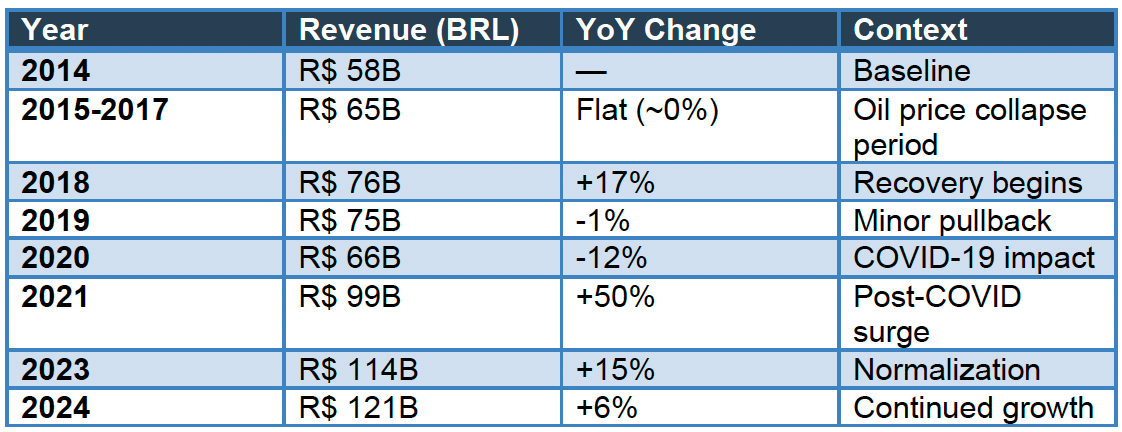
One of the most remarkable aspects of Ultrapar’s business - and this genuinely caught my attention - is the stability of Ipiranga’s revenue despite volatile oil prices. Here is the revenue trajectory for Ipiranga from 2014 to 2024 in Brazilian Reais:
This stability is remarkable for several reasons. Over the past decade, oil prices swung from over $100 per barrel to below $30 and back above $80. Yet Ipiranga’s revenue showed consistent growth with only one significant dip during COVID-19 (which did not really affect the business much). More impressively, gross profit, operating profit, and net income remained stable throughout. The analysis notes that neither gross, operating, nor net profits to shareholders were significantly negatively affected by the 2018 oil price dip when gross profit started declining.
How? The secret lies in fuel demand’s low price sensitivity (and the next section on flex fuel).
Diesel, which comprises over 50% of Ipiranga’s fuel sales, has an incredibly inelastic demand curve. Trucks need to run regardless of diesel prices. The economy does not stop because fuel costs more. The company’s own data reveals this stark reality: over the past five years, diesel volume standard deviation was approximately 6% while price volatility was 33%. Read that again - prices swing wildly at 33% volatility, but volumes barely budge at 6%.
This inelastic demand fundamentally changes the risk profile. In most commodity businesses, price volatility destroys volumes and margins simultaneously. Here, price volatility exists but volume stability persists. As long as Ipiranga can pass through cost changes to customers with minimal lag, margins remain relatively protected.
Additionally, Ipiranga benefits from regulatory tailwinds. Market share gains have occurred partly because stricter government crackdowns on organized crime and irregular fuel sales have created a more balanced and compliant market. Black market fuel operations, which avoid taxes and regulations, had eroded legitimate distributors’ market share. As enforcement improved, companies like Ultrapar recaptured share and improved margins.
The Brazil Pricing Dynamic: Understanding the Flex-Fuel Market
This section is absolutely critical to understanding both Ultrapar’s operational stability AND the ultimate investment conclusion. Brazil’s fuel market operates under unique dynamics that create natural price stabilization mechanisms not found elsewhere.
Thanks for reading Compounding Zero! Subscribe for free to receive new posts and support my work.
The 70% Rule and What It Means
Here is the key insight: Brazil mandates that all gasoline contain 27% anhydrous ethanol, adjustable between 22-35% based on Law No. 14,993/2024. But here is where it gets interesting - approximately 80% of Brazilian light vehicles are flex-fuel, meaning they can run on either gasoline-ethanol blend OR 100% hydrated ethanol.
To make things easy to understand, think of 2 fuels in the market.
Anhydrous gasoline which is a mix of Ethanol and Gasoline, and
100% Hydrated ethanol (which is pretty self explanatory; 100% ehtanol)
This creates a powerful market mechanism governed by what industry insiders call the 70% Rule: ethanol only makes economic sense for consumers when its price is 70% or less of gasoline’s price. Why 70%? Because ethanol contains approximately 30% less energy content than gasoline per liter. If ethanol costs more than 70% of gasoline’s price, consumers lose money using it and instantly switch to gasoline. Consumers typically switch to ethanol when its price is 70% or less than the gasoline price.
This ratio acts as an automatic price ceiling (and floor, since most Ethanol mills are hybrid - more on that later) with immediate market enforcement:
If gasoline prices rise too high relative to ethanol, consumers switch to ethanol en masse
Demand for gasoline collapses, forcing distributors to lower gasoline prices
If ethanol prices rise above the 70% threshold, consumers switch to gasoline
Ethanol demand collapses, forcing ethanol producers to lower prices
This is not theoretical. With 80% of light vehicles able to switch between fuels at will, the market response is immediate and brutal. Unlike other markets where consumers are locked into one fuel type and must absorb price increases, Brazilian consumers have genuine alternatives and use them.
Petrobras Pricing Policy and the Ethanol Ceiling
In May 2023, Petrobras formally ended its Import Parity Price (PPI) policy, which tied domestic fuel prices directly to international crude prices and the BRL/USD exchange rate. This policy had created frequent and significant volatility, hammering fuel distributors when sudden price spikes occurred.
The new Brazilianization policy aims to make domestic prices more stable and less reactive to short-term international fluctuations. Instead of strict import parity, the strategy uses two main references:
Customer’s alternative cost: What distributors would pay from other suppliers or imports
Marginal value for Petrobras: Internal production costs versus export opportunities
Here is where the flex-fuel market becomes strategically relevant. Because Brazilian customers can instantly switch to ethanol if gasoline becomes too expensive, ethanol’s price effectively acts as a domestic price ceiling for pure gasoline. Petrobras cannot simply raise gasoline prices to international parity if doing so triggers mass switching to ethanol, destroying demand.
This creates what economists call a soft price ceiling. Gasoline prices can rise, but only to the point where the 70% Rule keeps consumers from fleeing to ethanol. This mechanism has protected fuel distributors like Ipiranga from the extreme price spikes that devastate margins in other markets. The reverse can be said when oil prices slump.
Ethanol Production Flexibility: The Shock Absorber
You might reasonably ask: what if weather or agricultural shocks affect ethanol supply, disrupting these pricing dynamics? This is where Brazil’s sugarcane industry structure provides another layer of stability.
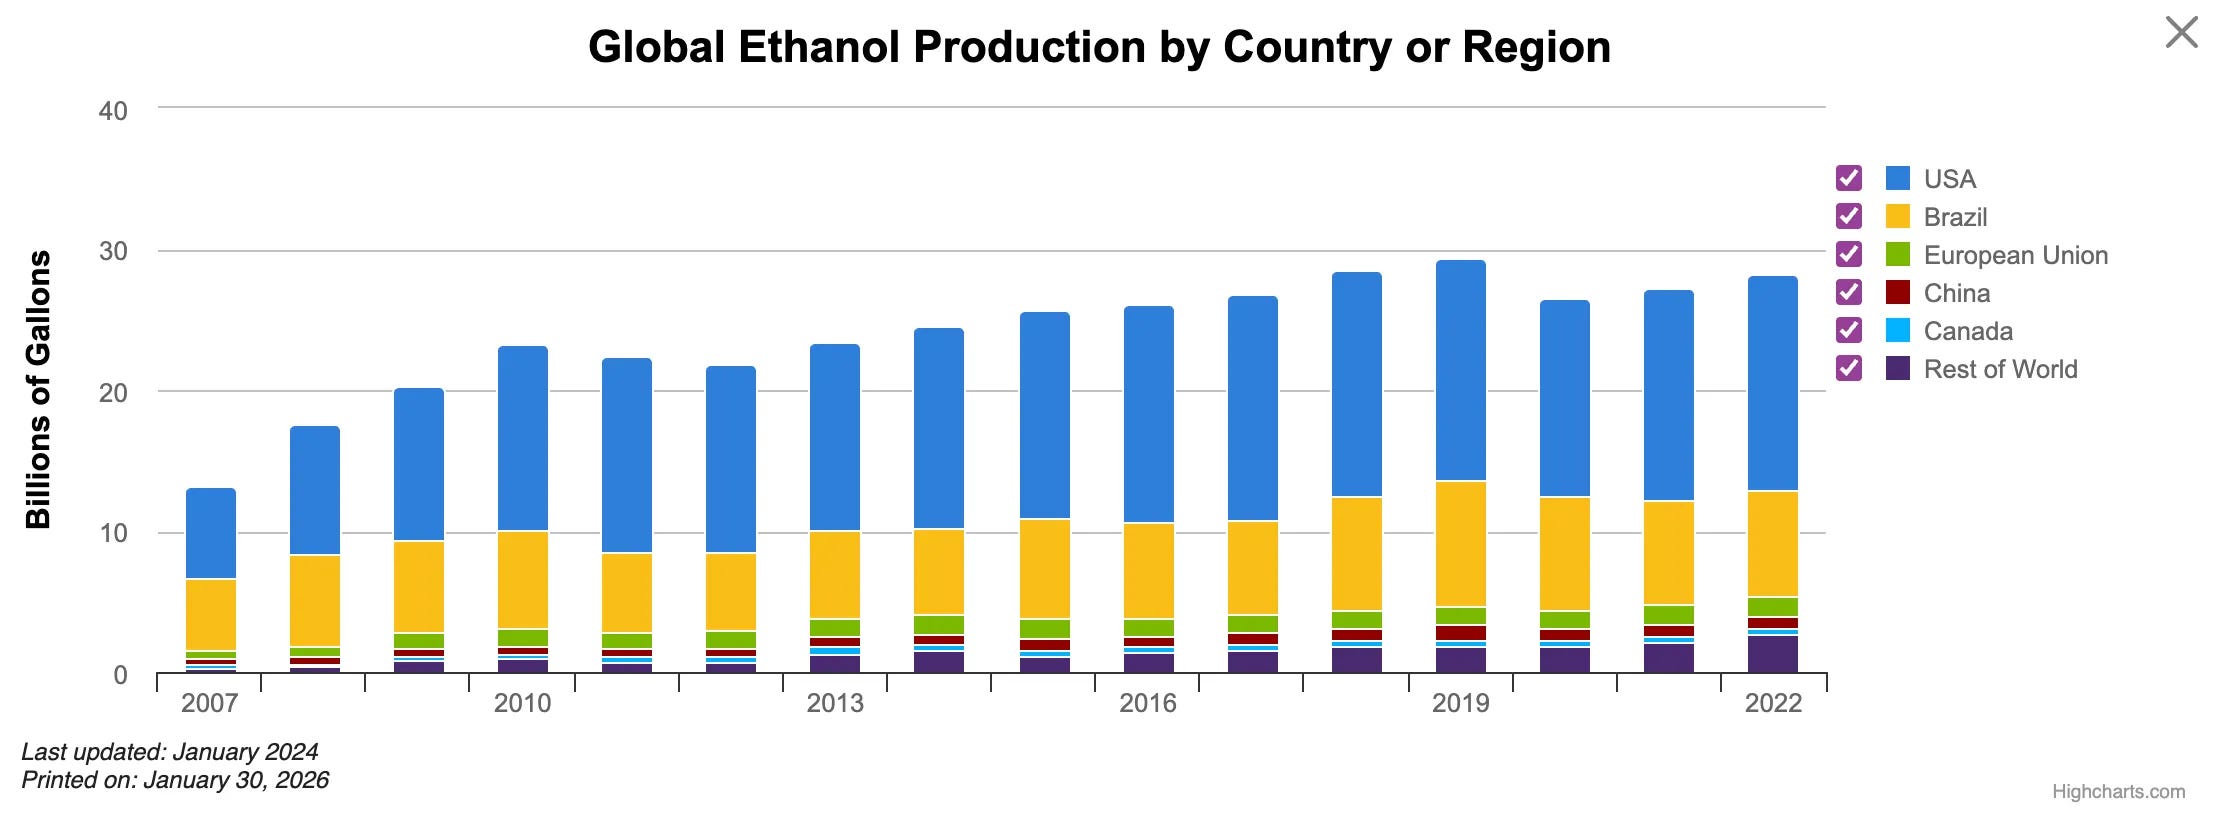
Brazilian mills produce two types of ethanol: (1) anhydrous ethanol for blending with gasoline, and (2) hydrated ethanol for flex-fuel vehicles. But these mills are not locked into ethanol production. They can switch between producing sugar and ethanol based on market conditions.
Here is how this stabilization mechanism works:
When international sugar prices are high, Brazilian mills shift production toward sugar, reducing ethanol supply. This normally would spike ethanol prices. But if ethanol prices rise too much, consumers switch to gasoline, collapsing ethanol demand and bringing prices back down. The threat of demand destruction limits how high ethanol prices can sustainably rise.
Conversely, when sugar prices are low, mills shift production toward ethanol, increasing supply and putting downward pressure on ethanol prices. More affordable ethanol makes the 70% Rule threshold easier to maintain, keeping pressure on gasoline prices.
Moreover, the entire industrial process from crushing sugarcane to finished fuel-grade ethanol takes approximately 24-72 hours. This rapid turnaround means supply can respond relatively quickly to demand shifts, unlike crude oil refining which involves longer lead times and more complex infrastructure.
The result: Brazilian ethanol prices are highly localized and regionalized, influenced by local supply, logistics, seasonal sugarcane harvest, and competition with local gasoline prices rather than being directly pegged to global energy benchmarks. Much like LPG, ethanol pricing in Brazil is determined by regional supply dynamics, not global oil markets.
If you spread out ethanol prices on a yearly basis, they do not differ dramatically because Brazil can easily switch between ethanol and sugar production, especially if ethanol price instability would threaten domestic economic wellbeing.
In short, because of Brazil’s significant Flex-fuel market, and Hybrid mills capability, Ethanol is a significant substitute for Gasoline oil products and is able to absorb global market volatility, resulting in Ultrapar’s relatively stable operations.
Import Dependency and Supply Chain Resilience
Since late 2021, Petrobras announced it would no longer guarantee full fuel supply to the Brazilian market, forcing distributors to purchase portions of their fuel needs internationally. In 2024, 23% of diesel and 8% of gasoline in the Brazilian market were imported.
This introduces margin volatility when import prices diverge from Petrobras domestic prices. However, several factors mitigate this risk:
This risk affects ALL Brazilian distributors equally - it is not specific to Ultrapar
Larger distributors like Ipiranga with established international purchasing relationships and storage capacity are better positioned
Ultracargo’s Santos terminal provides direct import capability at Brazil’s busiest port
The imported percentages remain relatively small (23% diesel, 8% gasoline), so domestic pricing still dominates
More importantly, the flex-fuel market mechanism still applies. If import costs drive gasoline prices too high relative to ethanol, consumers switch. This caps the margin volatility distributors can experience. They cannot simply pass through unlimited import cost increases without triggering demand destruction.
The only major risk here is if Brazil itself produces too much of oil supply itself and there is almost 0 international demand for it. In such a case, oil fuels would be a strong substitute for flex-fuel vehicles and the market will face a strong price slump, thereby significantly reducing Ipiranga’s margins.
Why This Matters for Investment Analysis
The flex-fuel market dynamics accomplish two critical things for Ultrapar’s investment case:
First, they provide operational stability. Revenue volatility in the 6% range despite 33% price volatility is extraordinary for a commodity distribution business. The flex-fuel market prevents the kind of devastating margin compression that destroys value in other fuel markets.
Second, and this is crucial for later discussion, they create a Brazil-specific dynamic that does not exist elsewhere. This unique market structure means analyzing Ultrapar requires understanding Brazil - its agricultural sector, its fuel policy, its consumer behavior, and ultimately, its macroeconomic trajectory.
This Brazil-specificity cuts both ways. It provides operational protection and margin stability. But it also means your investment returns are inextricably tied to Brazil’s economic fate. You cannot separate Ultrapar’s business quality from Brazil’s currency and fiscal sustainability. Remember this - it becomes the central issue.
If you like this analysis, remember to read part 2 xD