
The Magnera Corporation Analysis Nobody Asked For (But Everyone Needs)

Date Analyzed: September 25, 2025
Price at Analysis: $9.00
Market Cap: $320M
Shares Outstanding: 35.6M
“The difference between successful people and really successful people is that really successful people say no to almost everything.” — Warren Buffett
Introduction: The Magnificent Merger That Wasn’t
Picture this: Two venerable companies, each with over 80 years of history, combine to create the “world’s largest nonwovens company.” Press releases trumpet “distinct scale,” “comprehensive portfolio,” and “new possibilities made real.” Wall Street analysts nod approvingly. The merger closes in November 2024. The stock debuts at $14-15.
By September 2025—ten months later—the stock trades at $9.
What happened?
The same thing that always happens when you try to build a skyscraper on quicksand: gravity wins. In this case, the quicksand was $2 billion in debt, and gravity was the brutal math of interest coverage ratios.
This is the story of Magnera Corporation (NYSE: MAGN), a specialty materials company that makes genuinely useful products—surgical gowns, baby diapers, building wrap, food packaging—but structured itself in a way that makes the equity essentially uninvestable.
Let me show you why I rejected this after extensive analysis, despite the compelling technology and market opportunities.
What Magnera Actually Does: The Unsexy Business of Nonwovens
Before we dissect the financial carnage, let’s understand what makes Magnera’s business interesting—because it genuinely is interesting, even if the capital structure is catastrophic.
Nonwovens: The Fabric of Modern Life (That Nobody Thinks About)
Every day you interact with nonwoven materials without noticing:
The surgical mask your doctor wears
The diaper on a baby
The Swiffer pad cleaning your floor
The house wrap protecting your home’s walls
The tea bag steeping in your cup
The wipe you use to clean your glasses
These aren’t woven fabrics (threads interlaced on a loom). They’re engineered materials made by bonding fibers together using mechanical, thermal, or chemical processes.
Magnera’s Three Technology Platforms:
1. Airlaid Materials (Key Revenue Driver)
Think of airlaid as a “dry papermaking” process. Cellulose fibers are suspended in air, then deposited onto a moving screen where they form a web. The result: ultra-absorbent, soft materials perfect for:
Feminine hygiene products (pads, liners)
Baby diapers (the absorbent core)
Adult incontinence products
Tabletop products (napkins, placemats)
Specialty wipes
Why customers buy from Magnera:
High absorbency (can hold 10-15x their weight in liquid)
Softness (matters for products touching skin)
Consistent quality (each roll performs identically)
Customization (thickness, strength, absorbency tuned to application)
2. Composite Fibers
Combining different fiber types creates materials with properties neither fiber has alone. Like alloying metals—bronze isn’t just copper or tin, it’s something better than either.
Applications:
Specialty filtration
Industrial applications
Technical textiles
3. Spunlace
High-pressure water jets entangle fibers mechanically (no chemical binders needed). This creates:
Strong but soft materials
Environmentally friendly (easier to recycle/compost)
Excellent for wet wipes, medical wipes, household cleaning
Magnera’s Brand Portfolio:
TYPAR®: Building wrap and construction materials
Sontara®: Industrial wipers and cleanroom fabrics (recently won IDEA Long-Life Achievement Award)
Airlaid Materials: Private label for hygiene brands
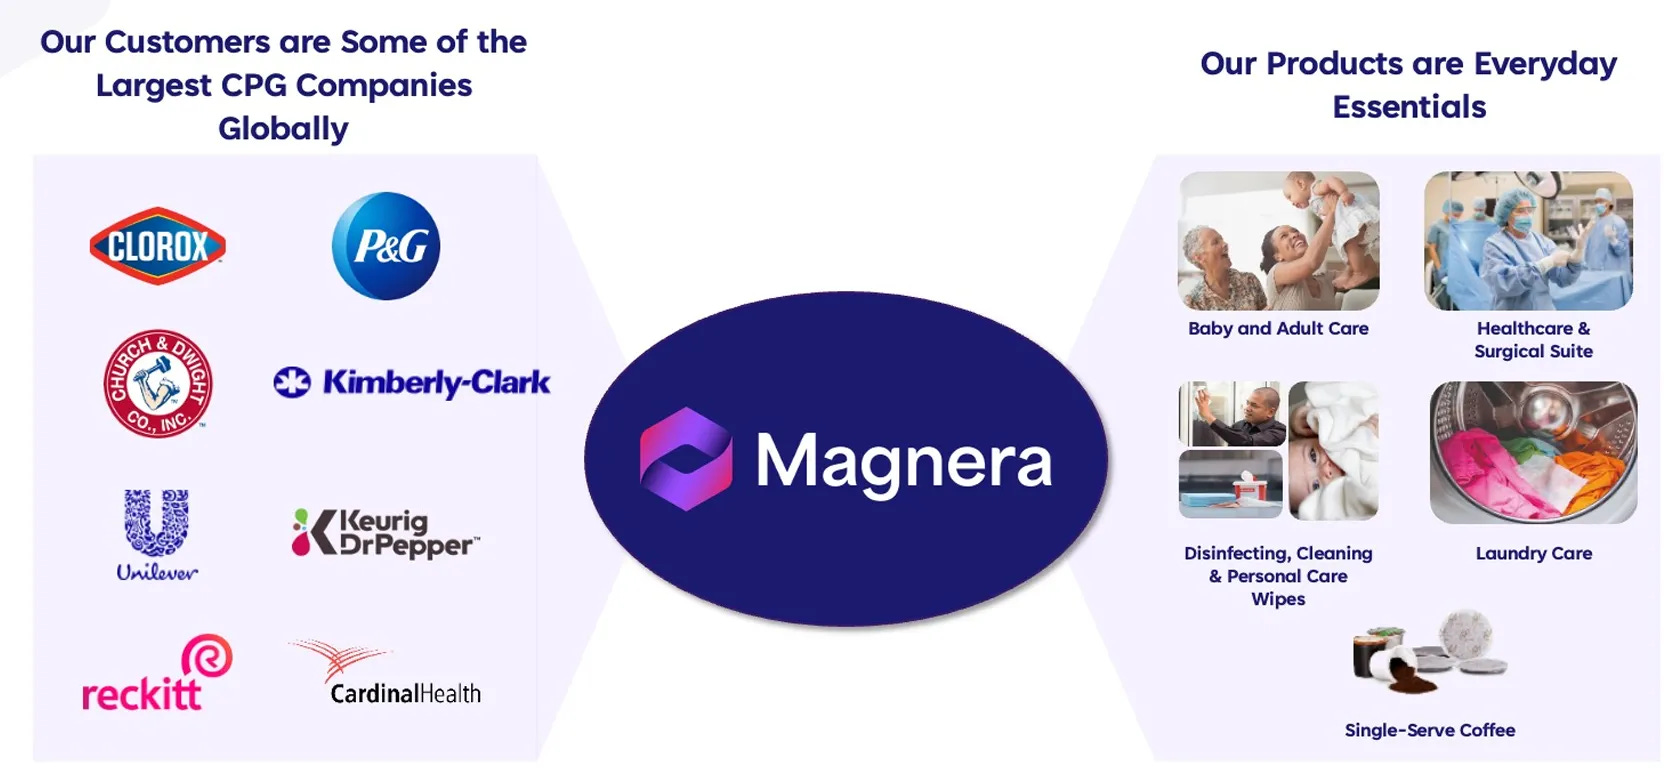
The Customer Base:
1,000+ customers worldwide
Consumer product manufacturers (Procter & Gamble, Kimberly-Clark types)
Healthcare providers (hospitals, medical suppliers)
Food & beverage companies (filtration, packaging)
Construction companies (building materials)
Recent Innovation (December 2025):
Magnera launched PFAS-free fluid-repellent solutions for healthcare textiles. This is genuinely significant—PFAS (”forever chemicals”) are being banned globally due to environmental and health concerns. Several U.S. states enacted bans with 2025 compliance deadlines.
Magnera’s solution delivers fluid repellency for surgical gowns and drapes without PFAS, positioning them ahead of regulatory curve.
The Market Opportunity:
The global nonwovens market is large and growing:
Healthcare (aging populations need more hygiene products)
Sustainability (shift from plastic to fiber-based materials)
Emerging markets (rising middle class demanding better hygiene standards)
So far, so good. Magnera has real technology, growing markets, and essential products. The business itself isn’t broken.
The capital structure, however...
The Merger That Created a Debt Monster
On November 4, 2024, Glatfelter Corporation (old ticker: GLT) merged with Berry Global’s Health, Hygiene and Specialties Global Nonwovens and Films business (a mouthful, abbreviated “HHNF Business”).
The combination created Magnera—trading under new ticker MAGN starting November 5, 2024.
The Deal Structure:
Berry Global essentially spun off its nonwovens division and combined it with Glatfelter. The merger was structured as:
Berry got cash and/or equity
Glatfelter shareholders got diluted significantly
The new entity (Magnera) took on substantial debt to fund the transaction
Post-Merger Balance Sheet (as of Q3 2025):
Total Debt: $1.999 billion
Cash: $276 million
Net Debt: $1.723 billion
TTM EBITDA: ~$440-450 million (estimated)
Leverage Ratio: 3.9x (Net Debt ÷ EBITDA)
That leverage ratio is the problem. In specialty materials—a cyclical, commoditized industry—3.9x leverage is playing with fire.
Why the Debt?
Transaction financing (buying Berry’s business wasn’t free)
Integration costs (combining systems, facilities, people)
Working capital (running a larger combined operation)
Legacy debt (both companies had debt pre-merger)
The Financial Performance: A Post-Merger Disaster
Let me walk you through what happened to Magnera’s financial performance post-merger using the actual numbers.
Q3 2025 Results (Released August 6, 2025):
The Good News:
Revenue: $839 million (+51% year-over-year!)
The Bad News:
That 51% increase was entirely from the merger adding $320 million
Organic growth: Negative 5% (volumes declining)
Operating Income: $13 million (1.5% margin—barely profitable)
Net Loss: $(18) million
EPS: $(0.51) versus $(0.03) expected
Miss Severity: 1,800% negative surprise!
The stock fell 5.5% that day in regular trading, then another 9.3% in premarket the next day. Investors were not amused.
What Killed Profitability?
1. Interest Expense Explosion
Post-merger interest expense increased $36 million compared to prior year quarter.
Let’s do the math:
Total debt: $1.999 billion
Average interest rate: ~6-7% (estimated blend of different facilities)
Annual interest expense: ~$130-140 million
On $839M quarterly revenue, that’s $32-35M per quarter in interest—eating almost everything.
2. Transaction Costs
Mergers are expensive: legal fees, banker fees, severance, integration consultants, system conversions.
Q3 2025: $14 million in transaction costs (more than tripled from prior year).
3. Organic Volume Declines
Strip out the merger contribution, and:
Americas segment: -6% organic volume decline
Rest of World segment: -3% organic volume decline
Why Are Volumes Falling?
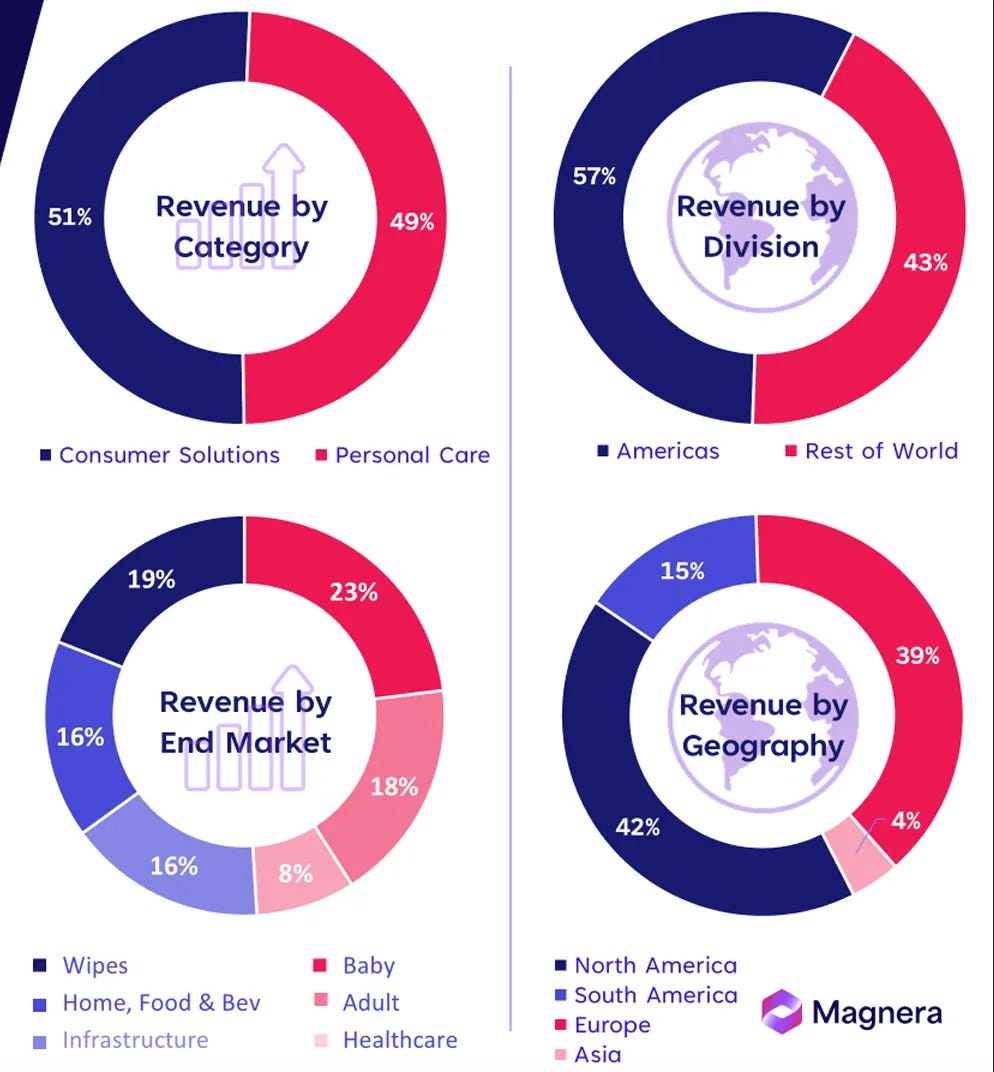
Americas (57% of revenue):
Competitive pressure from imports in South America
Brazilian and Argentine competitors with lower costs
Unfavorable product mix (lower-margin products growing faster)
Rest of World (43% of revenue):
General market softness in Europe
Energy costs (though improving from peak inflation)
Weak consumer demand
4. Working Capital Deterioration
Inventories climbed to $535 million—management said they’re aligning production with “softer demand.”
Translation: They built too much product, demand fell short, now they’re sitting on expensive inventory while paying interest on the debt used to finance it.
The ROE Collapse: A Picture Worth a Thousand Words
Let me show you what happened to Magnera’s return metrics.
Return on Equity (ROE):

Pre-2021 (Glatfelter standalone): Healthy positive ROE
    → Company was profitable, creating shareholder value

2021-2023: ROE declining steadily
    → Margins compressing, profitability weakening

2024 (post-merger): ROE turns deeply negative
    → Company destroying shareholder value
    → Every dollar of shareholder equity generates negative returns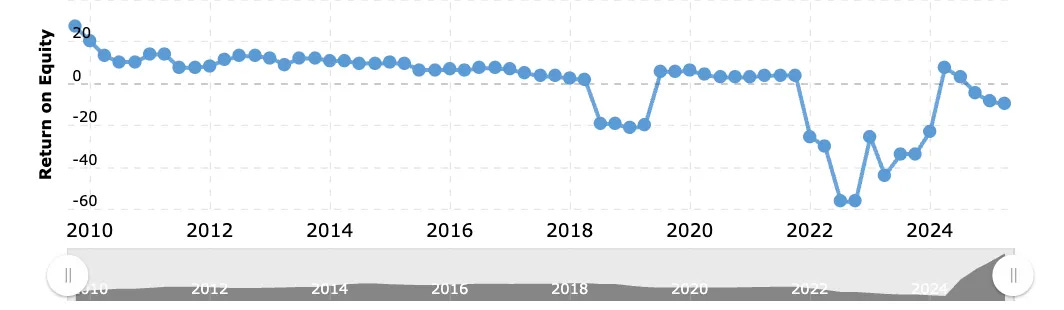
2025: ROE remains negative
    → The merger made it worse, not better
When ROE goes negative, you’re burning shareholder capital. Every quarter that passes, the book value per share effectively shrinks (or grows more slowly than inflation), meaning equity holders lose purchasing power.
Return on Assets (ROA):

Pre-2021: Positive ROA
    → Assets generating returns

2021-2024: ROA deteriorating
    → Same assets, worse returns
    → Suggests operational problems, not just leverage

2025: ROA still depressed
    → Even the underlying business isn't performing well
This tells us the problems aren’t just capital structure (debt). The operations themselves are struggling.
Return on Invested Capital (ROIC):

Interestingly: ROIC has remained decent
    → NOPAT (Net Operating Profit After Tax) is reasonable
    → OR invested capital base is low
The Divergence Tells the Story:
ROIC (decent) measures operating performance
ROE (terrible) measures returns to equity holders after debt
When ROIC is okay but ROE is catastrophic, the gap is debt service. All the operating profits get vacuumed up by interest payments, leaving nothing for shareholders.
The Losses: Breaking Down the Bloodshed
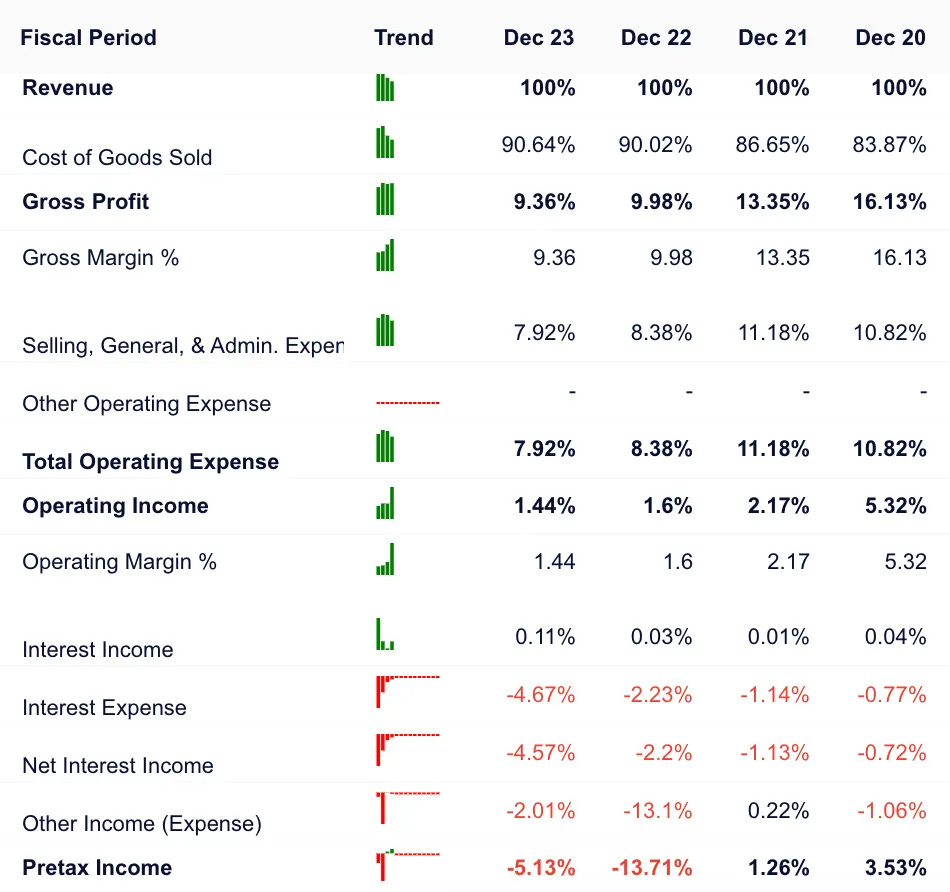
Let me decompose exactly where the money went:
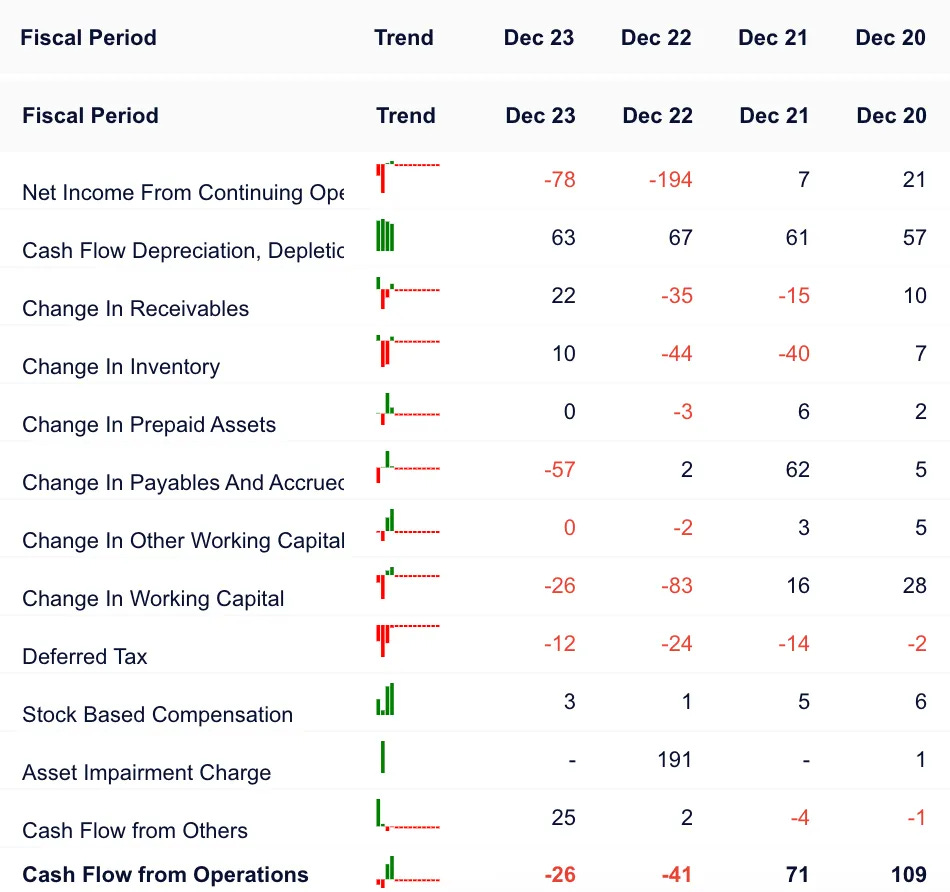
Fiscal 2022:
Reported Net Loss: $194 million
Add back: Depreciation: $67 million
EBITDA equivalent: Lost $127 million
The company was bleeding cash at the operational level—even before paying interest!
Fiscal 2023:
Reported Net Loss: $78 million (improving, but still bad)
Add back: Depreciation: $63 million
EBITDA equivalent: Lost $15 million
Getting better, but still operationally unprofitable.
Fiscal 2024 (with merger impact):
Reported Net Loss: $159 million
The merger made losses worse, not better
What’s Eating Profits?
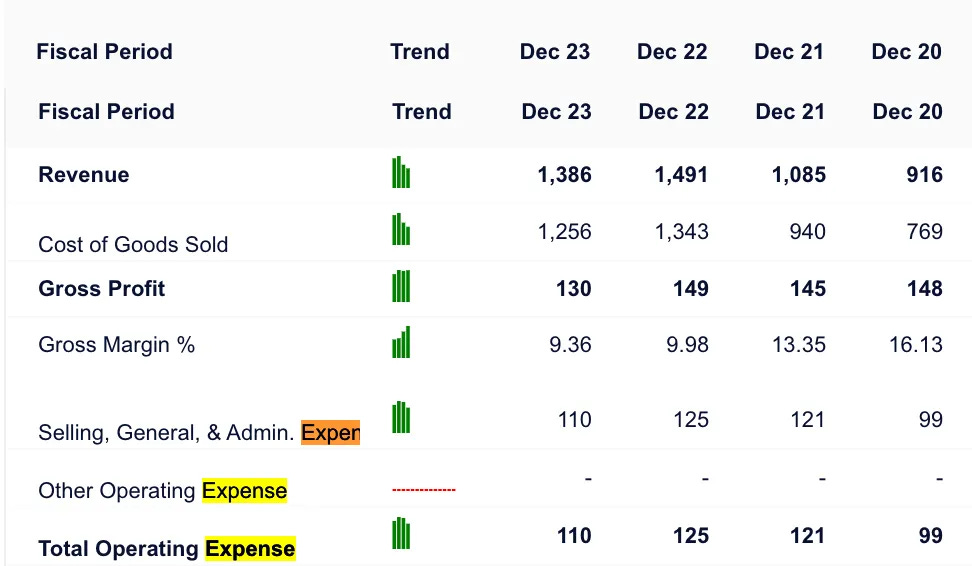
According to my analysis, net margins declined due to factors after operating profit:
Interest Expense (the killer—more on this shortly)
Non-operating expenses (restructuring, transaction costs)
Depreciation and amortization (high from merger accounting)
Working capital changes (inventory building up)
Capital expenditures (maintaining 46 facilities globally)
The Troubling Detail:
“Other expenses” increased significantly in 2022 and 2023—management doesn’t clearly explain what these are. When companies bury rising costs in “other,” that’s usually not good.
Capex and PP&E (Property, Plant, Equipment) remained relatively constant, so they’re not starving the business or over-investing. The problems are operational execution and cost structure.
Project CORE: The Turnaround Plan (Or Is It?)
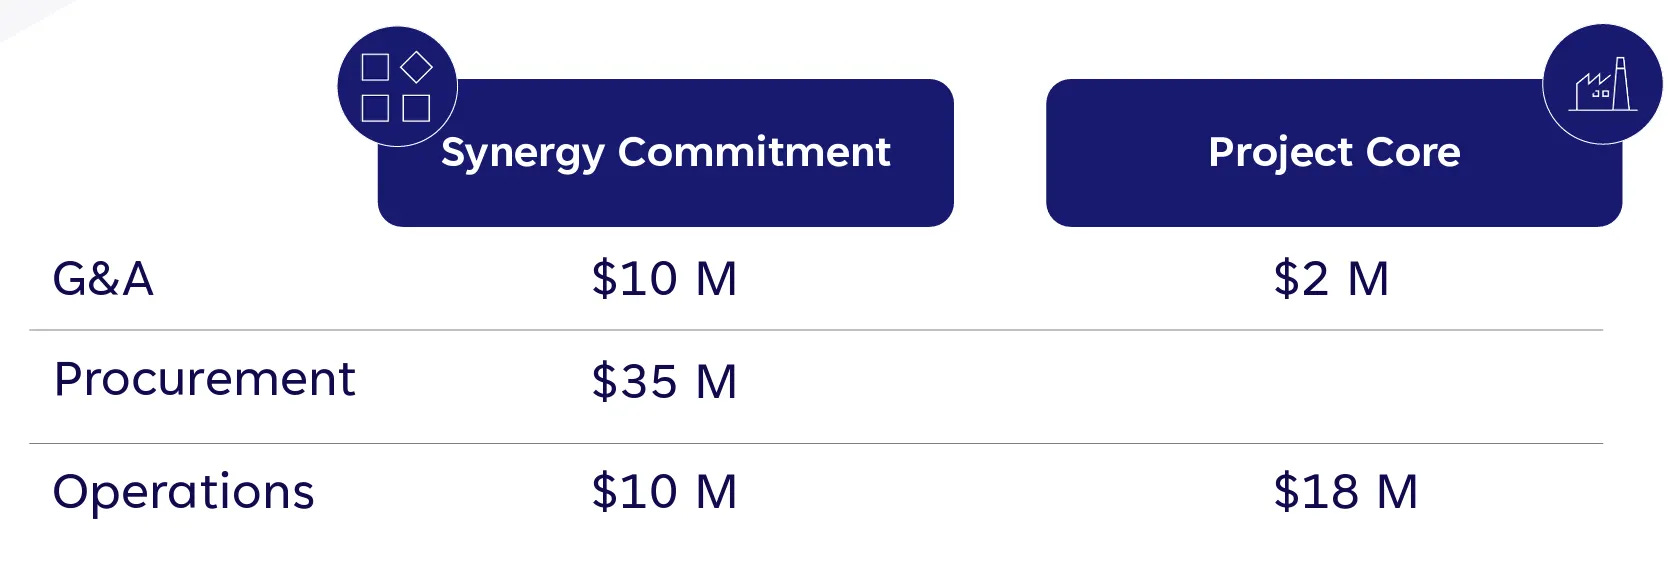
Facing mounting losses and investor pressure, management announced “Project CORE” in 2025:
Capacity
Optimization and
Resource
Efficiency
(Someone got paid good money to create that acronym.)
The Plan:
Restructuring Investment:
Cost: $20 million over two years
Timeline: Fiscal 2025-2026
Expected Savings:
Gross savings: $95 million
Net of restructuring costs: $75 million
Annual run-rate: $75 million/year once fully implemented
That is about 70% of cost reduction. But how much of that is really true? and realizable?
Actions:
September 29, 2025: Announced closure of Pilar, Argentina facility as part of Project CORE
Employees affected: 60+
Rationale: “Strategic exit aligns with goals to streamline global footprint”
Translation: The plant was losing money, exit South America exposure
Other actions:
Capacity rationalization (close underutilized plants)
Workforce optimization (layoffs)
Equipment utilization improvement (run fewer machines harder)
Management’s Pitch:
CEO Curt Begle: “By executing our Capacity Optimization and Resource Efficiency program (Project CORE) and delivering on our synergy commitments, we are confident in our ability to drive long-term sustainable growth.”
Translation: “We’re cutting costs to survive until markets improve.”
The Debt Problem: Interest Coverage Math from Hell

Here’s where this entire thesis dies—in the brutal arithmetic of debt service.
Current Situation (Q3 2025):
EBITDA: Let’s use management’s guidance of $360-380 million for full-year FY2025.
Quarterly: ~$90-95 million
Annually: $360-380 million
Depreciation & Amortization: Approximately $250-260 million annually (estimated from financials)
EBIT (Earnings Before Interest and Tax):
EBITDA: $360-380M
Less: D&A of $250-260M
EBIT: $100-130 million
Interest Expense: ~$130-140 million annually (on $2B debt at ~7% average rate)
Interest Coverage Ratio (EBIT ÷ Interest):
Best case: $130M ÷ $130M = 1.0x
Worst case: $100M ÷ $140M = 0.7x
What This Means:
At 1.0x interest coverage, 100% of operating profits go to debt holders. There’s literally nothing left for equity.
At 0.7x, the company can’t even cover interest from operations—they’re either drawing down cash reserves, selling assets, or violating covenants.
The Rule of Thumb:
5x+: Very healthy (interest is 20% of earnings)
3x+: Acceptable (interest is 33% of earnings)
2-3x: Getting tight (interest is 40-50% of earnings)
1.5-2x: Danger zone (interest is 50-67% of earnings)
Below 1.5x: Default imminent
Magnera’s Coverage: ~1.0x or less
This is catastrophically bad. One bad quarter and they breach covenants.
My analysis notes flagged this:
“Interest coverage ratio had been relatively horrible, dropping below 3 after 2021. This means that Earnings is only equivalent of 31% of interest payable on debt (which is pretty dangerous).”
Translation: In good times, they can barely afford the debt. In bad times, they can’t.
The Valuation Question: Is There Hidden Value?
Despite the debt disaster, let me work through whether there’s investment value here. Maybe the market is overreacting?
The Bull Case Math:
Current EBITDA (Adjusted): $330 million (management reports this with add-backs)
Pro Forma with Project CORE:
Current: $330 million
Plus: $75 million savings
Pro Forma EBITDA: $405 million
But Wait—What About Revenue Growth?
Management hopes organic revenue recovery plus innovation (PFAS-free products, new customers) adds to EBITDA. Some analysts estimate $438 million pro forma EBITDA if volumes recover.
Let’s use $405-438 million as the bull case range.
Valuation at Different Multiples:
Scenario 1: Using EV/EBITDA Multiple
Specialty materials companies trade at 5-8x EBITDA depending on growth and profitability. For Magnera:
Growth: Negative organic growth (bad)
Profitability: Breakeven to low margins (bad)
Debt: Highly levered (bad)
Appropriate multiple: 4-5x EBITDA (distressed/turnaround valuation)
Enterprise Value:
At 4x: $405M × 4 = $1.62B
At 5x: $405M × 5 = $2.03B
Equity Value (EV - Net Debt):
At 4x: $1.62B - $1.72B = -$100M (equity is worthless!)
At 5x: $2.03B - $1.72B = $310M
Per Share (35.6M shares):
At 4x: $0 (equity wiped out)
At 5x: $310M ÷ 35.6M = $8.70/share
Current price: $9.00
Implied upside at 5x multiple: -3% (you lose money!)
Scenario 2: Using Optimistic $438M EBITDA
Enterprise Value at 5x: $438M × 5 = $2.19B
Equity Value: $2.19B - $1.72B = $470M
Per Share: $470M ÷ 35.6M = $13.20
Current price: $9.00
Implied upside: 47% (or 1.47x return) this is too risky, moreover with a speculated pro-forma analysis (it is not a bet i am willing to take).
Why I Rejected It: Three Fatal Flaws
Despite potential 47% upside in the bull case, I rejected Magnera for three critical reasons:
Fatal Flaw #1: Insufficient Margin of Safety
From my analysis notes:
“Firstly, a 50% increment is a small margin of safety especially with only a 178 day option period.”
For a LEAPs strategy (long-dated call options expiring in 12-24 months), I need 2x+ returns to compensate for:
Time decay (options lose value as expiration approaches)
Execution risk (Project CORE must deliver exactly as promised)
Opportunity cost (capital locked up in uncertain turnaround)
At 1.5x maximum upside (best case), the risk/reward doesn’t justify the position.
Why 2x Minimum?
When you buy a 2-year LEAP, you’re paying for:
Intrinsic value (how much the stock is above strike price)
Time value (premium for the optionality)
As time passes, time value decays exponentially—especially in the last 6 months. To offset this decay and generate positive returns, the stock must move significantly.
Rule of Thumb: Stock needs to move 50-100% just to break even on most LEAPs after time decay. To make meaningful money, you need 2-3x stock moves.
At 1.5x upside, you’re betting on perfection—and Magnera’s track record suggests perfection is unlikely.
Fatal Flaw #2: The Cash Flow Trap
From my notes:
“Secondly, because of cash flow issues, the margin of safety is small. Interests still have to be financed and that means capital can’t be recycled for growth. Financials are relatively poor and working capital has recently increased as well.”
Even if EBITDA improves to $405M as Project CORE promises, the debt service eats everything.
The Cash Flow Waterfall:
EBITDA: $405 million (pro forma with savings)
Less: Interest expense: -$135 million
Less: Taxes: -$15 million (minimal since barely profitable)
Less: Capex (maintain facilities): -$80 million (estimated)
Less: Working capital increases: -$50 million (inventory, receivables)
Free Cash Flow: $125 million
That’s only $125M of cash available for:
Debt paydown (priority #1)
Growth investments (if anything left)
Shareholder returns (forget about it)
The Problem: At $125M annual FCF with $1.72B net debt, it takes 13.8 years to pay off the debt.
During those 13.8 years:
Debt matures (most facilities mature 2027-2030, requiring refinancing)
Interest rates could rise (making refinancing expensive)
Operational problems could emerge (markets are cyclical)
Competition intensifies (South America import pressure already visible)
The company is trapped in a debt spiral with no flexibility for growth or setbacks.
Fatal Flaw #3: Execution Uncertainty
From my notes:
“Thirdly, we are not sure if they can achieve this Pro-forma $14 value. There is no guarantees we can use.”
The $75 Million Question:
Project CORE promises $75M in net savings. But:
Track Record: Post-merger integration has been disastrous (volumes down, margins down, losses growing)
Restructuring Stats: Industry data shows restructuring programs typically deliver 50-70% of promised savings
Timeline: The $75M is over 2 years—immediate impact is smaller
One-Time vs. Recurring: Some “savings” might be one-time asset sales, not recurring cost reductions
Realistic Scenario:
Year 1: Achieve 30% of promised savings = $23M
Year 2: Achieve additional 30% = another $23M
Year 3: Achieve remaining 20% = $15M (some promises never materialize)
Total Achieved: $60M out of $75M promised (80% realization)
Pro Forma EBITDA (Realistic):
Current: $330M (adjusted)
Realistic savings: $60M
Pro Forma: $390M
At 5x multiple:
EV: $1.95B
Equity value: $230M
Per share: $6.47
Current price: $9.00
You’re paying $9 for something worth $6.47 if you assume 80% execution success.
This is a value trap, not a value investment.
The Management Track Record: Red Flags Everywhere
Let’s examine whether management can execute, using their own track record:
Pre-Merger (Glatfelter):
2021-2023: ROE turned negative (destroyed value for 3 straight years)
Volumes declining (market share losses)
Margins compressing (cost structure problems)
Post-Merger (Magnera):
Q1 2025: Results so bad they guided down
Q2 2025: Missed estimates again, guided down again
Q3 2025: Missed by 1,800% on EPS (not a typo!)
Stock down 40% from merger announcement
The Q3 2025 Earnings Call Disaster:
CEO Curt Begle tried to sound optimistic:
“Our value creation is simple, accelerate attractive revenue growth through innovation pipelines.”
But the numbers told a different story:
Revenue “growth” was 100% from merger (organic down 5%)
Innovation (PFAS-free products) won’t contribute meaningfully until 2026+
Adjusted EBITDA fell 9% on comparable basis
The Stock Market’s Verdict:
Post-earnings:
Regular trading: -5.5%
Premarket next day: -9.3%
Total: -14.3% in 24 hours
The market was screaming: “We don’t believe you.”
When Management Loses Credibility:
Once investors stop trusting management:
Stock trades at discount (multiple compression)
Capital markets access restricted (can’t raise equity/debt easily)
Customers get nervous (will you be around to honor warranties?)
Employees leave (best talent jumps ship first)
This creates a death spiral that’s hard to escape.
The Argentina Exit (September 2025):
One month after my analysis, Magnera announced closing the Pilar, Argentina facility.
This tells me:
They’re burning cash faster than expected (need to cut costs urgently)
South America operations are worse than disclosed
Project CORE is reactive (fixing problems) not proactive (optimizing strength)
When companies announce plant closures 10 months after a “transformative merger,” the transformation isn’t going well.
The Comparison to Successful Materials Companies
To understand why Magnera is uninvestible, let’s compare to successful specialty materials companies:
Avery Dennison (AVY) - Label and Packaging Materials:
Revenue: $8.4B
Debt/EBITDA: 2.8x (comfortable)
Interest Coverage: 8.5x (strong)
ROE: 22% (creating value)
Stock Performance: +25% past 12 months
Berry Global (BERY) - Packaging and Protection:
Revenue: $13.4B
Debt/EBITDA: 3.2x (manageable)
Interest Coverage: 4.2x (acceptable)
ROE: 15% (solid)
Stock Performance: +10% past 12 months
Magnera (MAGN) - Nonwovens Materials:
Revenue: $2.7B
Debt/EBITDA: 3.9x (elevated)
Interest Coverage: 1.0x (critical)
ROE: Negative (destroying value)
Stock Performance: -40% from merger
The Pattern:
Successful materials companies:
Maintain leverage below 3.5x
Generate interest coverage above 4x
Produce positive ROE consistently
Have pricing power in their segments
Magnera fails on all four criteria.
What Would Need to Happen for This to Work?
For intellectual honesty, let me outline what would need to happen for Magnera to become investable:
Scenario 1: Aggressive Deleveraging (Unlikely)
Pay down $500M+ of debt through:
Asset sales (sell non-core facilities)
Equity raise (dilutive but would lower leverage)
EBITDA improvement (Project CORE over-delivers)
Timeline: 2-3 years minimum
Probability: 20%—management has shown no willingness to raise dilutive equity
Scenario 2: Market Improvement (Possible)
Organic volumes recover as:
South American economy improves
European demand rebounds
Hygiene product consumption increases (aging demographics help)
Timeline: 2-3 years
Probability: 40%—this is plausible but cyclical recovery is unpredictable
Scenario 3: Acquisition (Wild Card)
A strategic buyer (Kimberly-Clark, P&G, international player) acquires Magnera for:
Technology platform
Customer relationships
Manufacturing footprint
Takeover Price: Likely $12-15/share (buyers would pay modest premium to troubled company)
Timeline: Could happen anytime or never
Probability: 25%—distressed assets attract private equity and strategics
Scenario 4: Bankruptcy/Restructuring (The Nightmare)
If can’t meet debt obligations:
Chapter 11 bankruptcy filing
Debt-for-equity swap (existing equity wiped out)
Emerge as smaller, restructured entity
Timeline: 1-3 years if happens
Probability: 15%—with interest coverage of 1.0x, this is very real
The Problem:
Even the “good” scenarios (deleveraging, market recovery, acquisition) take 2-3 years and have uncertain probability.
For a LEAPs strategy requiring value realization in 12-24 months, the timing doesn’t match.
The Lesson: Good Products Don’t Equal Good Investments
This is perhaps the most important lesson from Magnera:
A company can make genuinely useful products, serve real needs, employ thousands of people, and still be a terrible investment.
What Magnera Got Right:
✅ Technology (airlaid, spunlace, composite fibers are real innovations)
✅ Market position (world’s largest nonwovens company)
✅ Customer relationships (1,000+ customers, some multi-decade)
✅ Innovation (PFAS-free solutions addressing regulatory needs)
✅ Scale (46 facilities globally, 9,000 employees)
What Magnera Got Wrong:
❌ Capital structure (took on too much debt for merger)
❌ Timing (merged just as organic volumes started declining)
❌ Integration (combined companies underperforming)
❌ Cost structure (operating margins too thin to service debt)
❌ Management credibility (repeated guidance misses)
The hierarchy of business quality:
Tier 1 - Great Business, Great Balance Sheet:
Strong competitive position
Low debt
High returns on capital
Example: Procter & Gamble
Tier 2 - Good Business, OK Balance Sheet:
Solid competitive position
Moderate debt (manageable)
Decent returns
Example: Kimberly-Clark
Tier 3 - Decent Business, Bad Balance Sheet:
Competitive position OK
High debt (problematic)
Returns destroyed by interest expense
This is Magnera
Tier 4 - Bad Business, Bad Balance Sheet:
Declining competitive position
High debt
Bankruptcy likely
Example: Many retailers 2020-2023
Magnera is Tier 3. The business itself could be fine—but the capital structure makes equity un investable.
Buffett’s Wisdom:
“When a management with a reputation for brilliance tackles a business with a reputation for bad economics, it’s the reputation of the business that remains intact.”
Reverse this:
“When a management with a reputation for mediocrity tackles a business with decent economics but terrible balance sheet, it’s the balance sheet that determines the outcome.”
The Verdict: Hard Rejection
After analyzing:
The technology platform (solid)
The market opportunities (real)
The financial performance (catastrophic)
The management track record (poor)
The debt situation (unsustainable)
The valuation (no margin of safety)
My conclusion:
“Company has horrible debt position and cash flow, nothing on competitive edge or hidden value except for propriety tech from acquisition - and they expect to realized $75mil benefit from the acquisition. Till date we are not sure how much of that will happen. Much of the bull case (which still gives a poor margin of safety) is high speculation”
Three strikes:
Insufficient upside (1.5x best case vs. 2x needed)
Cash flow trapped by debt (can’t grow, can’t return capital)
Execution uncertainty (management has failed repeatedly)
Birds in the Bush: 1.5x absolute best case, 1.2x realistic case
How Sure Are You: 20% bull case, 50% base case, 30% bear case = 1.12x expected value
How Fast Till You Get Them Out: 2-3 years minimum (too long for LEAPs)
Final Verdict: ❌ REJECTED
Epilogue: What Happened After My Analysis
Since I analyzed this in September 2025, a few things have happened:
October 2025:
Stock continued weakness, trading $8-10 range
Continued negative press about missed expectations
November 19, 2025:
Q4 & Full Year FY2025 results released
Revenue: $839M (Q4), Operating income: $10M
Stock still range-bound
December 3, 2025:
Announced PFAS-free solution launch (positive innovation news)
Stock moved up to ~$15 range (40%+ gain from my analysis price!)
December 23, 2025 (Present Day):
Stock trading ~$14.95
Did I Make a Mistake?
The stock went from $9 (my analysis) to $15 (now)—a 67% gain I missed!
But here’s the thing:
The fundamentals haven’t changed—debt is still $2B, leverage still 3.9x, interest coverage still ~1.0x
The gain came from innovation announcement (PFAS-free products), which is speculative future revenue, not realized earnings
The stock is still 40% below the merger price of $25-27 (November 2024)
My expected value calculation had a 20% bull case at 1.78x return ($16 target)—we’re at $15 now, within that range
The time horizon problem remains—even at $15, this is 67% in 3 months (annualized 268%!), which is unsustainable. Mean reversion will happen.
More Importantly:
The PFAS-free announcement is a headline, not earnings. Until that innovation generates:
Actual revenue (contracts signed, production ramping)
Actual profits (margins confirmed at scale)
Actual cash flow (collecting payment)
It’s just a story. And stories are wonderful—until reality catches up.
The Process Was Right:
Even though I “missed” a 67% move, my process was sound:
Identified fundamental problems (debt, execution)
Calculated expected value (1.12x = inadequate)
Required 2x minimum for LEAPs strategy
Rejected based on risk/reward
Sometimes you avoid losing more money than you miss making money.
If the stock crashes back to $6-8 (bear case from debt problems), I’ll be glad I wasn’t holding. If it goes to $20 (bull case fully realized), I’ll tip my hat and move on.
That’s discipline.
The Final Lesson: Know What You Don’t Know
Charlie Munger: “It’s not supposed to be easy. Anyone who finds it easy is stupid.”
Analyzing Magnera was not easy. The business is real. The products are useful. The markets are growing. Management sounds credible.
But dig deeper:
ROE negative (destroying value)
Interest coverage 1.0x (one bad quarter from disaster)
Execution track record poor (repeated misses)
Time horizon mismatch (need 2+ years, have 12-24 months for LEAPs)
The investment decision isn’t: “Is this a good company?” (It’s decent)
The investment decision is: “At this price, with this capital structure, with this management, with this time horizon, is the risk/reward favorable?”
Answer: No.
And that’s OK. Most opportunities should be rejected. The winnowing process—saying no to 99% of ideas—is what produces the 1% that generate real wealth.
Final Thought:
Magnera makes the surgical gowns that protect healthcare workers. The diapers that keep babies comfortable. The building wrap that protects homes from moisture. The wipes that clean surfaces.
These are good products serving real needs.
But the capital structure—$2 billion in debt against $400 million EBITDA—makes the equity a speculation, not an investment.
And I don’t speculate.
Rejection confirmed. ❌
“In the business world, the rearview mirror is always clearer than the windshield.” — Warren Buffett
Sometimes the best investment is the one you don’t make.