
Before We Begin: The Most Important Paragraph Warren Buffett Ever Wrote About Insurance
In the 1998 Berkshire Hathaway Annual Report — published the same year Berkshire acquired General Re for $22 billion and suddenly became one of the largest insurance enterprises on earth — Buffett wrote this in his letter to shareholders:
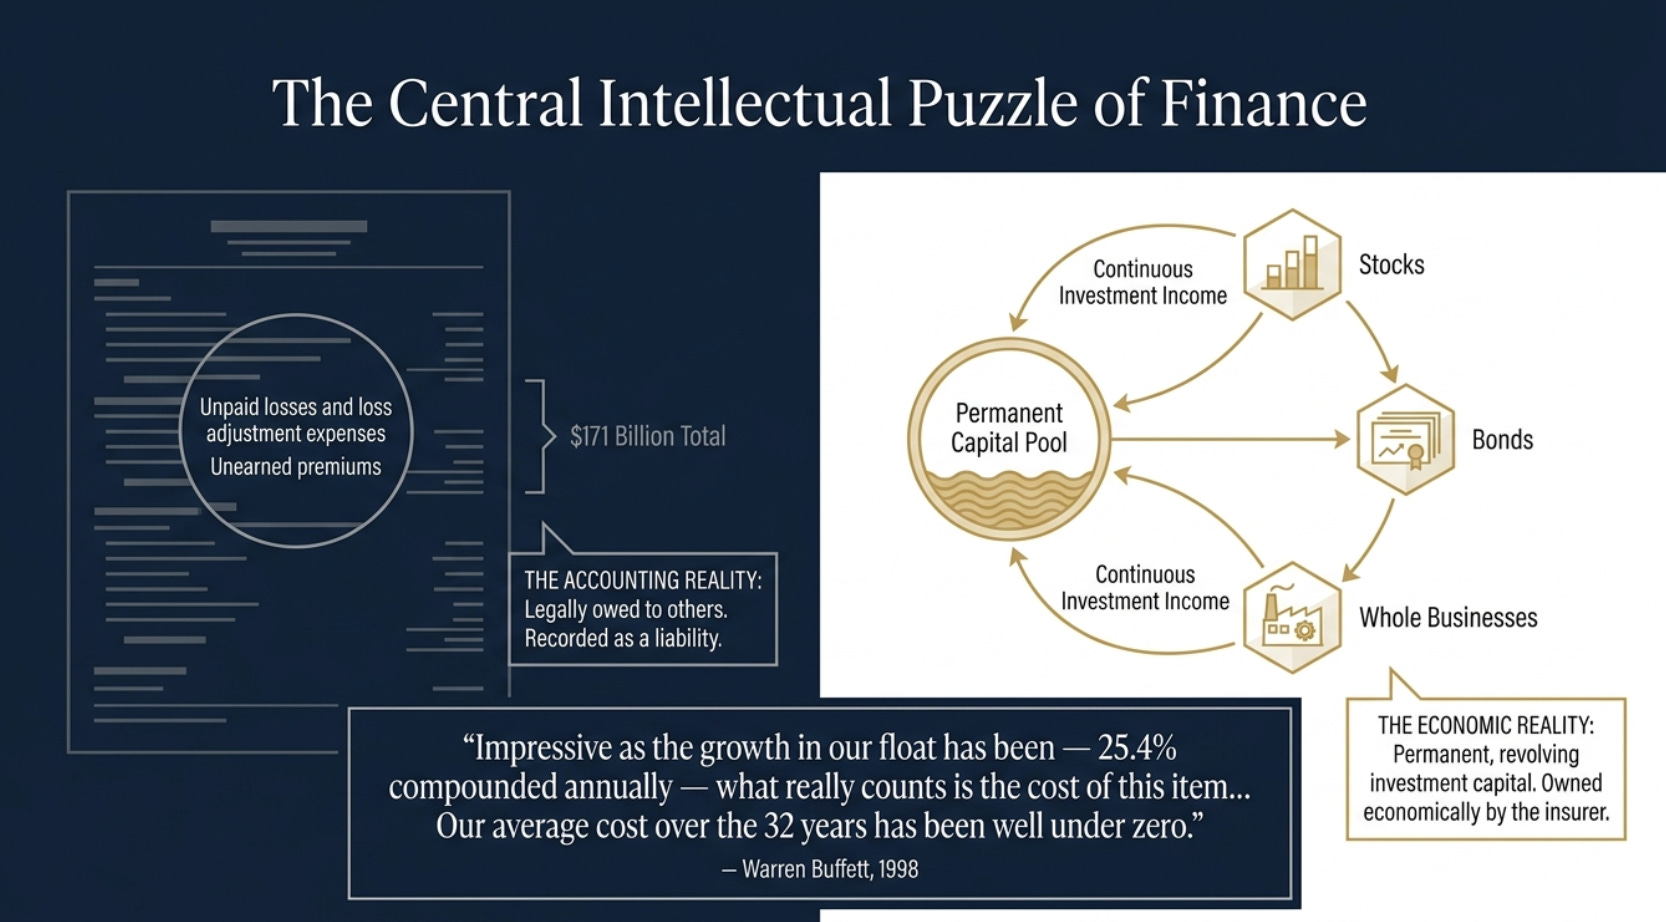
“Impressive as the growth in our float has been — 25.4% compounded annually — what really counts is the cost of this item. If that becomes too high, growth in float becomes a curse rather than a blessing. At Berkshire, the news is all good: Our average cost over the 32 years has been well under zero.”
Read that last sentence again. Thirty-two years of average cost of float that was not merely low, not merely zero, but below zero. Buffett was not describing an asset on Berkshire’s balance sheet. He was describing something that does not appear as an asset anywhere in the financial statements. He was describing a pool of capital — belonging legally to policyholders, recorded as a liability — that had effectively paid Berkshire to hold it, for three decades, at growing scale.
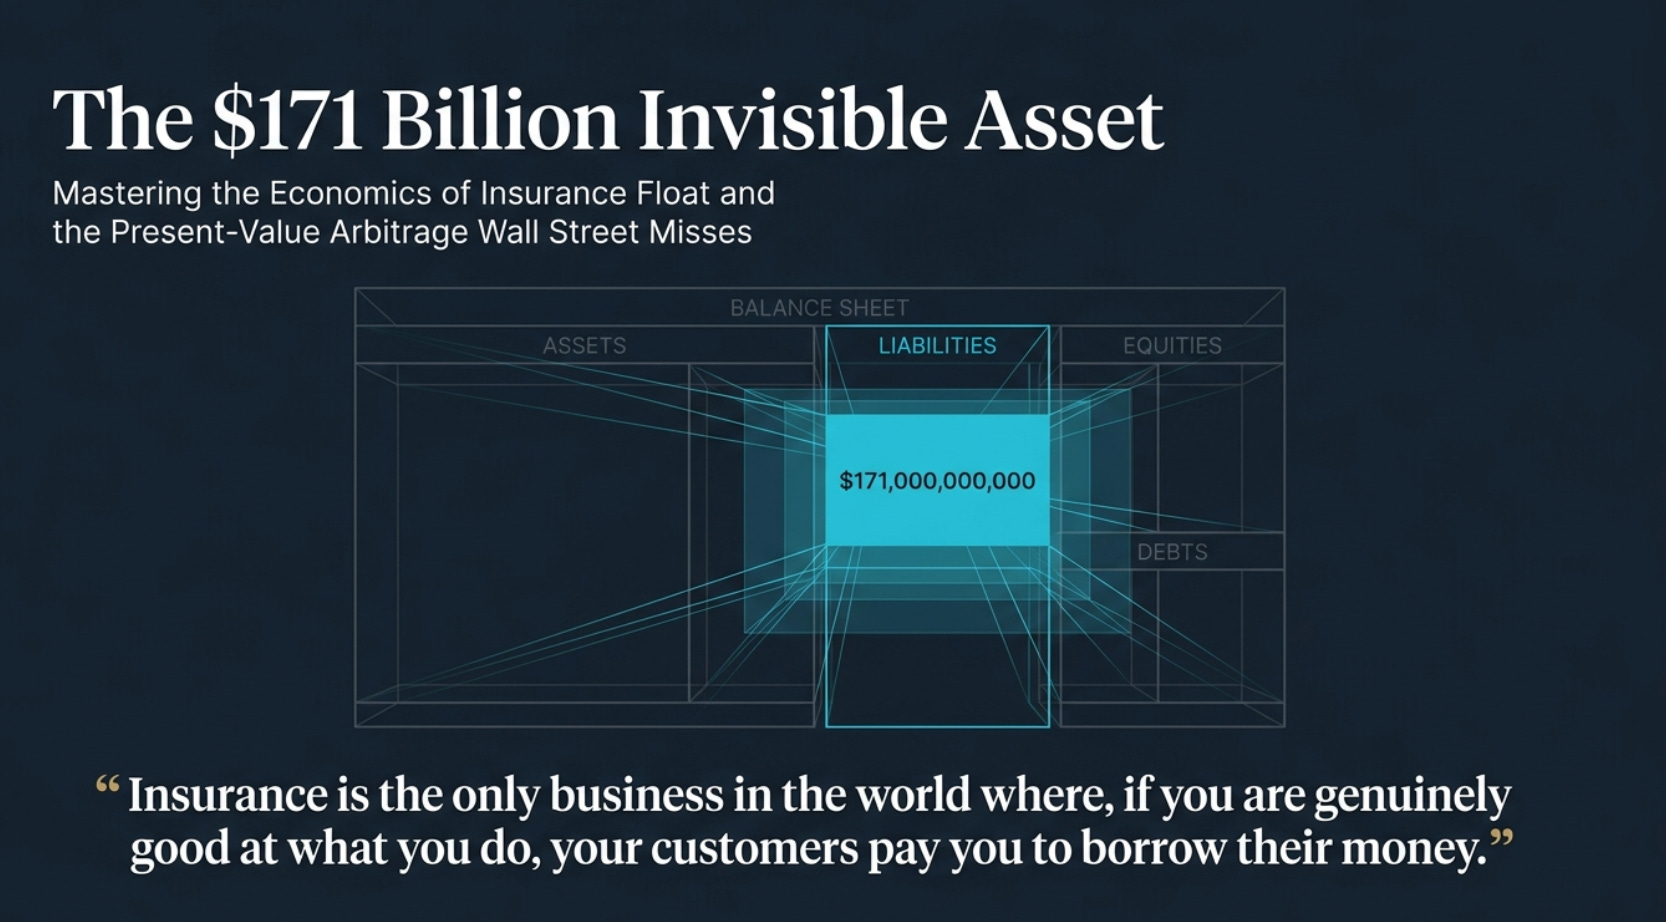
By the end of 2024, that float had grown to $171 billion. Berkshire had operated at an underwriting profit for 14 consecutive years, accumulating $28 billion in pre-tax underwriting gains over that period alone. In the same two decades, float had grown from $46 billion to $171 billion. The $171 billion sits on Berkshire’s balance sheet as a liability — as “unpaid losses and loss adjustment expenses” and “unearned premiums” — because that is where accounting standards require it to sit. The $171 billion generates investment income every year from being deployed into stocks, bonds, and whole businesses. That investment income flows through the income statement as earnings. But the capital pool itself — the $171 billion that Berkshire does not own — appears as something owed to others rather than something of value to the owner.
This is the central intellectual puzzle of insurance finance, and it is the source of the value arbitrage this paper describes.
PART I: THE BUSINESS MODEL FROM THE GROUND UP
Why Insurance Has a Different Clock Than Every Other Business
Most businesses operate on a simple financial rhythm. You spend money to make something. You sell it. The revenue arrives. You count the profit. The sequence is: cost first, revenue close behind. A factory that makes cars knows exactly what the car cost to build by the time the customer drives it off the lot.
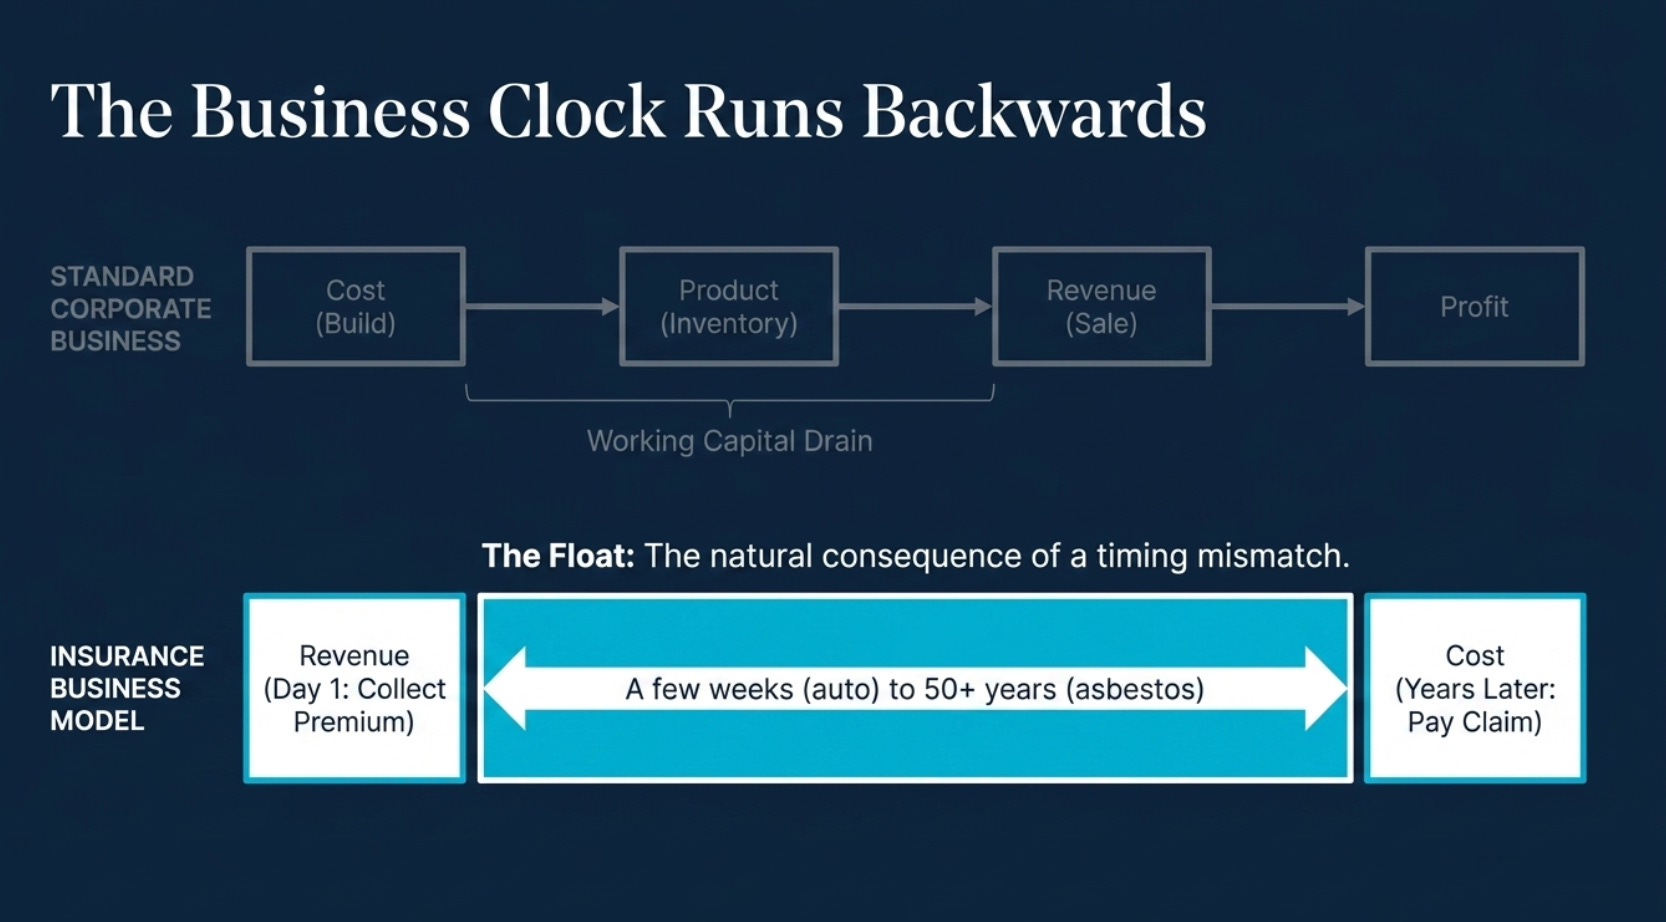
Insurance runs the sequence entirely backwards, and this reversal creates everything important about the economics. You collect the premium first — typically the full annual premium upfront on day one of the policy. Then, if a claim occurs, you pay it later. For a homeowner’s insurance policy on a house that does not burn down, you collect the premium and pay nothing. For a workers’ compensation policy on an employee who develops occupational disease thirty years into retirement, you collect the premium in 1995 and are still paying claims in 2025. The gap between collection and payment can be a few weeks for a car fender-bender or several decades for asbestos liability. The 2024 Berkshire annual report noted: “We are still making substantial payments on asbestos exposures that occurred 50 or more years ago.”
During that entire gap — whether it is three months or fifty years — the insurance company holds and invests the premium. The float is the aggregate of all those gaps across all active policies. It is not a fund set aside for a specific purpose. It is the natural consequence of the timing mismatch between premium receipt and claim payment. Every insurance company has float. The question is how much it costs them to maintain it.
The Cost of Float: The Only Number That Distinguishes a Good Insurance Business from a Bad One
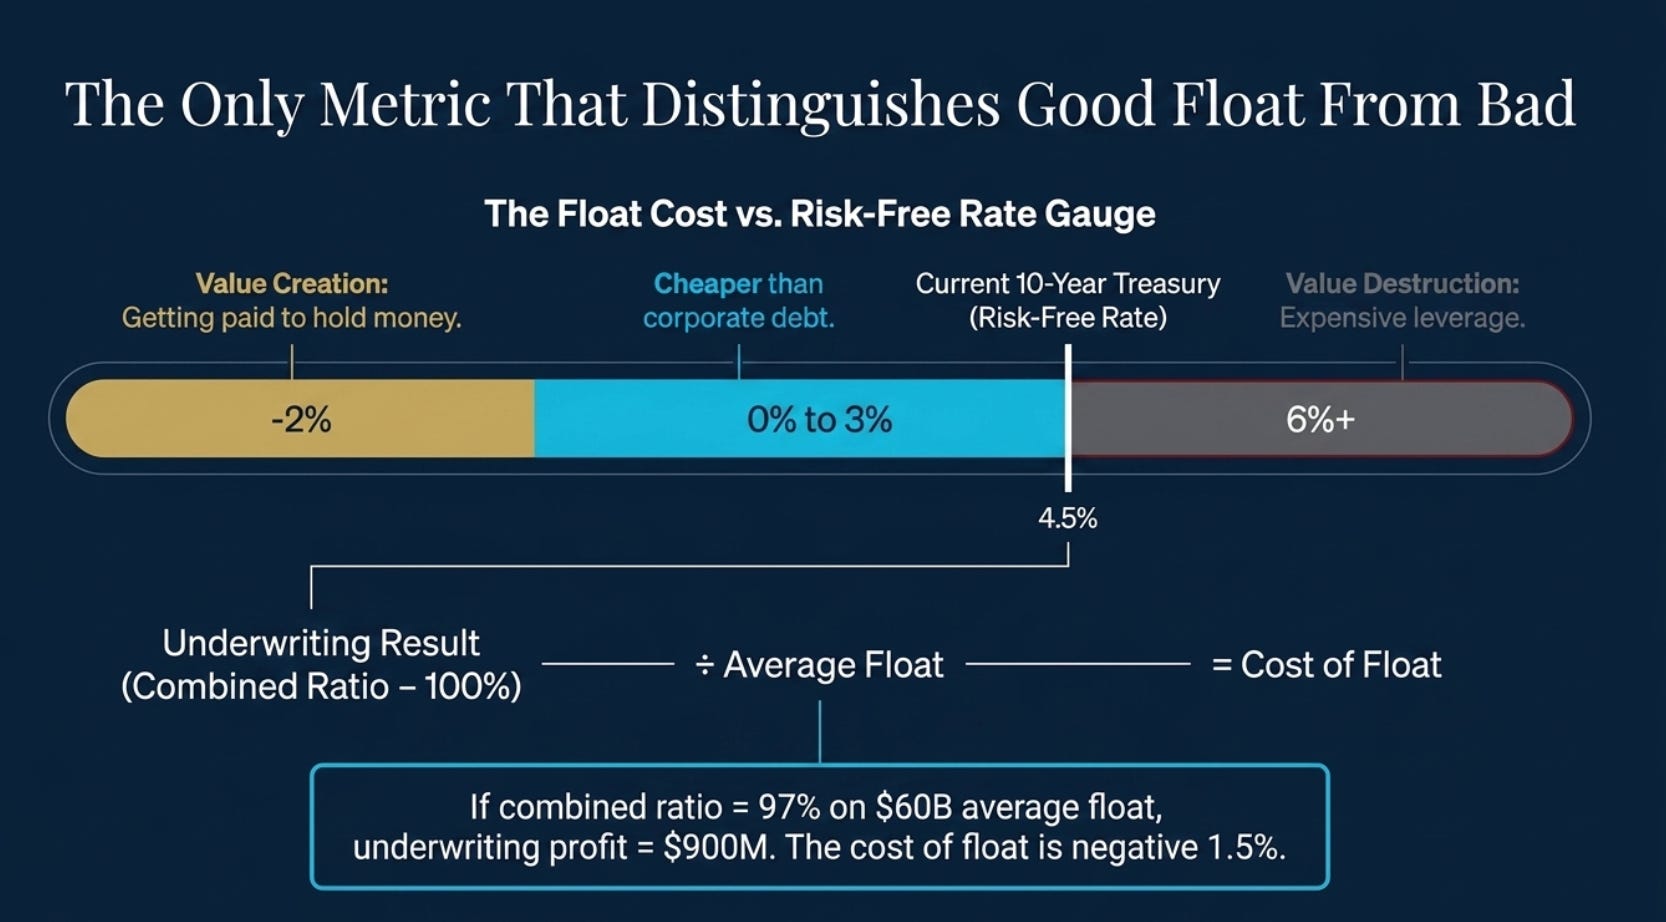
The cost of float is the most important metric in insurance analysis, and it is the metric that conventional financial models handle most poorly. It is calculated as follows: take the insurer’s underwriting result for the year — the combined ratio minus 100%, expressed as a profit or loss as a percentage of earned premiums — and divide by the average float. If the insurer ran at a combined ratio of 97% (meaning it paid out 97 cents in claims and expenses for every dollar of premium collected), the underwriting profit was 3% of premiums. If that 3% profit represented $900 million against an average float of $60 billion, the cost of float was negative 1.5%. The float not only cost nothing — the policyholders effectively paid the insurer $900 million to hold their money.
Compare this to the cost of any other form of capital. A company issuing ten-year corporate bonds in 2024 might pay 5% to 5.5% per year in interest. A company drawing on a revolving credit facility pays the bank’s spread above SOFR. An equity issuance dilutes existing shareholders at the current cost of equity, which might be 8% to 10% in a normalised rate environment. Float from a well-underwritten insurance operation costs, at its best, less than zero. It costs, at the industry average, approximately 3% to 5% — which is roughly equivalent to investment-grade corporate borrowing. And it comes with a distinctive characteristic that no other form of capital provides: it does not need to be repaid on any fixed schedule. Claims are paid when they occur. The float simply revolves continuously, with new premiums replacing paid claims in an endless cycle.
PART II: WHY THE ACCOUNTING SYSTEM GETS THIS EXACTLY WRONG
A Liability That Behaves Like an Asset
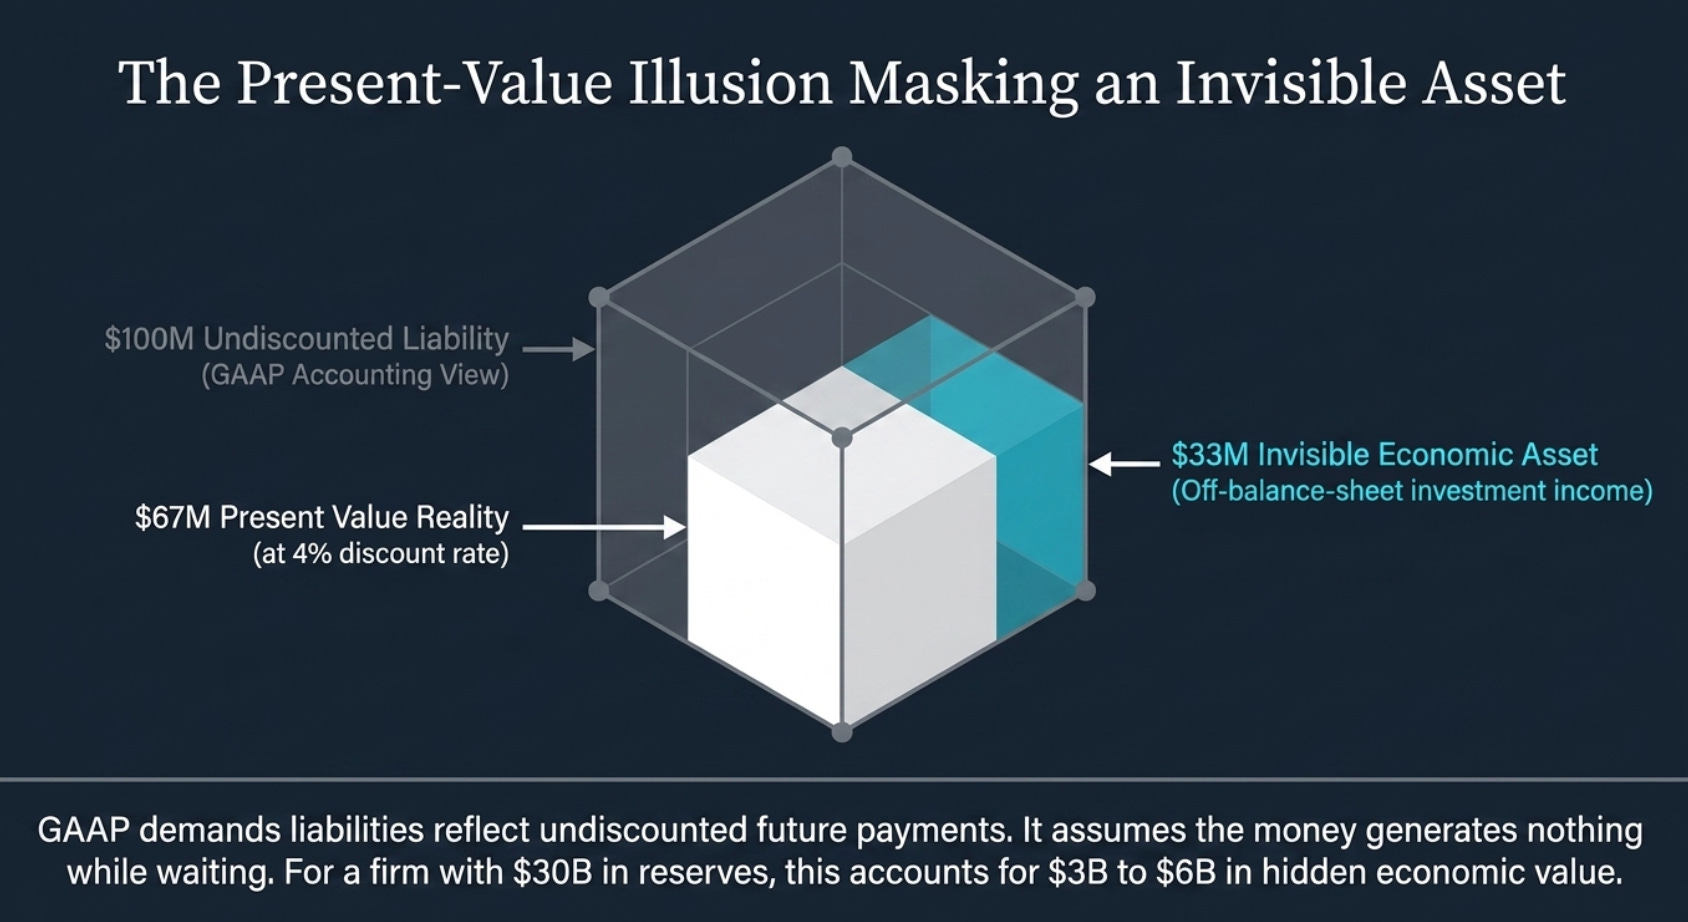
Under US GAAP (ASC 944 for insurance entities) and IFRS (IFRS 17, which took effect in 2023), insurance liabilities are measured at their projected future settlement values. An insurer that has collected $100 million in premiums on a portfolio of long-tail liability policies will carry approximately $100 million (plus or minus actuarial adjustments) in reserves on the balance sheet. The standard requires the liability to reflect the expected undiscounted value of future payments.
Here is the accounting absurdity: a $100 million loss reserve that will not be paid for ten years has a present value of approximately $67 million at a 4% discount rate. The economic truth is that the insurer holds $100 million today but only needs $67 million to cover the obligation — the remaining $33 million is the investment income that will be earned by investing the $100 million over ten years. The balance sheet shows the liability at $100 million and makes no provision for the fact that the $100 million of float, invested for ten years at 4%, will grow to approximately $148 million — covering the $100 million obligation with $48 million left over.
To restate the arithmetic with precision: if you take $67 million today and compound it at 4% per annum for ten years, you arrive at exactly $100 million. The balance sheet liability is $100 million. The present-value reality of what you need today to cover that liability is $67 million. The difference — $33 million — is the off-balance-sheet investment income that the float will generate between now and the payment date. It belongs economically to the insurer. It does not appear as an asset anywhere in the financial statements. It is invisible.
This invisibility compounds across an insurer’s entire reserve portfolio. For a large property-casualty insurer with $30 billion in loss reserves and an average payment duration of five to eight years, the present-value discount embedded in the undiscounted reserves might represent $3 to $6 billion in off-balance-sheet economic value — investment income the company will earn on money that the balance sheet pretends it has already spent.
PART III: THE WALL STREET PROBLEM — WHY CONVENTIONAL METRICS MISS THE FLOAT
What the Analyst’s Model Looks Like
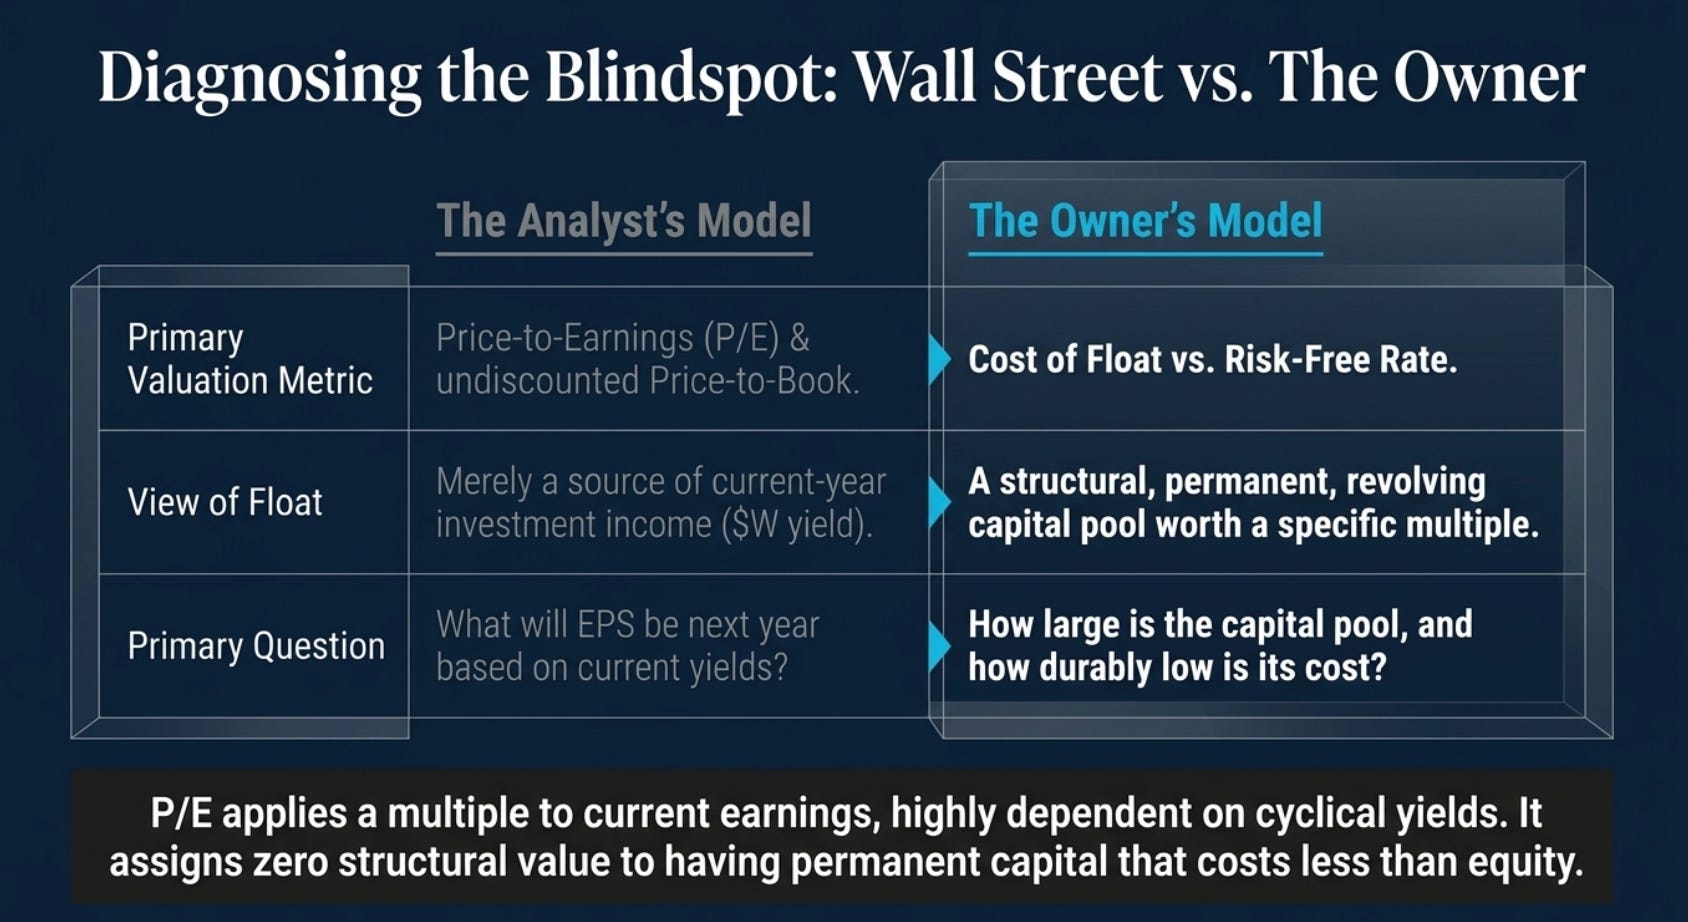
When an equity analyst covers an insurance company, the standard model takes the form of a combined ratio forecast, a premium growth assumption, and an investment yield assumption. The analyst projects: earned premiums of $X, a combined ratio of Y%, generating underwriting profit of $Z, plus investment income on the portfolio of $W. Total pre-tax earnings are $Z + $W, taxed at the effective rate, producing net income and then an earnings per share figure. Apply a sector P/E multiple — typically 10 to 14 times for property-casualty insurers — and you arrive at a price target.
This model treats the float entirely as the source of investment income rather than as the asset itself. The analyst counts the income the float generates but never asks: what is the float worth as a capital source, independent of this year’s investment yield? The float generates $W in investment income this year at whatever the current investment yield happens to be. But the float is also $10 billion or $30 billion or $171 billion in permanent, revolving capital that does not appear as equity and does not cost what equity costs. The P/E model applies a multiple to current earnings, which depend on current interest rates and current underwriting conditions, and produces a price. It does not value the float as a structural capital advantage.
The Price-to-Book ratio, similarly, fails because book value for an insurer equals the investment portfolio plus other assets minus all liabilities, including the full undiscounted loss reserves. An insurer with $30 billion in undiscounted reserves that are economically worth only $23 billion at present value has $7 billion in off-balance-sheet economic assets that reduce the effective cost of its capital structure — and none of that appears in the P/B calculation. The P/B ratio is telling you the price relative to shareholders’ equity after all the accounting deductions. It is not telling you the price relative to the economic capital structure, which includes the float valued at its cost advantage.
The single metric that most clearly reveals whether an insurer’s float represents value or a burden is one that almost no sell-side analyst includes in a standard model: the ratio of cost of float to the current risk-free rate. If an insurer’s cost of float is 2% and the ten-year Treasury yields 4.5%, the float is effectively leverage at less than half the cost of the risk-free rate. If the cost of float is 5% and the ten-year yields 4.5%, the float is costing slightly more than the risk-free rate — it is still useful, but the advantage is thin. If the cost of float is persistently 8% to 10%, the float is destroying value.
An owner buying an insurance company does not primarily ask: what will the earnings per share be next year? They ask: what is the cost of float, how large is the float, and how durably low is that cost? The answers to those three questions determine the economic value of the insurance franchise, independent of any forecast.
PART IV: STORIES FROM THE UNDERWRITING ROOM — FOUR CASE STUDIES IN FLOAT VALUE ARBITRAGE
The $8.6 Million Purchase That Changed Everything: National Indemnity, 1967
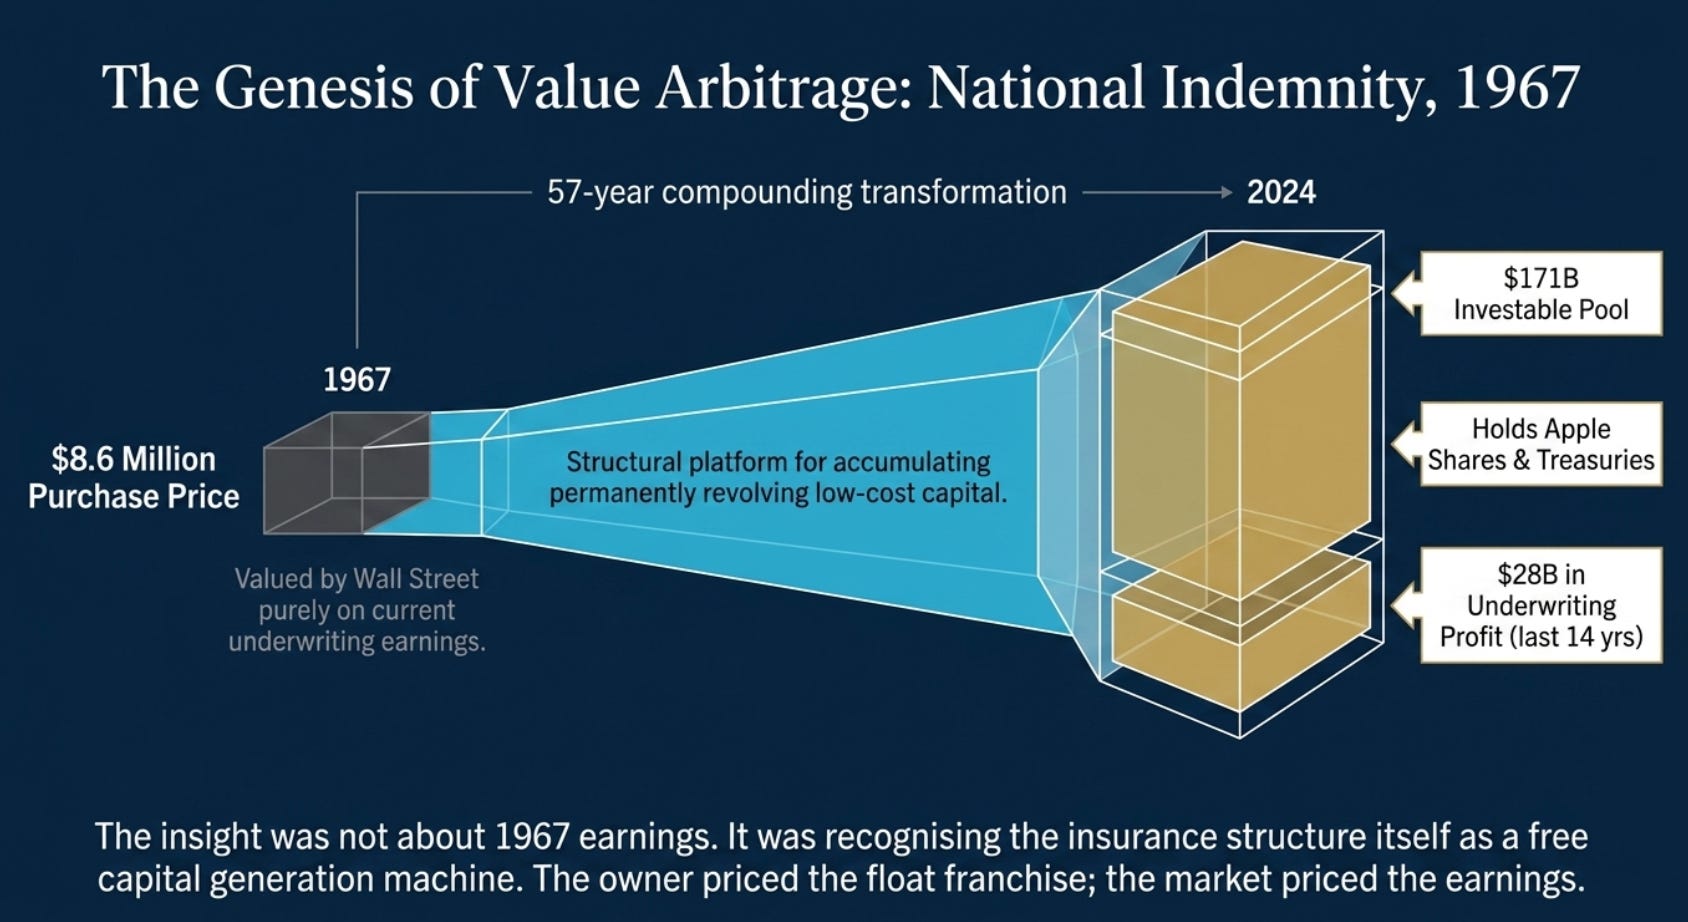
In March 1967, Berkshire Hathaway paid $8.6 million to acquire National Indemnity Company, a specialty commercial auto and general liability insurer based in Omaha, Nebraska. The seller was Jack Ringwalt, who had founded the company in 1940 and had built it into a respectable regional insurer over 27 years. The purchase price was modest. The acquired float was small — a few tens of millions of dollars. The transaction attracted no significant attention from the financial press.
Fifty-seven years later, National Indemnity is the legal entity through which Berkshire Hathaway holds most of its investment portfolio. It is the structural heart of an operation that holds $171 billion in float, has produced $28 billion in pre-tax underwriting profits over the past 14 years alone, and generates investment income on a pool of capital that includes Apple shares, short-term Treasury bills, and dozens of wholly owned businesses. The $8.6 million purchase price has compounded into a contribution to Berkshire’s enterprise that is measured in the hundreds of billions.
The insight that made this possible was not about National Indemnity’s earnings in 1967. It was about the structure of the insurance business model itself. Float, properly managed, is a permanent, revolving source of investment capital that the owner does not have to contribute from their own pocket. Every dollar of float is a dollar that can be invested. If the float grows, the investable pool grows. If the underwriting discipline holds, the cost of float stays low or negative. The earnings model in 1967 would have valued National Indemnity based on its underwriting results and investment income — a relatively ordinary small insurance company by those measures. The owner’s analysis, applied by Buffett, valued it as a platform for accumulating permanently revolving low-cost investment capital. That is a fundamentally different asset.
The 2024 Berkshire annual report noted that over the past two decades, Berkshire’s insurance operations generated $32 billion in after-tax profits from underwriting — roughly 3.3 cents per dollar of premiums written — while float grew from $46 billion to $171 billion. The investment income on $171 billion at even 4% is $6.84 billion per year, on capital that Berkshire does not own. If you add the underwriting profit — which is currently substantial — to the investment income on float, you are looking at a combined economic contribution from the insurance operation that reflects an asset no GAAP balance sheet shows in its true form: a $171 billion permanent, revolving, free or negative-cost pool of investment capital.
The General Re Disaster and the Lesson About Float Quality
Not all float is created equal. The General Re acquisition in 1998, for $22 billion in Berkshire stock, taught a lesson about float quality that is worth examining in detail — because it demonstrates that float from careless underwriting is not merely unprofitable but actively destructive, and that the earnings model is particularly poorly suited to identifying this distinction.
Berkshire acquired General Re — then one of the world’s largest and most prestigious reinsurance companies — in late 1998. The strategic rationale was clear and correct: General Re held approximately $15 billion in float, providing Berkshire with an enormous incremental investment pool. The business was respectable, well-regarded, and apparently conservatively run.
Within months of the acquisition, the problems emerged. General Re had been running a combined ratio that looked acceptable in the years leading up to the acquisition but concealed deteriorating reserve adequacy in its long-tail liability lines.
Long-tail liabilities in insurance are claims that take a significant amount of time—often years or decades—to manifest, report, and settle after the initial insured event occurs.
In 1999, underwriting losses ballooned to $1.2 billion on $6.9 billion in premiums. Losses continued in 2000. Then September 11, 2001 added $1.9 billion in losses directly related to the terrorist attack. Berkshire’s 2000 annual report acknowledged a float cost of 6% for the year — meaning the combined underwriting losses had turned the float from a free capital source into capital that cost 6% annually, more than risk-free bond rates at the time.
What the earnings model had shown before the acquisition was: a well-regarded reinsurer with a long operating history, reasonable combined ratios, and a large and growing float. What the owner’s analysis should have probed was: how were those combined ratios constructed? Were the loss reserves adequately funded for the tail risk in the portfolio? Was the pricing discipline genuine or was it underwriting results being smoothed by releasing prior-year reserves?
Buffett’s 2000 letter was frank about what happened: General Re had been underpricing risk before the acquisition, and the shortfall was only becoming apparent years later as long-tail claims developed. The float was large but its cost was rising as the inadequate underwriting was revealed. The 2001 letter acknowledged that corrective action — repricing policies, non-renewing unprofitable business, strengthening reserves — had begun, but that the repair would take years.
By 2016, the repair was complete. General Re’s float stood at $17.7 billion and produced an underwriting profit of $190 million. The same float that had cost Berkshire 6% in 2000 was generating a positive return by 2016. The underlying economics of the float — as free, revolving investment capital — were always present. The problem had been the underwriting discipline that determines the cost of that float. Once the underwriting was corrected, the float’s structural advantage reasserted itself.
The lesson for investors evaluating an insurance company’s float is precise: the size of the float matters, but the quality of the underwriting that produces it matters more. An insurer running a combined ratio of 104% on $50 billion of float is not generating free leverage — it is paying 4% above zero for the right to invest other people’s money. An insurer running at 97% on $10 billion of float is generating negative-cost leverage at 3% profit on the float. The second is the better business by a wide margin, even though it has five times less float. The earnings model, comparing the two companies by P/E or EV/EBITDA, might prefer the first because the absolute investment income from a larger float produces higher reported earnings. The owner’s analysis of the float quality prefers the second unambiguously.
GEICO: The Float Machine That Was Always There, Waiting to Be Capitalised
GEICO’s story is the best available illustration of how a business can have a structurally extraordinary float advantage that the market completely fails to price because the earnings model anchors on current underwriting results rather than on the long-term economics of the float franchise.
By the early 1970s, GEICO — Government Employees Insurance Company — had built a large and profitable auto insurance operation selling directly to government employees and military personnel, primarily by mail. Its direct-to-consumer model eliminated the broker commissions that added 15% to 20% to the cost of policies sold through agents, giving GEICO a structural cost advantage that no conventional agency-distribution competitor could match. In 1972, it was highly profitable and growing rapidly.
Then, in the mid-1970s, GEICO nearly destroyed itself through a combination of rapid expansion into unfamiliar markets, inadequate pricing discipline, and catastrophically inadequate loss reserves. The company had been booking inadequate reserves for its liability policies — presenting better underwriting results than the underlying business actually supported. By 1976, the true extent of the underreserving was becoming clear. GEICO was technically insolvent, its share price had collapsed from $61 to $2, and most of the financial community had concluded it was finished.
Warren Buffett had started buying GEICO at around $2 per share in 1976. By 1980, Berkshire’s stake had been built at an average cost that would prove to be a fraction of GEICO’s eventual value. In 1996, Berkshire paid approximately $2.3 billion for the remaining 49% of GEICO it did not yet own — valuing the whole company at roughly $4.7 billion.
At the point of acquisition, the earnings model for GEICO would have shown: an auto insurer with growing premiums, improving combined ratios, and competitive investment yields on a growing reserve portfolio. A reasonable P/E or Price-to-Book multiple applied to those numbers would have produced a valuation in the several-billion-dollar range — which was broadly what Berkshire paid.
But what was the float worth as a structural asset? In 1995, the year before full acquisition, GEICO’s float was approximately $2.9 billion. The combined ratio in recent years had averaged around 96% to 98%, meaning GEICO was generating a modest underwriting profit and its float cost was slightly negative to modestly positive. More importantly, GEICO’s direct-distribution model — no agents, no commissions, lower cost per policy — gave it a structural advantage that would allow it to grow float profitably over time, because it could price more competitively than agency-channel competitors while maintaining similar or better underwriting margins.
Since 1996, GEICO has grown from roughly 3 million policies to over 18 million, from $2.9 billion in float to a float of approximately $26 billion within Berkshire’s consolidated insurance operation. GEICO’s underwriting profit in 2024 was approximately $7.8 billion — a single year’s underwriting profit that exceeds the total acquisition price Berkshire paid for the entire company in 1996. The structural float advantage — the direct distribution model producing lower costs that enable both competitive pricing and underwriting profitability — was visible in the economics in 1996, even if the earnings model priced only the current results. The owner who priced the float franchise rather than the current earnings bought an asset worth many times the purchase price.
The Long-Tail Problem and How Patience Becomes Return
There is a category of insurance float that is particularly misunderstood by conventional financial analysis because the income it produces does not appear in the short-term results that earnings models emphasise. Long-tail liability insurance — workers’ compensation, medical malpractice, environmental liability, asbestos claims — has payment periods that routinely extend 20 to 30 years from the date the original policy was written. The float from these policies sits on the balance sheet for decades, generating investment income year after year, while the corresponding liability reserve gradually declines as claims are paid.
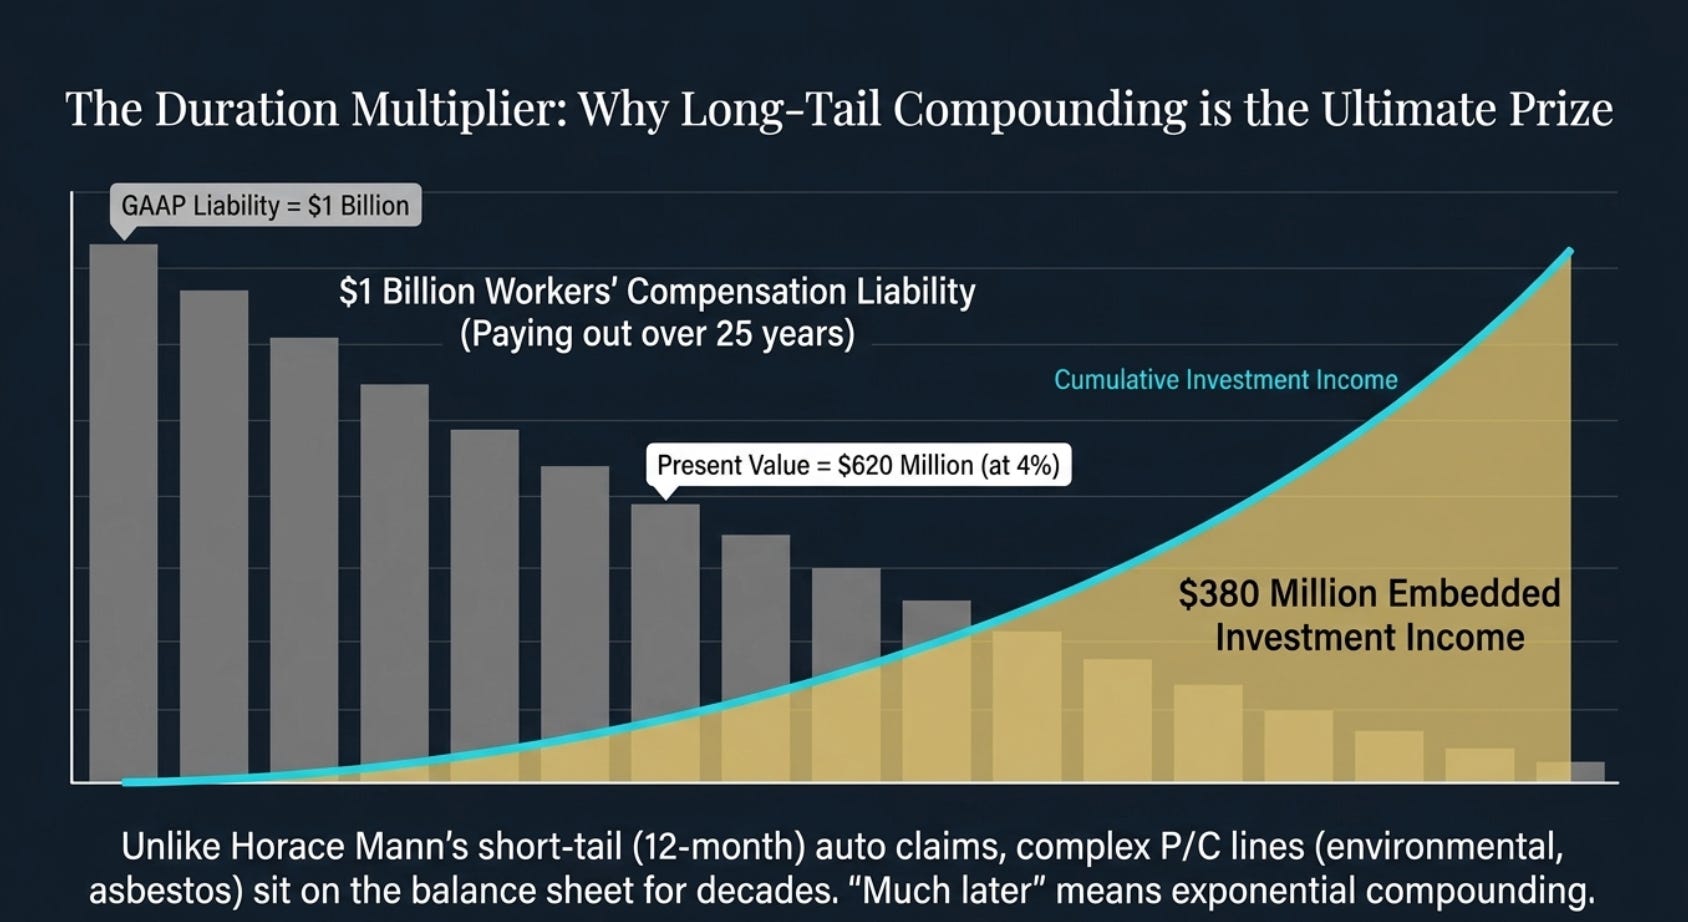
An investor looking at a specialty insurer with a large book of workers’ compensation insurance would see, in the earnings model: premium income from current-year policies, investment income from the portfolio, and claims payments on both current and prior-year policies. What the model does not highlight is the extraordinary present-value advantage embedded in the long-tail reserves. A workers’ compensation reserve of $1 billion, representing claims that will be paid out over 25 years at an average duration of 12 years, has a present value of approximately $620 million at 4% discount. The insurer holds $1 billion in investments against a $1 billion liability but only needs $620 million to fund the obligation in present-value terms. The $380 million difference represents investment income the insurer will earn over the next 12 years — investment income on float that belongs on the liability side of the balance sheet but generates all its value on the asset side.
The owners who understand this have structured their insurance businesses to maximise long-tail float — not because long-tail claims are easier to manage (they are not), but because the duration of the float is itself a source of value. Buffett noted in his 2016 annual letter: “One reason we were attracted to the P/C business was its financial characteristics: (certain) P/C insurers receive premiums upfront and pay claims later, often much later.” The “often much later” is doing a lot of work in that sentence. “Much later” means more years of investment income on the float. It means more compounding. It means more present-value discount between the liability’s face value and its economic cost.
A majority of Horace Mann's insurance are short-tail insurance — which means that they only have about 12 months of float and claims are made really quickly. On the other hand, the P/C insurance that Buffet bought in his previous investments was long-tail. In complex commercial P/C lines (like asbestos, environmental hazards, or multi-party liability), decades can pass before courts or adjusters finalize a claim. This long time gap provides Berkshire with a permanent pool of compounding investment capital. The low float duration of Horace Mann's float does not.
PART V: THE OWNER’S FRAMEWORK — HOW TO VALUE A FLOAT-GENERATING INSURANCE BUSINESS
What a Business Owner Actually Calculates When Buying an Insurer
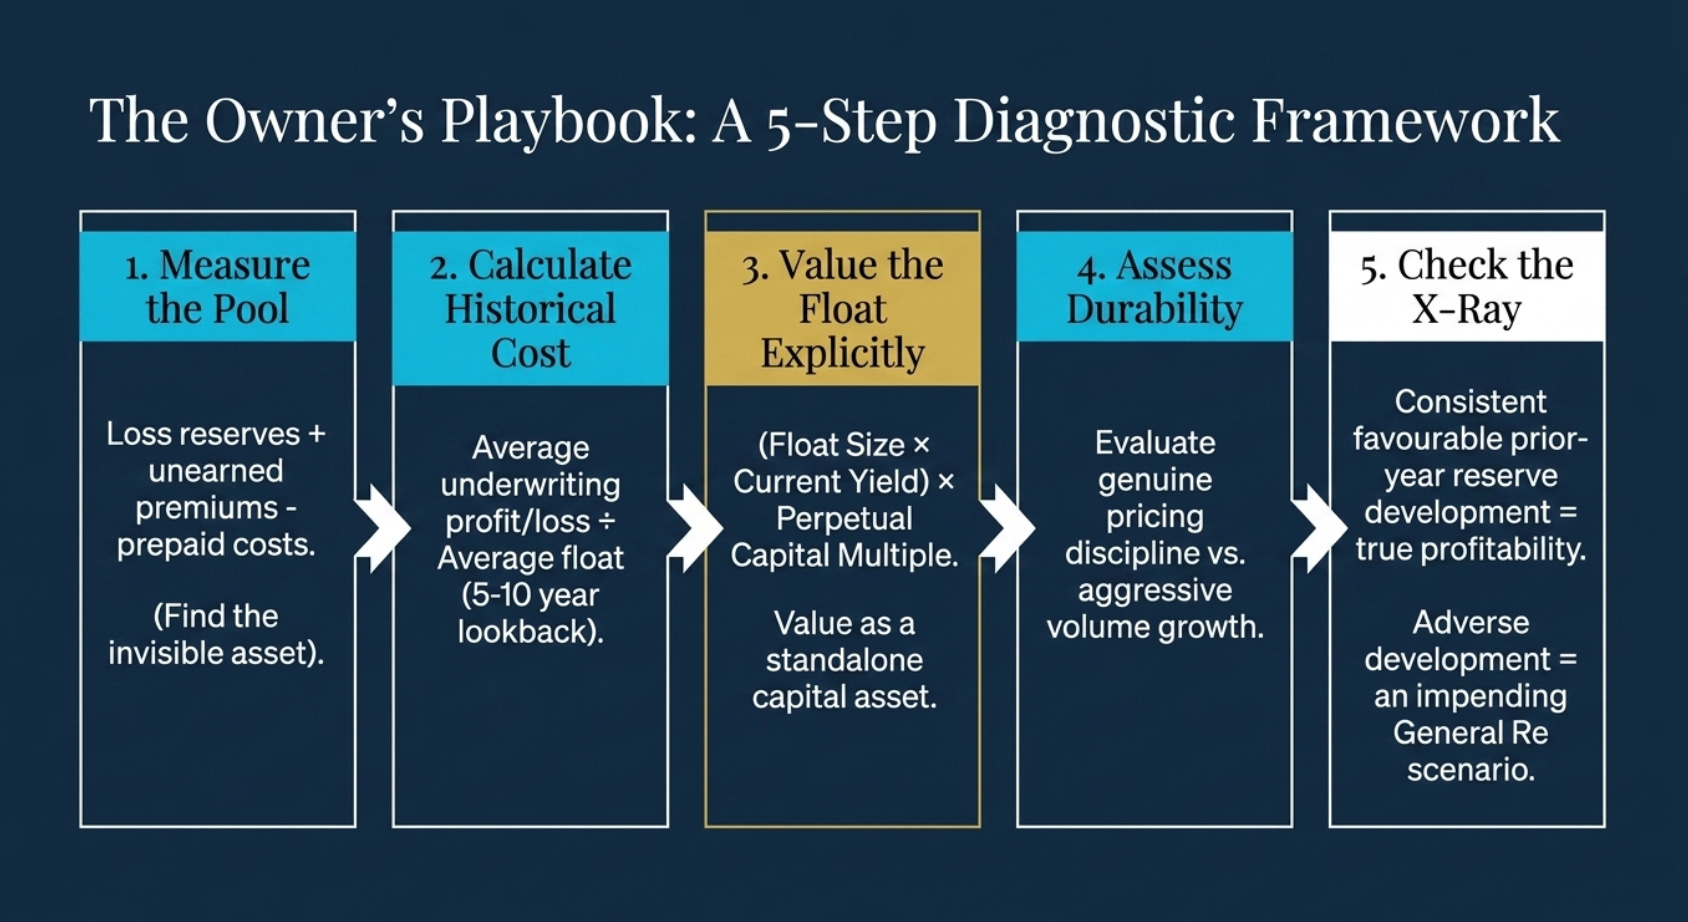
A business owner acquiring an insurance company does not apply a P/E multiple to current earnings. They perform a float analysis that has five steps, none of which requires a forecast of future insurance prices or investment yields.
The first step is to measure the float: total loss reserves plus unearned premiums (prepaid insurance premium that the insurer has not yet "earned" because the policy term hasn't fully elapsed) minus agents’ balances, prepaid acquisition costs, and similar deductions. This is the investable pool — the capital the business holds but does not own, which is available for investment. Berkshire discloses this figure explicitly in its annual letter. Most insurers do not provide the float figure directly, but it can be calculated from the balance sheet components.
The second step is to calculate the historical cost of float over the past five to ten years: average annual underwriting profit or loss (via combined ratio), divided by average float. This produces a percentage — the average cost per dollar of float. Compare this to the average 10-year Treasury yield over the same period. If the cost of float has consistently been below the 10-year yield, the float is providing cheaper capital than the risk-free rate. If it has been persistently above, the float is expensive leverage. Buffett’s 1998 letter disclosed that Berkshire’s average float cost over 32 years had been well under zero — an unambiguous signal of the quality of the underlying underwriting franchise.
The third step is to value the float explicitly as a capital pool. At a zero cost of float and a 4.5% investment yield on a $30 billion float, the insurer generates $1.35 billion per year in investment income on capital it does not own. Capitalised at, say, 12 times (reflecting the perpetual nature of the float and the zero cost of capital), this component of value alone is worth $16.2 billion — from a $30 billion capital pool that shows up as a liability on the balance sheet.
The fourth step is to assess the durability of the float. Is this a business with genuine underwriting discipline — disciplined pricing, conservative reserving, no pressure to grow premiums for volume’s sake — or is the float a product of aggressive growth that will reverse in the next soft market? The General Re case illustrates the danger of float that appears large but whose cost is concealed by inadequate reserving.
The indicator for reserve adequacy is the consistency of prior-year reserve development: an insurer that consistently reports favourable prior-year development — meaning claims on old years came in below the original reserve estimate — is demonstrating conservative reserving. An insurer that consistently reports adverse development is signalling the opposite.
PART VI: CONFIRMED CATALYSTS — WHAT MAKES THE FLOAT MORE VALUABLE NOW THAN BEFORE
Catalyst 1: The Rate Environment Has Permanently Repriced the Investment Returns on Float
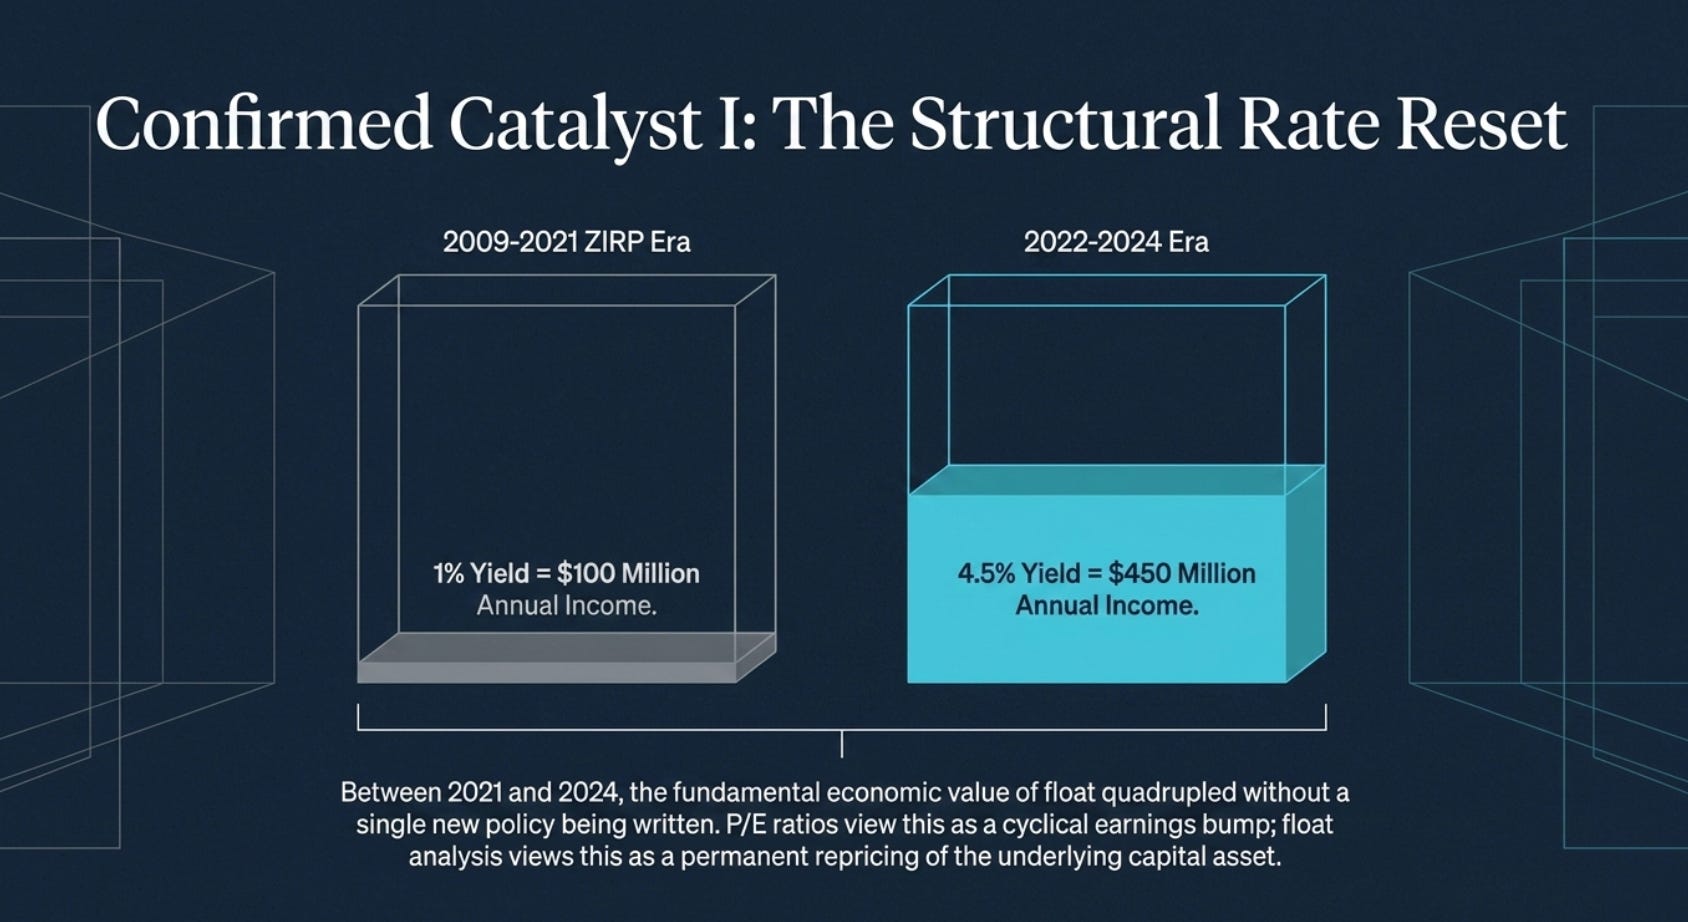
From 2009 to 2021, the Federal Reserve maintained interest rates near zero. During this period, the investment income on insurance float was severely compressed. An insurer with $10 billion in float earning 1% on its bond portfolio generated $100 million in annual investment income. The same $10 billion at 4.5% generates $450 million. The difference — $350 million per year — is the direct consequence of the interest rate normalisation that began in 2022.
The rate cycle has confirmed that the investment income component of float value is highly sensitive to the interest rate environment — and that the decade of near-zero rates dramatically suppressed the economic value of float in a way that earnings models and P/E ratios captured partially but float analysis captures precisely. Insurers that maintained their float through the near-zero rate period — paying claims, keeping policyholders, writing new business at or near combined ratio breakeven — were positioned to capture the full benefit of rising rates in 2022 to 2024. The companies that maintained underwriting discipline during the lean years and avoided the temptation to chase underwriting profit by cutting prices and extending terms owned the same float at the same near-zero balance sheet cost — but now earn 4% to 5% rather than 1% on it. The float’s value, expressed as investment income per year, has quadrupled without any change in the float’s size.
This is a confirmed, already-realised catalyst. Berkshire’s insurance investment income line — the direct output of deploying float into investable assets — grew dramatically from 2022 to 2024. The market began to price this in as rising rates flowed through to insurer earnings, but the structural message is more durable: interest rates are unlikely to return to near-zero levels in any near-term scenario, meaning the elevated investment income on float is structural rather than cyclical.
Catalyst 2: The Hard Insurance Market Has Improved Float Quality Across the Industry
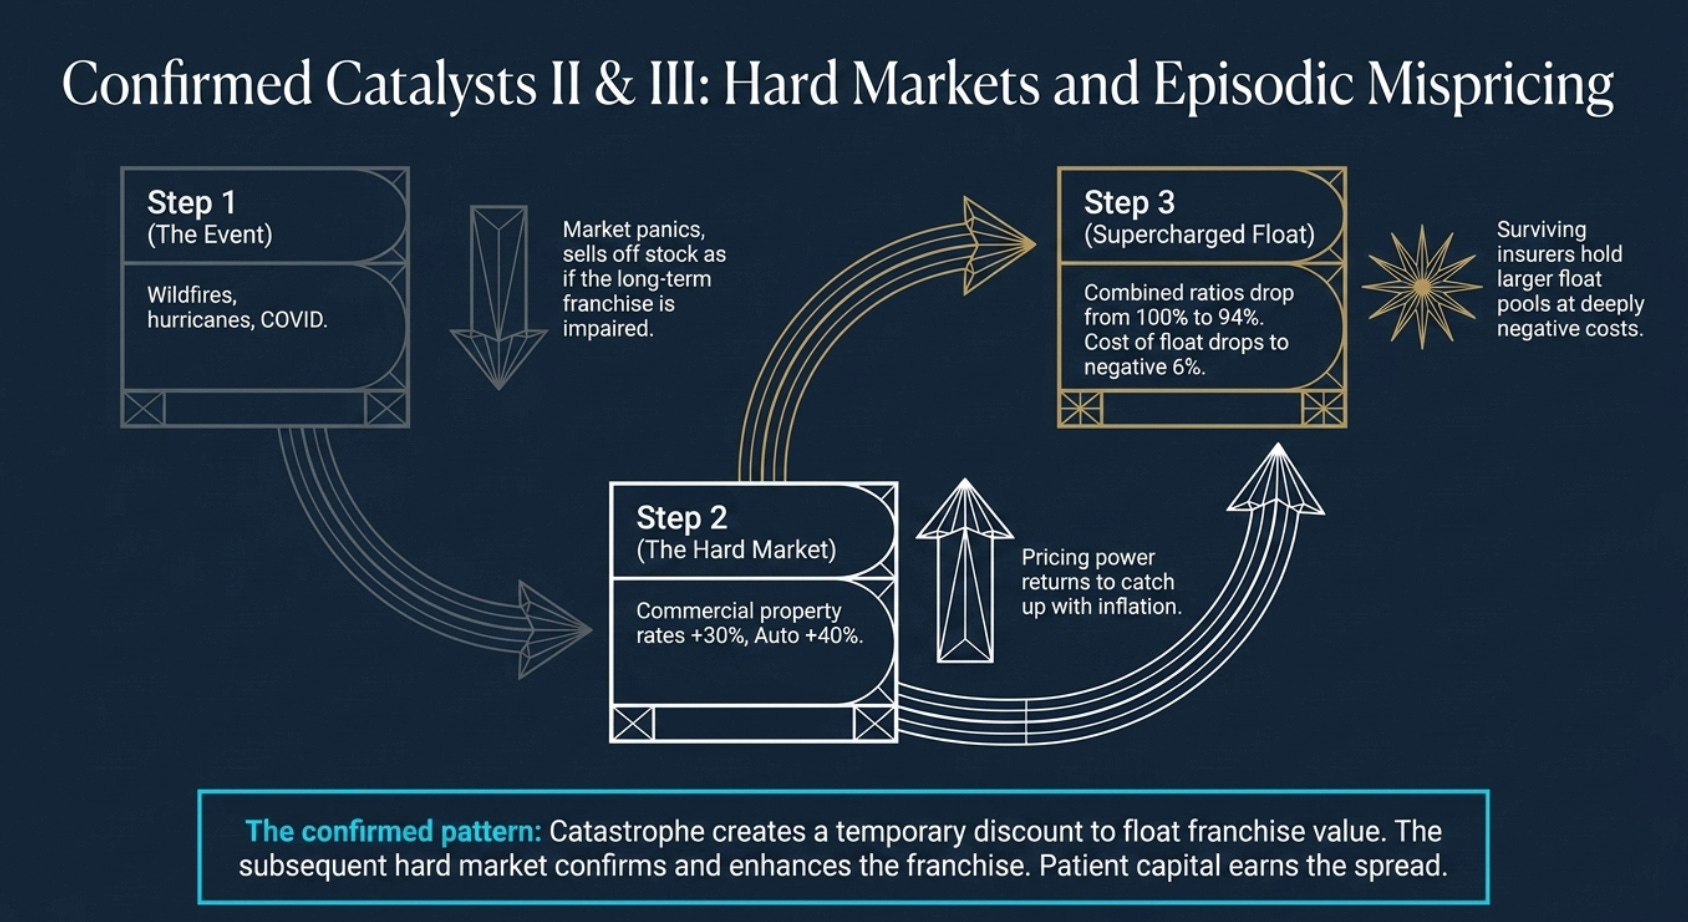
Following several years of significant catastrophe losses — California wildfires, Atlantic hurricanes, mid-continent convective storms, and the COVID-related liability uncertainty — the global property-casualty insurance market entered a sustained hardening cycle from approximately 2020 to 2024. Insurance prices rose substantially across most lines, with commercial property rate increases exceeding 20% to 30% in some categories and personal lines auto insurance raising rates 30% to 40% to catch up with inflation in repair costs.
A hard insurance market does two things simultaneously that expand float value. It increases premium volume, which directly increases float as more premium is collected and held. And it improves underwriting profitability, which reduces the cost of float — if the combined ratio falls from 100% to 94%, the cost of float drops from zero to negative 6%, meaning policyholders are paying the insurer 6% to hold their money. Berkshire’s 2024 annual report disclosed 14 consecutive years of underwriting profit, with $28 billion in cumulative pre-tax underwriting gains — the direct consequence of underwriting discipline through a period of market hardening. The Berkshire 2024 operating earnings were $47.4 billion, with insurance underwriting contributing approximately $9 billion and insurance investment income contributing further.
Catalyst 3: Catastrophe Mispricing Creates Episodic Windows to Acquire Float Cheaply
When a major catastrophe — a hurricane, an earthquake, a pandemic — strikes, insurance stocks typically decline immediately as the market prices in expected losses. The response is usually correct in the short term: claims will be paid, earnings will be affected. But the market frequently overcorrects, selling insurance stocks as if the catastrophe impairs not only current earnings but the long-term value of the float franchise.
The float does not disappear after a catastrophe. The loss reserves increase — reflecting the claims to be paid — but the investable float remains invested and earning returns. The underwriting franchise that generated the float continues operating, writing new business, collecting new premiums. In many cases, a major catastrophe actually strengthens the long-term value of insurance franchises by prompting widespread premium increases — hardening the market precisely because capacity has been reduced and prices must rise to attract new capital back into the industry. The insurer that survived the catastrophe, maintained its balance sheet, and remains a going concern benefits from higher prices on all subsequent business — directly improving the future cost of float.
This mechanism has repeated itself after every major catastrophe cycle in modern insurance history. The investors who bought quality insurance franchises in the aftermath of Hurricane Andrew in 1992, the 9/11 attacks in 2001, Hurricanes Katrina and Rita in 2005, and COVID in 2020 — at prices reflecting panic-driven selling of float-rich franchises — consistently earned above-market returns as the hard market cycle that followed each event improved underwriting profitability and directly reduced the cost of the surviving insurers’ float. The confirmed pattern is: catastrophe creates a temporary discount to float franchise value; the hard market that follows confirms and enhances the franchise; patient capital earns the spread.
CONCLUSION: THE BALANCE SHEET LIABILITY THAT ACTS LIKE AN ASSET
Berkshire Hathaway’s 2024 annual report contains a sentence that is, in retrospect, the most important sentence in the entire document: “Our float has grown from $46 billion to $171 billion” over the past two decades. The sentence is presented as a data point. It is actually a summary of one of the greatest feats of capital accumulation in the history of finance.
In those two decades, Berkshire did not issue $125 billion in debt to grow its investment pool. It did not dilute shareholders by $125 billion in equity issuance. It took in insurance premiums, paid claims, and held the difference — the float — for investment. The $125 billion in incremental float was provided by policyholders who needed insurance, under contracts that allowed Berkshire to invest the premium float during the period between collection and claim payment. And because the underwriting was profitable — combined ratios below 100% for most of those twenty years — the policyholders paid Berkshire for the privilege of providing this capital.
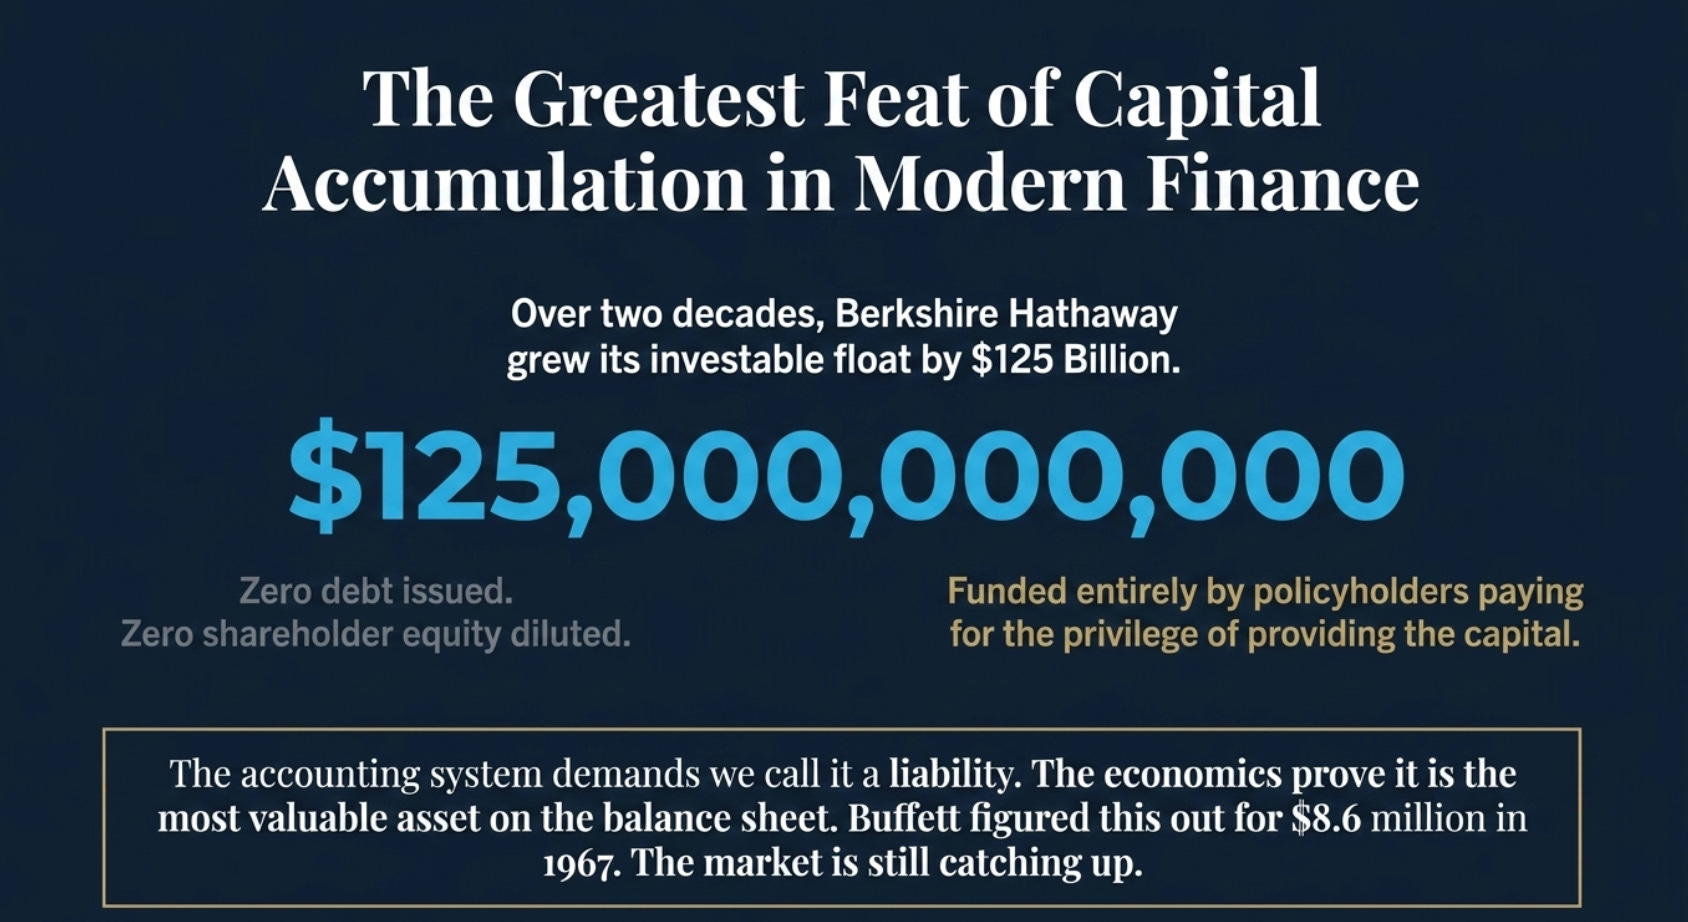
The balance sheet shows $171 billion in insurance liabilities. The economic reality is $171 billion in permanent, revolving investment capital at zero or negative cost. The gap between those two descriptions is not a philosophical distinction. It is the source of Berkshire Hathaway’s status as one of the largest and most consistently compounding businesses in the history of capital markets.
The P/E ratio tells you nothing about this. The Price-to-Book ratio tells you very little. EV/EBITDA, applied to the insurance segment alone, would produce a number that reflects current underwriting results and current investment yields — useful information but not the relevant question. The relevant question is: what does the float cost, how large is it, how durable is that cost, and what does the market price imply about the value of that capital pool? When the market’s implied price for the float — backed into from the total enterprise value and the non-insurance asset value — is below the present value of the investment income the float will generate over its remaining life at current yields, the insurer’s equity is cheap by the only measure that matters for this particular type of business.
Insurance is the only business in the world where, if you are genuinely good at what you do, your customers pay you to borrow their money. The accounting calls it a liability. The economics call it the most valuable thing on the balance sheet.
Buffett figured this out in 1967, for $8.6 million. The market is still catching up.
This white paper is for educational and informational purposes only. Berkshire Hathaway financial data is drawn from publicly available Annual Reports filed on berkshirehathaway.com, including the 1998, 2000, 2001, 2016, and 2024 Annual Reports. General Re float and underwriting data is drawn from Berkshire Hathaway’s shareholder letters for the relevant years. GEICO premium and float data is drawn from Berkshire’s consolidated insurance disclosures. The float calculation methodology described is consistent with the methodology disclosed by Berkshire Hathaway in its annual reports. Nothing herein constitutes investment advice.
If you like what you read, check out my other writings 👇
Rust, Rigs, and the Recurring Revenue Hidden in Plain Sight: A Deep Dive into Beng Kuang Marine (SGX: BEZ)

The Old Steel and the Sea: Why You Should Care About a Ship Maintenance Company
Investment Reflection #2 — The Grand Play: 100 Years of the World’s Nations as Characters in the Greatest Story Ever Told

“The world is not a chessboard. It is a living organism, where every cell — every nation — eats, competes, cooperates, and occasionally tries to eat the others. Understanding it requires not just memorizing moves, but understanding hunger.”

The Tide Is Going Out: Commodity Houses, Private Credit, and the AI Debt Bomb

Start Here: What This Article Is About
Why I Passed on Graftech (EAF): Riding The Battery Hype, Or Perhaps Not...

There is a kind of company that is the most dangerous thing in investing. It is not the fraudulent company. It is not the obviously bad company with terrible products and incompetent management. Those are easy — you just avoid them. The truly dangerous company is the one with a
The Beautiful Trap: Why I'm Passing on The Hour Glass (SGX: AGS)

There’s a peculiar kind of investment that keeps you up at night — not because it’s bad, but because it’s genuinely good. Good enough to admire. Not good enough to buy.
The Diamond in the Rough That Isn't Quite Yours: Why I Passed on Boustead (SGX: F9D)

There is an old saying that investors have borrowed, bent, and quoted so many times it has nearly lost its sharpness: a bird in the hand is worth two in the bush. Warren Buffett, characteristically, gave it a precise mathematical form. The value of any investment, he wrote, is determined by three questions:
The Schoolteacher's Secret Insurer: Why Horace Mann (NYSE:HMN) Is Sitting on My Watchlist

“The stock market is a device for transferring money from the impatient to the patient.” — Warren Buffett

The Dormitory King That Couldn't Leave Home: Why I Passed on Centurion (SGX: OU8)

There is a deceptively simple question that Warren Buffett borrowed from Aesop’s ancient fable, and has repeated across decades of shareholder letters: “How many birds are in the bush? How sure are you they’re there? And how long until you get them out?”
The Children's Place: A $90 Million Bet on a Company That Used to Be Worth $2 Billion (NYSE: PLCE)

There is a classic scene in every heist movie. The detective walks into a room, sees the chalk outline, the scattered evidence, the broken window, and immediately knows something went terribly wrong long before anyone called the police. You do not need the full autopsy report to read the body.
World War 3 In Iran and Why Oil Price Will Continue Increasing — It Arrived Sooner Than Anyone Expected

This is Part 2 of a continuing analysis of California Resources Corp (CRC). Part 1 built the foundational investment case: a company trading at $44 per share against a conservative intrinsic value of $108–$156, built on 567 million barrels of proved developed oil reserves in California, and a management team spending hundreds of millions buying back its…
The Most Overlooked Oil Company in America — And Why That Might Be the Opportunity of the Decade

Date of analysis: 28 December 2025
The Art Of Saying No - MYPS: Playstudios Inc

PLAYSTUDIOS (MYPS) is a Las Vegas-based mobile gaming company that operates free-to-play social casino games and a loyalty platform called playAWARDS, which lets players redeem points for real-world rewards at places like MGM Resorts, Norwegian Cruise Line, and Wolfgang Puck restaurants. On the surface, this sounds like a clever moat. A loyalty program.…
The Art Of Saying No - UGP: Ultrapar Participacoes S.A (Part 2 of 2)

Question 2: How Certain Are You?
The Art Of Saying No - GLIBK: GCI Liberty Inc

Picture this: a single telecommunications company — the dominant one — serves over 200 communities scattered across the largest state in the United States. Alaska. A state with just over one person per square mile. A state where 39% of residents are underserved by broadband. A state where, until recently, some villages received internet via satellite li…

The Art Of Saying No - UGP: Ultrapar Participacoes S.A (Part 1 of 2)

The Setup: A Value Investor Dream?


The Art of Saying No - RIG: Transocean LTD

“The difference between successful people and really successful people is that really successful people say no to almost everything.” — Warren Buffett
The Art of Saying No - KPRX: Kiora Pharmaceuticals Inc

“The difference between successful people and really successful people is that really successful people say no to almost everything.” — Warren Buffett
The Art of Saying No - DNUT: Krispy Kreme Inc

“The difference between successful people and really successful people is that really successful people say no to almost everything.” — Warren Buffett

🎓 A Business Strategy Primer Part 7 - Learning From Great Companies

The Billion-Dollar Playbook: How Market-Based Management Powered Koch Industries’ Unstoppable Rise
The Art of Saying No - MRX: Marex Group PLC

“The difference between successful people and really successful people is that really successful people say no to almost everything.” — Warren Buffett


The Art of Saying No - SFIX: Stitch Fix Inc

“The difference between successful people and really successful people is that really successful people say no to almost everything.” — Warren Buffett
🎓 A Business Strategy Primer Part 2 - Brainstorming Solutions With Value At The Core

Creating An Irresistible Offer
The Art of Saying No - TDOC: Teladoc Health Inc

“The difference between successful people and really successful people is that really successful people say no to almost everything.” — Warren Buffett

The Art of Saying No - MDU: Mdu Resources Group Inc

“The difference between successful people and really successful people is that really successful people say no to almost everything.” — Warren Buffett


The Art of Saying No - AFCG: Advanced Flower Capital Inc

“The difference between successful people and really successful people is that really successful people say no to almost everything.” — Warren Buffett
The Art Of Saying No - VYX: NCR Voyix Corp

“The difference between successful people and really successful people is that really successful people say no to almost everything.” — Warren Buffett
The Art of Saying No - VSTS: Vestis Corp

“The difference between successful people and really successful people is that really successful people say no to almost everything.” — Warren Buffett

🛢️Basic Energy Primer Part 2 - Business and Competitive Landscape

The Man Who Bet Everything on Being Wrong
The Art of Saying No - CISS: C3is Inc

“The difference between successful people and really successful people is that really successful people say no to almost everything.” — Warren Buffett
The Art of Saying No - PSHG: Performance Shipping Inc

“The difference between successful people and really successful people is that really successful people say no to almost everything.” — Warren Buffett

The Art Of Saying No - MAGN: Magnera Corp

The Magnera Corporation Analysis Nobody Asked For (But Everyone Needs)
The Art of Saying No - CHR: Cheer Holding Inc

“The difference between successful people and really successful people is that really successful people say no to almost everything.” — Warren Buffett
The Art of Saying No - WIMI: WiMi Hologram Cloud Inc.

“The difference between successful people and really successful people is that really successful people say no to almost everything.” — Warren Buffett
⚡️Alternative Energy Primer Part 3 - Industry and Sector Technicals

The €2.2 Billion Mistake That Revealed Everything
⚡️Alternative Energy Primer Part 2 - Business & Competitive Landscape

The Shipwreck That Changed Everything

🏥 A U.S. Health Insurance (Managed Care Organizations) Sector Primer

1️⃣ Industry Fundamentals & Macro View

