
Preamble: The Core Insight
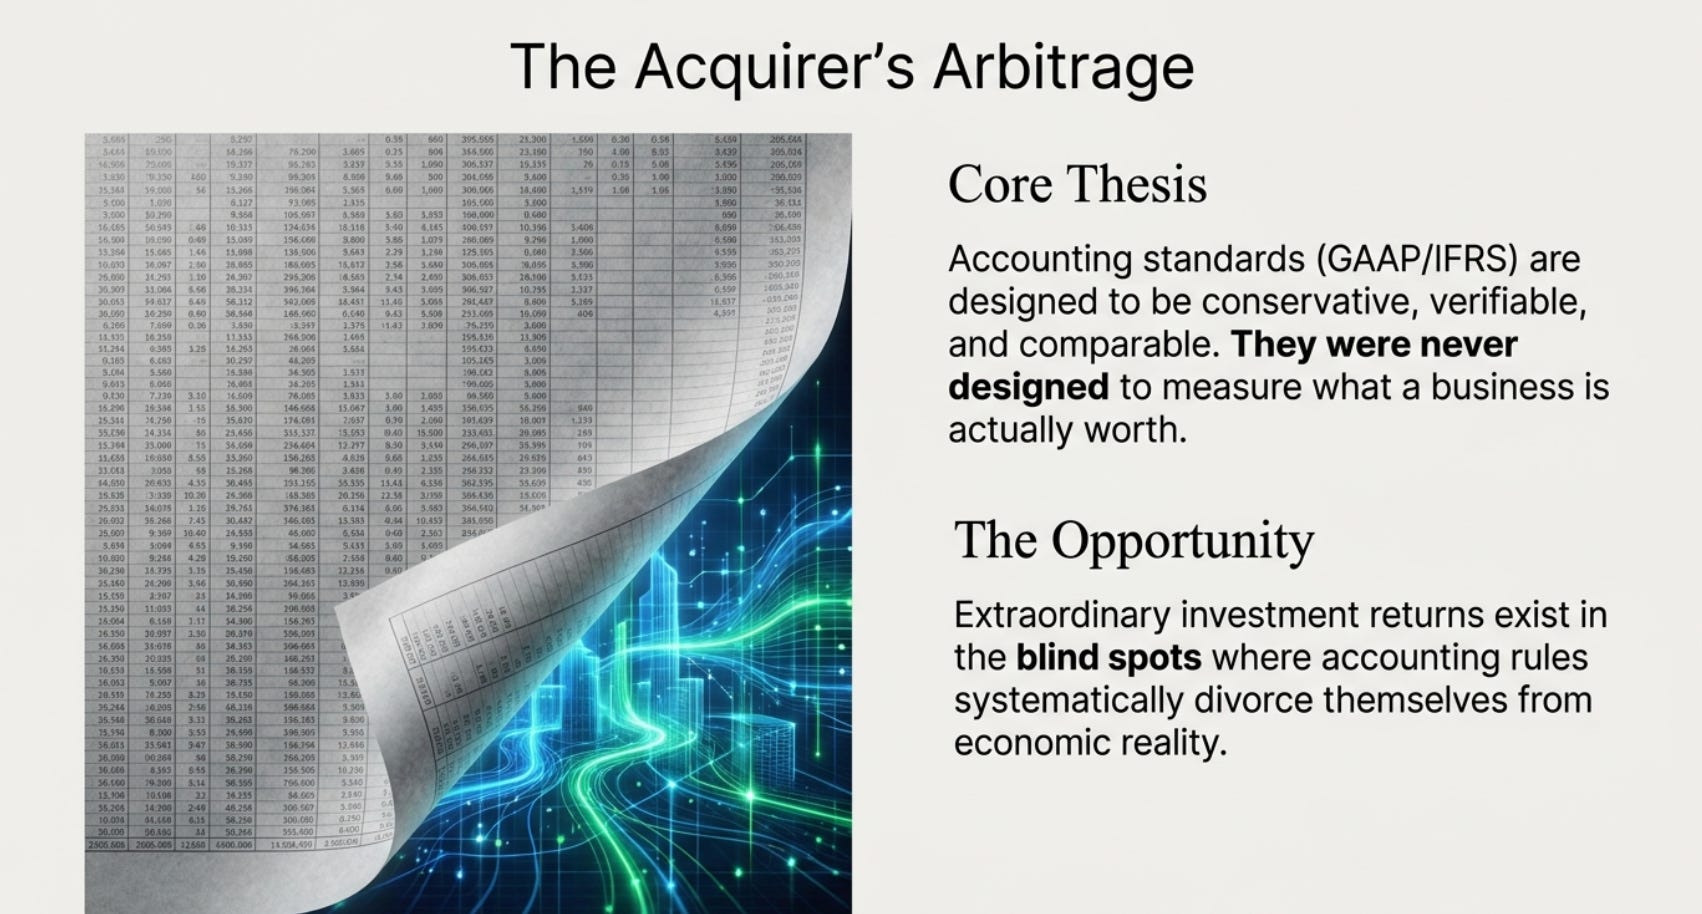
There is a fundamental tension at the heart of corporate finance, and most investors walk past it every day without noticing. Accounting standards — whether US GAAP or IFRS — were designed to be conservative, verifiable, and comparable. They were not designed to tell you what a business is actually worth.
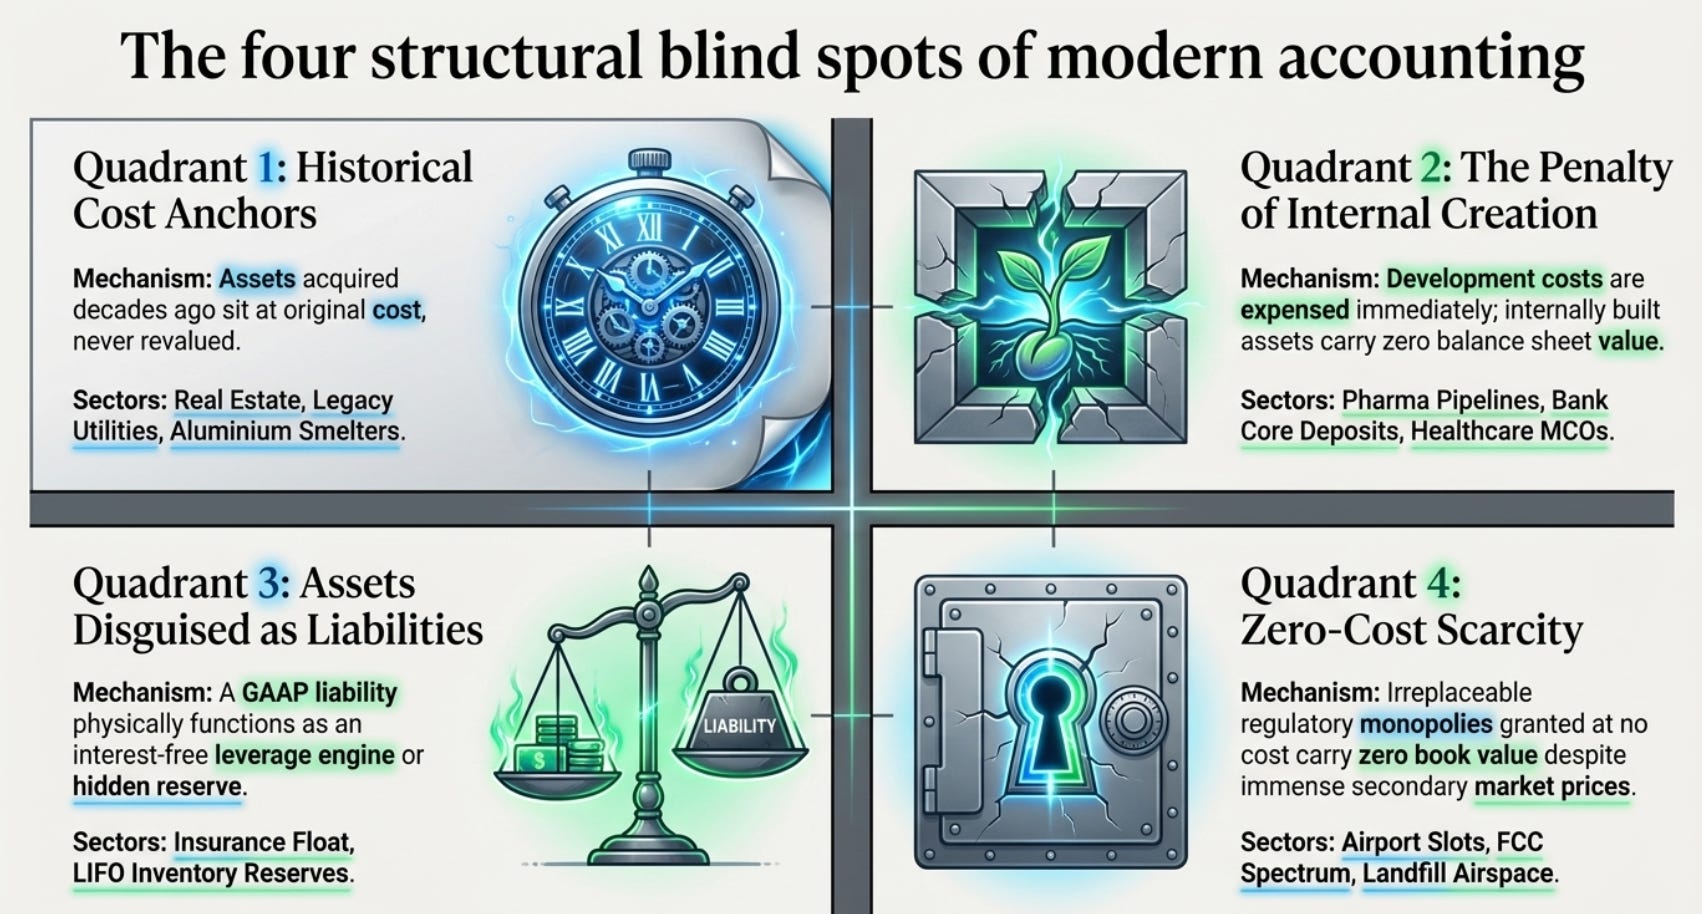
The result is predictable: wherever accounting rules divorce themselves from economic reality, assets appear cheap. The gap between what accountants say an asset is worth and what a buyer would pay for it today, right now, in cash — that gap is where extraordinary investment returns have always been made.
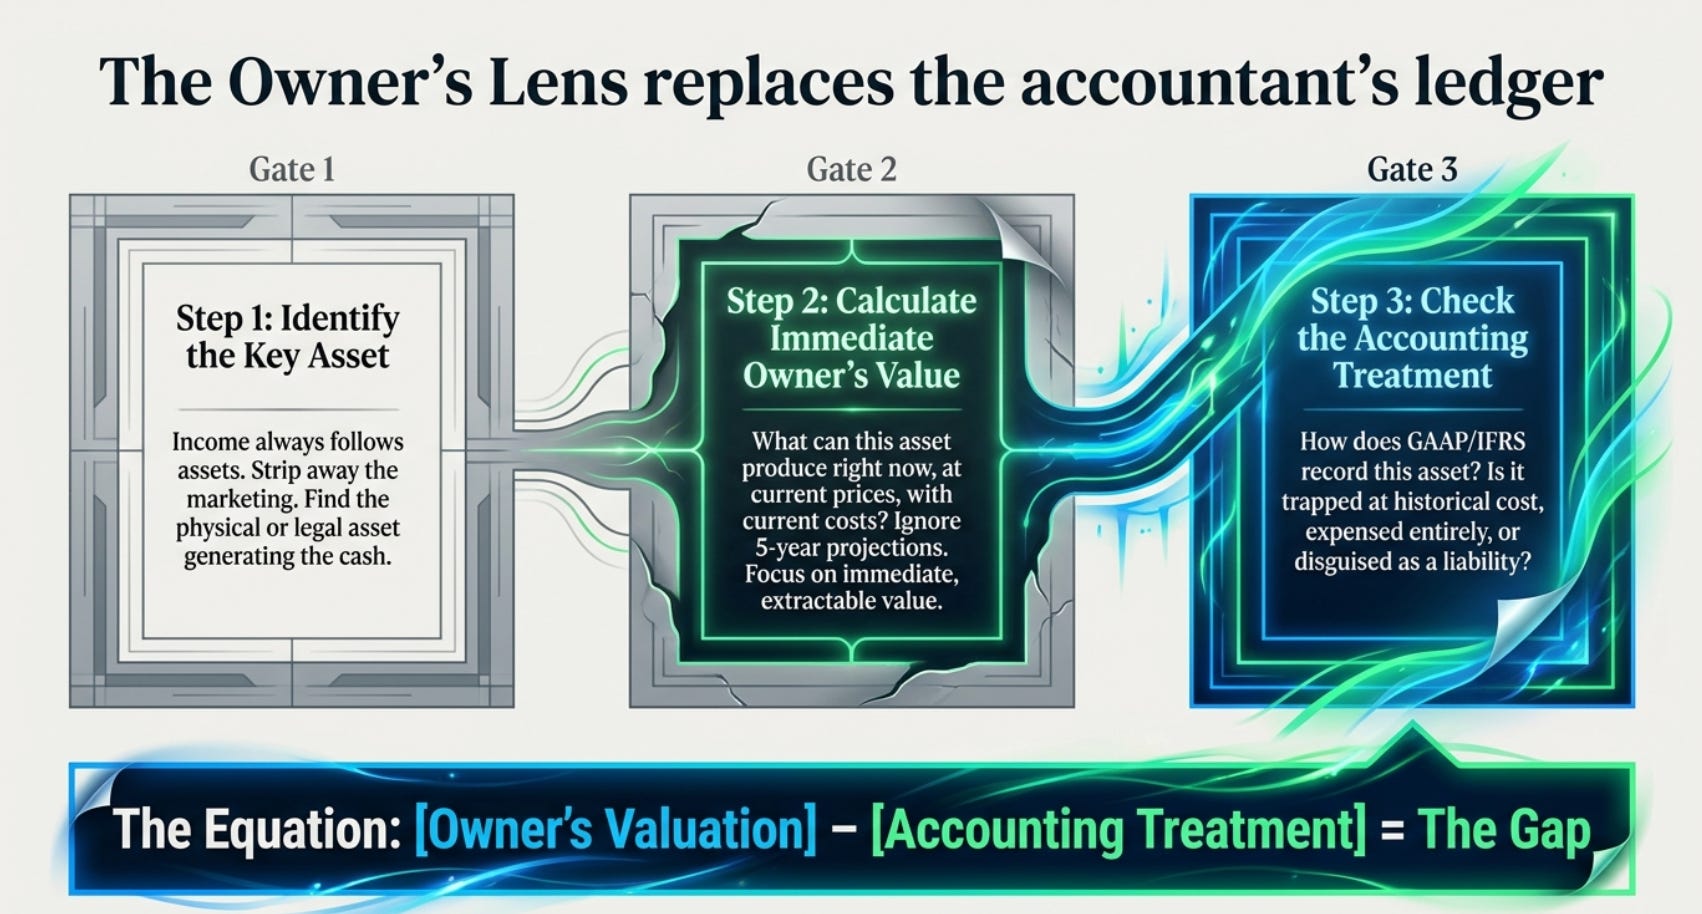
The discipline this white paper applies is simple. For each sector, we ask three questions in sequence:
Question 1: What is the key asset generating this business’s income? Income always follows assets. A bank earns money because it has deposits. An oil company earns money because it has reservoirs. A steel distributor earns money because it has inventory. Strip away the marketing and find the asset.
Question 2: What would a business owner pay for that asset today — not based on what it might earn in five years, but based on what it can produce right now, at current prices, with current costs? This is the owner’s test: what is the immediate, extractable, defensible value?
Question 3: How does GAAP or IFRS book that same asset? And if there is a gap — sometimes a chasm — between the two numbers, why does it exist, and how large is it?
We apply this framework across sectors, with actual reported data from annual reports and market transactions, not projections.
PART I: ENERGY AND NATURAL RESOURCES
1. Oil & Gas Upstream (E&P) — Proved Developed Producing Reserves
The Key Asset
An oil and gas exploration and production company earns its living from one thing: hydrocarbons already in the ground, accessible from wells already drilled, connected to infrastructure already built. These are called Proved Developed Producing (PDP) reserves — the most conservative and certain category of reserves a petroleum engineer can certify. The well is drilled. The pipe is in the ground. The oil is already flowing.
What a Business Owner Would Pay Right Now
A business owner looking at a PDP reserve package does not need to model the future or forecast commodity prices. The exercise is arithmetic: take the current price of oil, subtract the cost of lifting it out of the ground (Lease Operating Expense, or LOE), and multiply by the number of barrels. That is your cash flow. Discount it at a rate appropriate for the risk-free nature of these assets — PDP wells have mechanical decline curves that petroleum engineers can calculate to within a few percent of accuracy.
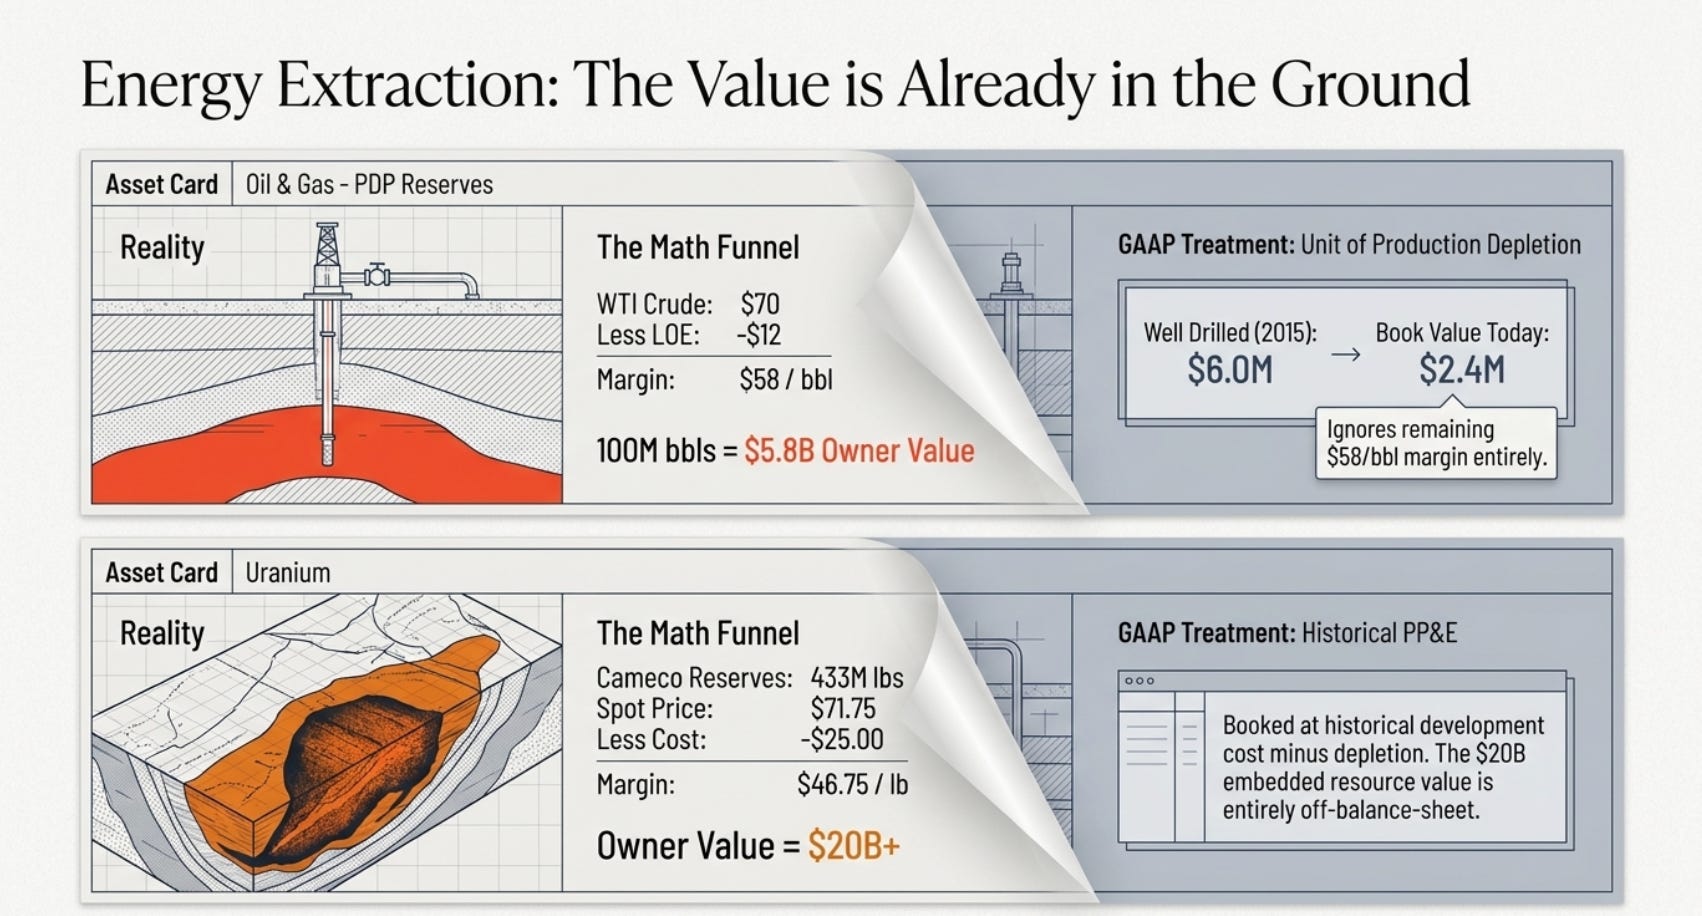
Concretely: if WTI crude oil trades at $70 per barrel, and a well’s LOE is $12 per barrel (a typical Permian Basin figure from ExxonMobil’s operational disclosures), then every barrel in PDP reserves generates $58 in gross operating margin before taxes. A well with 500,000 barrels of proved developed producing reserves has an immediate, extractable operating profit of $29 million. No exploration risk. No drilling risk. No infrastructure risk.
The SEC requires E&P companies to disclose a metric called PV10 — the present value of future net revenues from proved reserves discounted at 10% per annum, calculated using the trailing 12-month average commodity price. PV10 is the closest thing accounting produces to what a buyer would pay. But PV10 covers all proved reserves, including undeveloped ones that require future capital investment. The subset that matters for a business owner is PDP PV10 — only currently producing wells.
The Accounting Treatment (GAAP)
Under GAAP, oil and gas reserves are not assets at all in the conventional sense. A company does not “book” the value of its reserves on the balance sheet. Instead, it capitalizes the cost of drilling and completing wells, and then depletes those costs against production using the Unit of Production (UOP) method. A company that drilled a Permian Basin well in 2015 for $6 million and has since produced 60% of that well’s reserves will show a net book value of roughly $2.4 million for that well — completely independent of what the oil in the ground is worth at today’s prices.
The result is a profound disconnect. A barrel of oil proved developed producing at $70/bbl WTI with $12 LOE has an immediate net value of roughly $58. A company holding 100 million such barrels would have an owner-assessed value of $5.8 billion in gross operating income just from existing production, before any overhead. On the balance sheet, that same company might show $800 million in net property, plant, and equipment after accumulated depletion.
The Documented Discrepancy
Gorozen Capital, a specialist energy investment fund, documented this precisely in November 2019. Analyzing all US-listed E&P companies with market capitalizations above $100 million and proved reserves more than 50% oil, they found that the average company in their universe was trading at a 12% discount to its net-debt-adjusted SEC PV10 value — meaning investors were paying less for the whole company than the accountants’ own conservative calculation said the proved reserves alone were worth. More strikingly, 12 of 29 companies in the universe were trading below their PDP PV10 alone — that is, the market was assigning negative value to every proved undeveloped location, every future drilling inventory, and every corporate franchise in 12 separate public companies.
This is not an obscure metric. The PDP PV10 represents the value of oil already being produced from wells already drilled. A company trading below that number is priced as if it will be shut down immediately and liquidated.
The 2020 COVID period replicated this, and the 2021–2022 recovery cycle validated the thesis: E&P companies like Pioneer Natural Resources, Devon Energy, and EOG Resources — each trading at or below PDP PV10 in early 2020 — returned between 150% and 400% to investors over the subsequent 24 months as commodity prices normalized and their balance sheet value was recognized.
2. Uranium — In-Ground Ore Body Value
The Key Asset
A uranium mining company’s primary asset is a proven and probable mineral reserve — a certified quantity of uranium ore in the ground, measured in pounds of uranium oxide (U₃O₈), that can be economically extracted at current prices.
What a Business Owner Would Pay Right Now
The uranium market is unique because nuclear utilities buy uranium under long-term contracts with prices negotiated directly between producers and utilities. The spot price provides a floor and a reference. As of mid-2025, uranium spot price was approximately $71.75 per pound of U₃O₈.
Kazatomprom, the world’s largest uranium producer, operates primarily through in-situ recovery (ISR) methods at a cash operating cost of approximately $9–$12 per pound. This is documented in their annual report disclosures. Cameco, the second-largest producer, operates at higher costs of roughly $20–$30 per pound given its underground operations at Cigar Lake and McArthur River.
For Cameco specifically: the company disclosed in its operations summary that it has access to more than 433 million pounds of proven and probable mineral reserves (its share). At a spot price of $71.75 per pound with an average operating cost of approximately $25 per pound, the immediate extractable margin per pound is roughly $46.75. Across 433 million pounds, the total operating income embedded in proven reserves alone exceeds $20 billion — without a single new exploration dollar spent. Cameco’s market capitalization as of early 2026 was approximately $22–25 billion, meaning the market is paying roughly 1.1–1.2x the gross operating income of existing reserves, and assigning essentially zero value to the company’s processing infrastructure, long-term contract book, and fuel fabrication business.
Importantly, demand for uranium is structurally exceeding supply by over 20%, with no new tier-one mines brought online since Cigar Lake in 2014. The replacement cost of existing high-grade reserves is functionally incalculable for assets like Athabasca Basin properties — there are no known comparable deposits available for development.
The Accounting Treatment (GAAP/IFRS)
Under both GAAP and IFRS, mineral reserves are not recognized as assets on the balance sheet. The costs of exploration and development drilling are capitalized under Property, Plant, and Equipment, then depleted against production using UOP. Cameco’s balance sheet shows its uranium operations as PP&E at historical development cost less accumulated depletion — a figure that has no relationship to the $20+ billion in in-ground reserve value described above.
The Discrepancy
The balance sheet says “property and plant” at historical cost minus depletion. An owner looking at the same asset says “reserves times net price per pound.” The gap for a company like Cameco is measured in the tens of billions. The market partially prices in reserve value through its premium to book, but given the long-term supply deficit, the market chronically underprices the scarcity value of tier-one, low-cost reserves — a situation structurally identical to the pre-shale-boom oil underpricings of the 1990s. This would sit well with a macro investor, but that’s not my core competency.
3. Phosphate and Potash — Mineral Rights and Ore Body Scarcity
The Key Asset
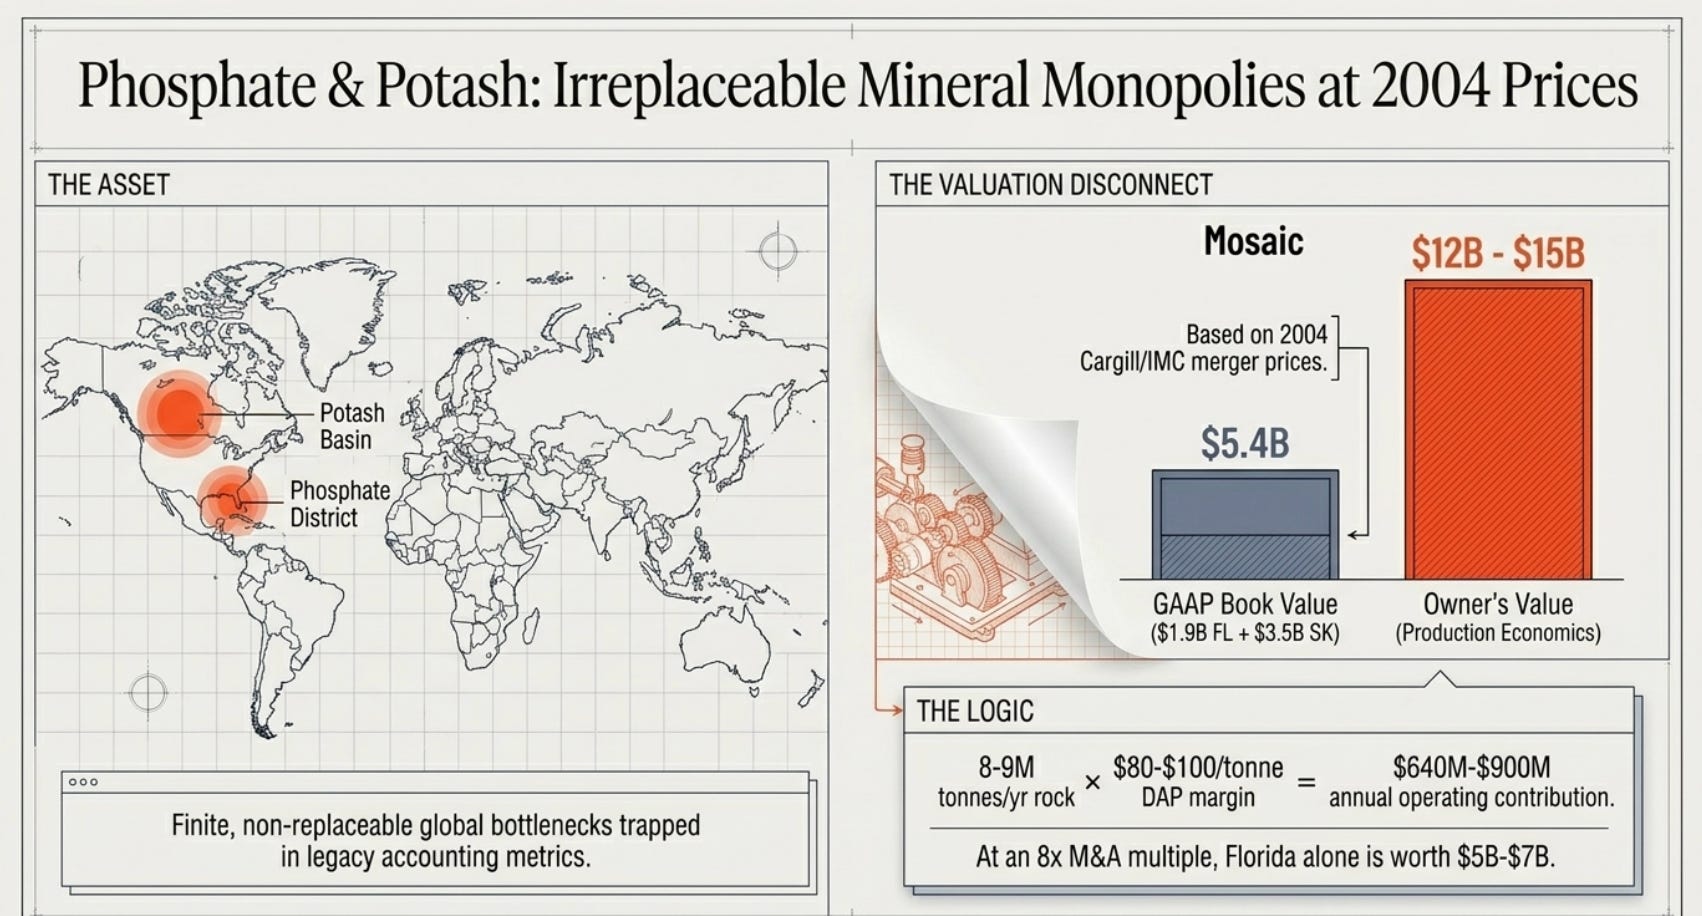
Fertilizer companies producing phosphate and potash derive their competitive position entirely from owned mineral reserves. Phosphate deposits globally are highly concentrated — Morocco’s OCP controls over 70% of world reserves, and in North America, Florida’s phosphate district is the only significant domestic source. Potash is similarly concentrated in Saskatchewan (Nutrien, Mosaic) and Belarus/Russia. These are finite, non-replaceable assets.
What a Business Owner Would Pay Right Now
A business owner assessing a phosphate mining operation would count the tonnes of proven and probable ore in the ground, apply the current market price for diammonium phosphate (DAP, which traded at approximately $550–$600 per metric tonne in 2022–2023 and approximately $400–$450 in 2024), subtract the mining, processing, and transportation costs, and calculate the present value of recoverable margin from existing reserves.
For Mosaic, Florida’s phosphate facilities have a disclosed net book value of $1.9 billion as of December 31, 2023 (per their 10-K filing). Yet the company’s Florida phosphate assets produce approximately 8–9 million tonnes per year of phosphate rock. At a finished DAP margin of roughly $80–$100 per tonne above cash costs (a conservative figure from their own segment reporting), the annualized operating contribution from Florida phosphate alone is $640–$900 million per year. At an 8x EBITDA multiple — the approximate transaction multiple for comparable agricultural input assets — the Florida phosphate mining franchise would be valued at $5–$7 billion by an acquirer. The book value is $1.9 billion.
For potash: Mosaic’s Esterhazy mine in Saskatchewan carries a net book value of $3.5 billion (2023 10-K). Esterhazy is the largest single potash mine in the world. Potash ore in Saskatchewan is irreplaceable — the geological conditions that created it are unique. Replacement cost of an equivalent mining operation at current construction costs (labor, steel, permitting) would be materially higher than book value, and there is no practical alternative to Saskatchewan potash for North American agriculture.
The Accounting Treatment (GAAP)
Mining properties are carried at historical acquisition cost plus development capital, depleted against production using UOP. Mosaic acquired most of its phosphate assets through the 2004 merger of Cargill’s crop nutrition business and IMC Global — at prices reflecting early-2000s commodity assumptions. The embedded in-ground phosphate reserves are not revalued to current market prices.
The Discrepancy
A business owner values the reserve by what it can produce at today’s commodity price, less today’s operating costs. GAAP values it at what someone paid for it 20 years ago, minus what has since been depleted. For Mosaic, the sum of book values across its Florida phosphate and Saskatchewan potash mines ($1.9B + $3.5B = $5.4B combined) compares to an owner’s valuation that would exceed $12–$15 billion based on production economics — a gap of more than $6–$10 billion in a company with a total market capitalization that has ranged between $8 billion and $22 billion in recent years.
💡Pure-play companies we can look at:
Intrepid Potash, Inc. (NYSE: IPI)
ICL Group Ltd (NYSE: ICL)
PART II: METALS
4. Copper — Reserve Value in the Ground
The Key Asset
In the copper mining business, the primary income-generating asset is the ore body — a certified volume of copper-bearing rock with a measured grade (% copper by weight) that determines the pounds of recoverable copper per tonne of rock mined.
What a Business Owner Would Pay Right Now
The business owner’s calculus: copper spot price (approximately $4.20–$4.50/lb as of early 2026) minus the C1 cash cost of mining and processing (typically $1.50–$2.00/lb for open-pit porphyry deposits, based on industry AISC disclosures) gives a net margin of $2.20–$3.00 per pound of recovered copper. Apply this to the proven and probable reserve base.
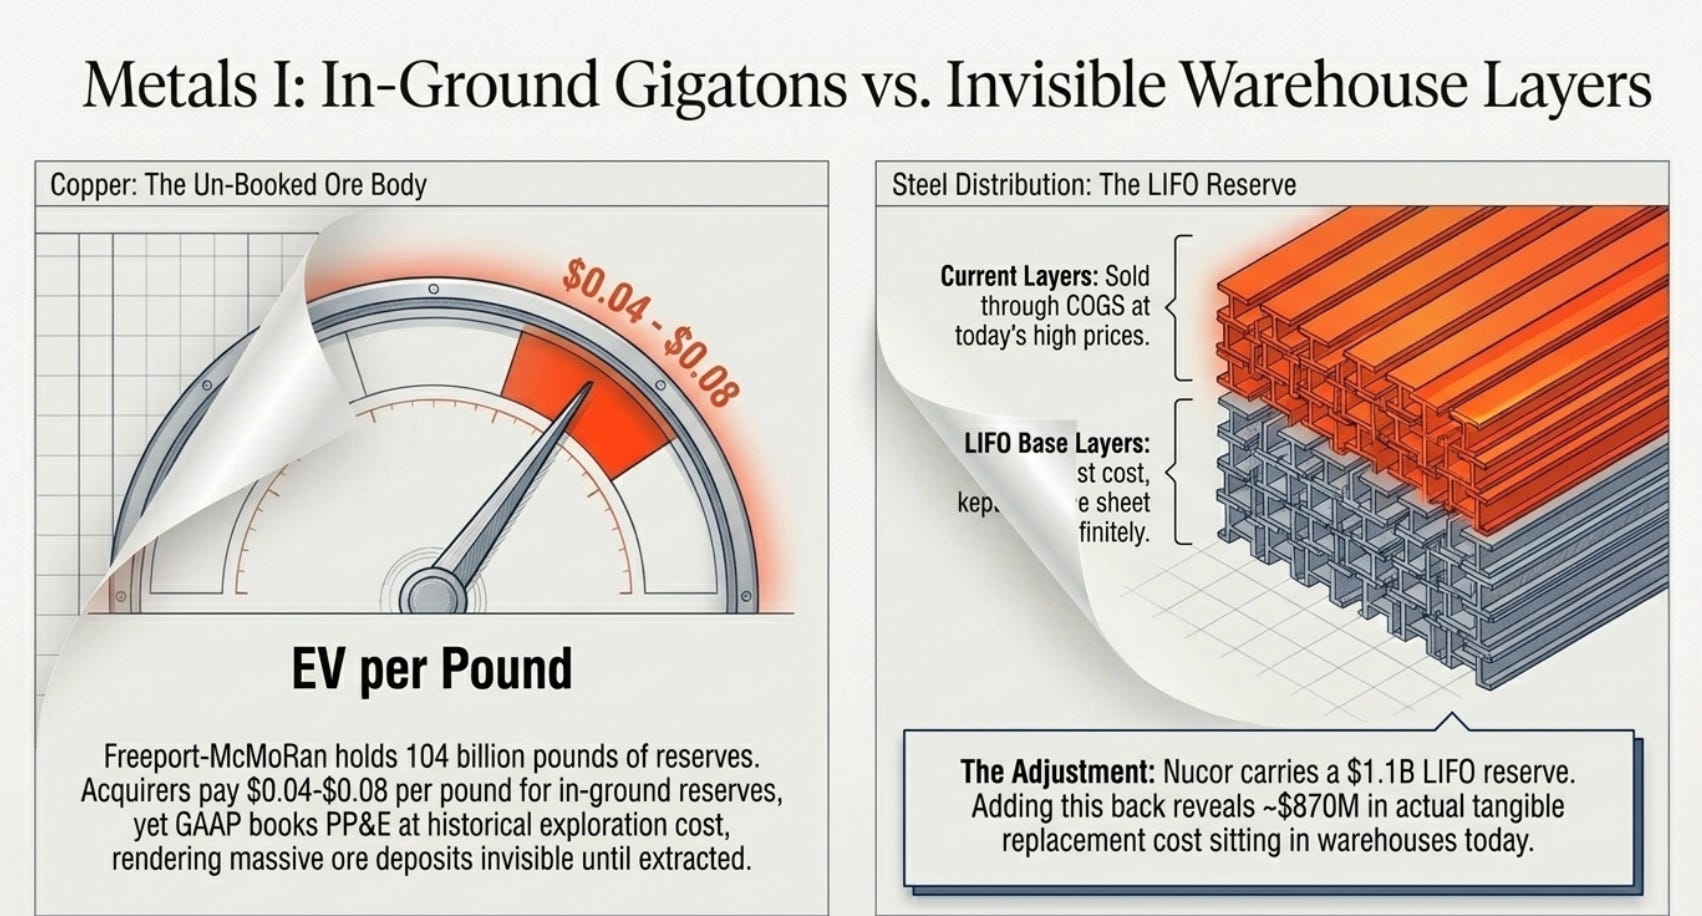
Freeport-McMoRan, the world’s largest publicly traded copper miner, disclosed approximately 104 billion pounds of copper in proven and probable reserves as of its 2023 10-K. At $2.50/lb net operating margin, the total operating income embedded in Freeport’s proven reserves is approximately $260 billion — without a single new exploration dollar. Freeport’s market cap as of early 2026 was approximately $55–65 billion, with a price-to-book ratio of approximately 4.18x. The market is not ignoring the reserves — it prices them in through the P/B premium — but the disconnect is that GAAP book value of mineral assets carries no relationship to in-ground copper value.
The more acute opportunity historically has been smaller copper companies where the market P/B premium collapses during commodity downturns. In 2015–2016, when copper fell to $2.00/lb, numerous copper producers traded at or below their depreciated book value — despite owning reserves that would be profitable at any price above $1.50/lb. The market was pricing terminal decline; an owner buying the ore body was paying below its bare-bones extraction value.
The Accounting Treatment (GAAP/IFRS)
Mineral reserves are never booked as an asset at fair value. Mining companies capitalize exploration and development costs to Property, Plant, and Equipment, then deplete against production. The Grasberg mine in Papua, Indonesia — one of the world’s largest copper-gold deposits — was acquired by Freeport through a series of historical transactions at prices reflecting 1990s copper economics. The ore body’s current in-ground value at $4.25/lb copper and $2,300/oz gold is orders of magnitude larger than its depreciated book value.
The Discrepancy and Practical Metric
“EV per pound of copper in reserves” is the metric acquirers use. In 2023-2025, acquisitions of copper reserves in quality porphyry deposits transacted at approximately $0.04–$0.08 per pound of copper in the ground (for tier-two deposits). Applying $0.05/lb to Freeport’s 104 billion pound reserve base gives an implied resource value of $5.2 billion — far below the market cap, which suggests the market is actually applying a higher multiple. But for smaller, less liquid copper developers and producers, the opposite has frequently been true: mid-tier copper miners with 5–15 billion pound reserve bases have traded at or below $0.03/lb in-ground, implying that an acquirer buying 100% of the company would pay less than the cost to reproduce the ore body through greenfield exploration (typically $0.08–$0.15/lb for comparable grade deposits).
💡Pure-play companies we can look at:
Capstone Copper Corp (ASX: CSC)
Ero Copper Corp (NYSE: ERO)
Taseko Mines Ltd (NYSE: TGB)
Sandfire Resources Ltd (ASX: SFR)
Hudbay Minerals Inc (NYSE: HBM)
MMG Limited (HKEX: 1208)
5. Iron Ore and Steel — The LIFO Reserve and Infrastructure Replacement Value
The Key Asset (Steel Distribution)
The steel service center and distribution industry’s primary working asset is inventory — millions of tonnes of flat-rolled steel, plate, structural steel, and aluminum products purchased at various points in time and held for resale. The key accounting distortion here is uniquely American: LIFO inventory accounting.
What a Business Owner Would Pay Right Now
A business owner buying a steel service center asks: what is the inventory worth today? Answer: at current replacement cost, which is the current price to purchase equivalent inventory from the steel mill. This is FIFO value — what it would cost to go out and buy the same inventory stack right now.
The GAAP Distortion
US companies using LIFO (Last In, First Out) accounting show their oldest cost layers as the “cost” of unsold inventory. In an inflationary environment, LIFO means the most recent, highest-cost purchases flow through to Cost of Goods Sold (matching current revenues to current costs), while the oldest, cheapest inventory layers accumulate on the balance sheet. This creates the LIFO Reserve: the cumulative difference between what the inventory would be worth under FIFO (replacement cost) and what it is shown at under LIFO.
For Ryerson Holding Corporation, one of the largest US steel service centers with $5.1 billion in annual revenue (2023), LIFO dynamics swing earnings by tens of millions of dollars in a single year. The company reported LIFO income of $59.3 million in Q4 2023 alone as commodity prices declined — meaning inventories were previously booked at higher costs than their current replacement value, the reverse of the inflation case. In 2022, when steel prices surged, Ryerson reported LIFO expense (higher costs flowing through income statement, suppressing reported earnings) while its actual inventory on the balance sheet was worth materially more at replacement cost.
Nucor Corporation, the largest US steel manufacturer and also a service center operator, carried a LIFO reserve of approximately $1.1 billion in its 2022 annual report — meaning its inventory was understated by $1.1 billion relative to current replacement cost. Add this back to book value, tax-effect at 21%, and Nucor’s adjusted tangible book value increases by approximately $870 million. This is not speculative future value — it is the current replacement cost of inventory sitting in warehouses right now, sold to customers within 30–60 days.
The Discrepancy
LIFO reserve disclosure is buried in the footnotes of US GAAP financial statements. Analysts who add back the after-tax LIFO reserve to book value find that numerous steel distributors trade at 0.8–1.2x adjusted book value during commodity downturns — often when their unadjusted P/B looks expensive at 1.5–2.0x. The practical impact: during the 2021–2022 steel price surge, steel distributors’ LIFO reserves expanded by $500 million to $1 billion at individual large companies. Investors using unadjusted book value saw “expensive” companies. Investors who read the footnotes and adjusted for LIFO bought extremely cheap companies.
💡Pure-play companies we can look at:
Worthington Steel, Inc. (NYSE: WS)
Ryerson Holding Corporation (NYSE: RYI)
Olympic Steel, Inc. (NASDAQ: ZEUS)
Friedman Industries, Inc. (NYSE American: FRD)
Ascent Industries Co. (NASDAQ: ACNT)
Bisalloy Steel Group (ASX: BIS)
Minmetals Development Co., Ltd. (SSE: 600058)
Xiamen Xiangyu Co., Ltd. (SSE: 600057)
6. Aluminum — The Depreciated Smelter Value
The Key Asset
Primary aluminum production requires two assets: bauxite ore/alumina refining capacity, and electrolytic smelting capacity (a reduction cell line, often called a “potline”). The smelter — the pot room where aluminum oxide is converted to aluminum metal using massive electrical current — is the critical bottleneck in the supply chain.
What a Business Owner Would Pay Right Now
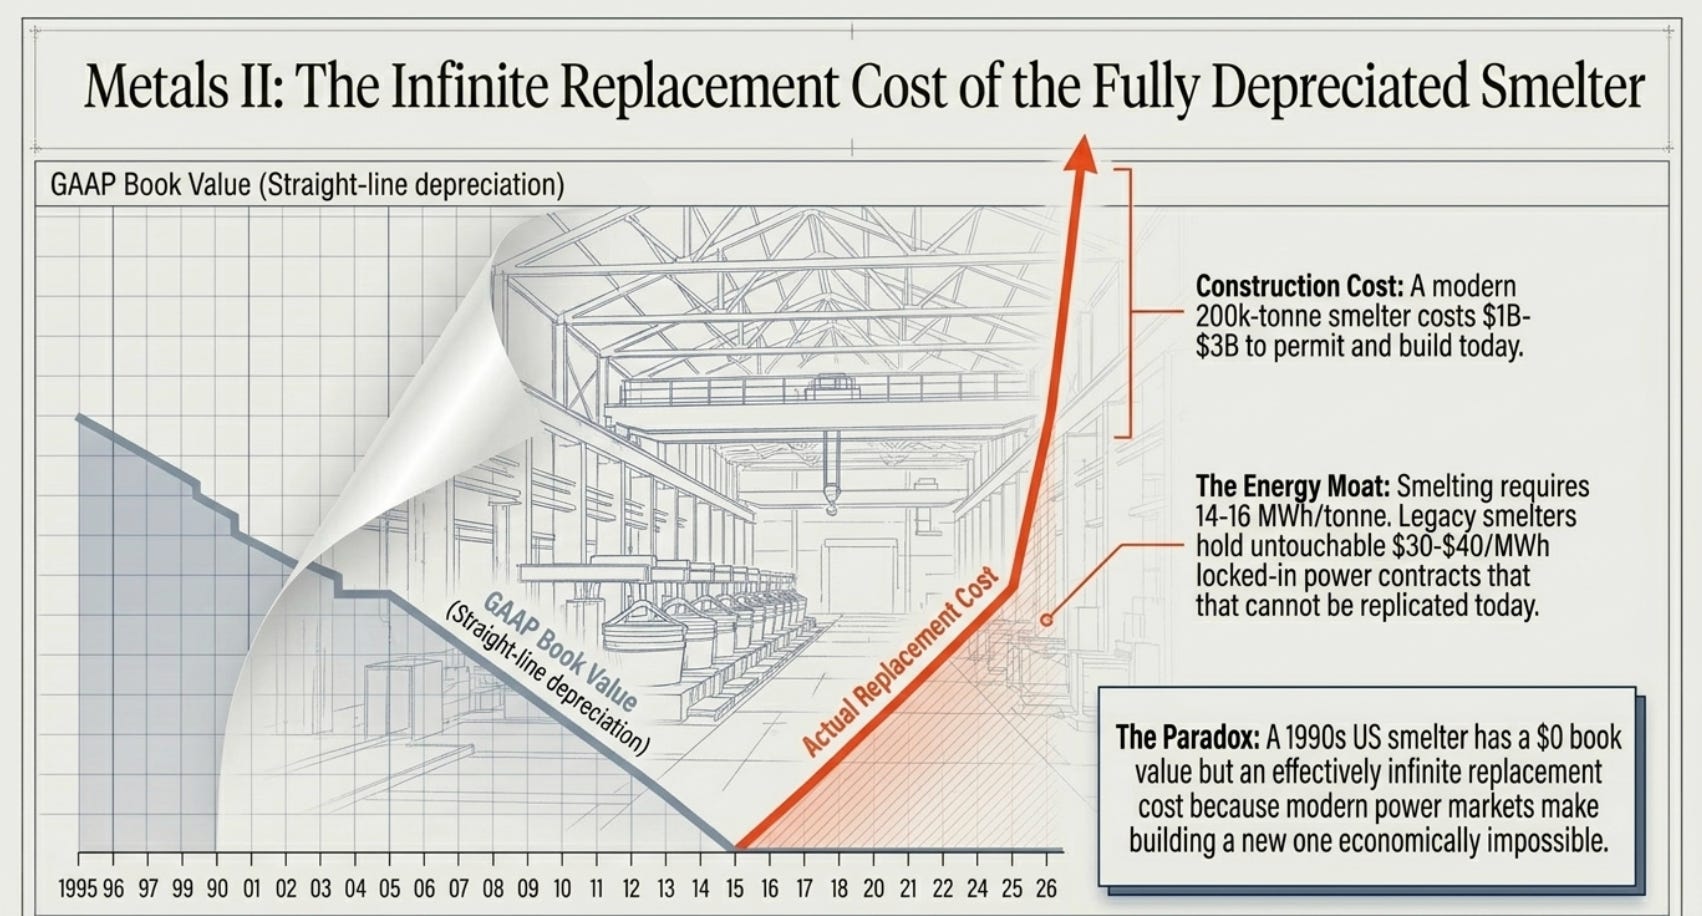
A smelter is valued by an owner based on its production capacity (tonnes per year of primary aluminum), multiplied by the net realized spread between aluminum price ($2,400–$2,600 per metric tonne as of early 2026) and the all-in cash cost of production. For a modern, efficient smelter with access to competitive power — the single largest cost, typically 30–40% of total production cost — this spread is $300–$600 per tonne.
But here is the critical insight: you cannot build a new aluminum smelter in the United States today at any price that makes economic sense. The last significant greenfield aluminum smelter built in the US was Century Aluminum’s Robards, Kentucky facility, completed in the 1990s. Power contracts at competitive rates (aluminum smelting requires approximately 14–16 MWh per metric tonne) are virtually impossible to obtain for a new facility because the power markets have tightened and utilities will not offer long-term industrial power contracts at rates below the levelized cost of new generation.
This means that a 1990-vintage aluminum smelter, fully depreciated on the balance sheet (net book value approaching zero after 25–30 years of straight-line depreciation over a 20-year useful life), has a replacement cost that is effectively infinite in the current power market. The owner of a legacy smelter with a pre-existing, locked-in power contract at $30–$40/MWh is extracting an asset — the power contract and permitted facility — that could not be replicated by a competitor at any capital budget.
Century Aluminum has disclosed historical information showing smelters with net book values of tens of millions of dollars generating hundreds of millions of dollars in EBITDA in favorable aluminum price environments, precisely because the assets were built cheaply decades ago and their replacement cost is not reflected anywhere in financial statements.
The Accounting Treatment
Under GAAP, PP&E is depreciated on a straight-line or declining-balance basis over its useful life. A smelter with a 20-year accounting life built in 1995 was fully depreciated by 2015. If it is still producing aluminum in 2026 — which many are — it sits on the balance sheet at near-zero, regardless of the fact that the cost to construct a comparable facility today would be $1–$3 billion per 200,000-tonne-per-year smelter (construction cost estimates from industry sources, consistent with recent capacity announcements globally).
The Discrepancy
Net book value: near zero for a fully depreciated smelter. Owner’s replacement value: $1–$3 billion plus the incalculable value of the power contract. The premium the market assigns to legacy aluminum capacity is almost entirely invisible in book value comparisons. Companies with fully depreciated smelters running on legacy power contracts — a structural advantage no new competitor can replicate — generate returns on “invested capital” that look artificially high because the invested capital denominator is near-zero, but the cash flow is real.
I once come across an ex-executive from the industry who mentioned that the key to all aluminium company is the ability for them to acquire energy cheaply. She identified a company which pivoted to using wind turbines for aluminium production, and that company went to the moon. She is now a low-key bio-pharma startup executive, your typical “next-door millionaire”.
💡Pure-play companies we can look at:
Century Aluminum Company (NASDAQ: CENX)
Kaiser Aluminum Corporation (NASDAQ: KALU)
Constellium SE (NYSE: CSTM)
United Company RUSAL (HKEX: 0486)
Metro Mining Limited (ASX: MMI)
Capral Limited (ASX: CAA)
7. Nickel — Laterite vs. Sulphide Reserve Quality Premium
The Key Asset
Nickel ore bodies split into two fundamentally different types: sulphide deposits (high-grade, found in geologically stable shield rocks) and laterite deposits (lower-grade, found in tropical weathered soils near the surface). Sulphide nickel produces battery-grade Class I nickel at much lower processing cost. Laterite nickel requires expensive High Pressure Acid Leaching (HPAL) and typically produces lower-purity nickel.
What a Business Owner Would Pay
An owner paying for a nickel sulphide deposit (like Norilsk Nickel’s Talnakh ore in Russia, or Vale’s Sudbury Basin assets in Canada) values it by: nickel recovered (tonnes) × (current LME nickel price minus cash C1 cost). With nickel prices historically ranging from $8,000–$20,000 per tonne and sulphide cash costs of $4,000–$8,000 per tonne, the net margin per tonne is $4,000–$12,000. For a deposit with 500,000 tonnes of nickel in reserve (a medium-sized sulphide operation), the embedded operating income ranges from $2 billion to $6 billion.
The Accounting Gap
Exactly as with copper and uranium: mineral reserves sit off the balance sheet. Net book value reflects historical development cost, not the current value of metal in the ground. Norilsk Nickel (MMC Norilsk Nickel), the world’s largest palladium and high-grade nickel producer, consistently trades at enterprise values that represent a fraction of the sum of metals in its reserves, because the market applies earnings multiples rather than resource multiples. When nickel prices spike — as they did dramatically in 2022 — reserve value jumps by billions but is never recognized on the balance sheet.
💡Pure-play companies we can look at:
IGO Limited (ASX: IGO)
Xinjiang Xinxin Mining Industry Co., Ltd. (HKEX: 3833)
Lifezone Metals Limited (NYSE: LZM)
Chalice Mining Limited (ASX: CHN)
8. Specialty Industrial Metals: Antimony, Bismuth, Beryllium, and Zirconium
These four metals represent the sharpest version of the resource value arbitrage because their markets are small, illiquid, and dominated by very few producers. The gap between in-ground value and market pricing is often extreme because the companies involved are either private, sub-scale, or not primarily valued as pure-play producers of these metals.
Antimony: Global production is approximately 80,000–100,000 tonnes per year, with China historically producing 75–80% of the world’s supply. Antimony trioxide is essential for flame retardants in plastics and textiles; antimony is also critical for lead-acid batteries and increasingly for sodium-antimony grid storage batteries. The US has one significant domestic antimony operation: Perpetua Resources’ Stibnite project in Idaho. Antimony prices approximately doubled to $25,000–$30,000+ per metric tonne in 2024 following Chinese export restrictions. The reserve value embedded in any Western antimony deposit is calculated at these prices less processing costs of roughly $5,000–$8,000/tonne — yet because no Western producer has a functioning mine at scale, the reserve assets of development companies are almost entirely unrecognized in their market capitalizations.
💡Pure-play companies we can look at:
United States Antimony Corporation (NYSE: UAMY)
Perpetua Resources Corp (NASDAQ: PPTA)
Beryllium: Materex (Materion Corporation) is essentially the monopoly producer of beryllium metal and alloys in the Western world. Beryllium ore (beryl and bertrandite) is mined in Utah at the Spor Mountain deposit. The accounting: mineral resources at historical mining cost, nearly fully depleted and sitting at very low net book value. The economic reality: beryllium metal sells for $857–$1,000+ per kilogram, with defense and semiconductor applications creating nearly perfectly inelastic demand. Materion’s beryllium operations generate operating margins that reflect the pricing power of a functional monopoly on an irreplaceable strategic material. The ore body value at current pricing bears no relationship to its book value.
💡Pure-play companies we can look at:
Materion Corporation (NYSE: MTRN)
Zirconium: Primary production comes from mineral sands (zircon, ZrSiO₄) in Australia (Iluka Resources), South Africa, and China. Iluka Resources carries its mineral sands reserves at historical mining cost under AASB 116 (Australian equivalent of IAS 16). Zircon prices exceeded $2,000 per tonne in 2022. Iluka’s Eneabba project in Western Australia contains rare earth elements in addition to zircon — assets that are essentially invisible on the balance sheet because rare earth separation capacity was not operational and the rare earth quantities were not previously classified as proven reserves.
💡Pure-play companies we can look at:
Iluka Resources Limited (ASX: ILU)
Base Resources Limited (ASX: BSE)
9. Industrial Minerals: Boron and Fluorite
Boron: Rio Tinto’s borax operations in Boron, California (the world’s largest open-pit borax mine) carry mineral rights at historical acquisition cost — land purchased and mineral rights acquired over a century ago. Boron serves as the only economically significant domestic US source of this critical mineral. With boron’s applications in glass, ceramics, fertilizers, and emerging nuclear and semiconductor applications, the Boron, California deposit has a replacement value that is incalculable — no comparable domestic deposit exists. Rio Tinto’s Borax mineral assets are consolidated into its PP&E and mineral rights at cost, contributing negligibly to book value in proportion to their strategic importance.
Fluorite (Fluorspar): Fluorite is the primary source of fluorine, which is essential for hydrofluoric acid (used in semiconductor etching), fluoropolymers (PTFE/Teflon), and refrigerants. The US has essentially no domestic fluorspar production; it is 100% import-dependent. Global production is dominated by China and Mexico. Any Western fluorite deposit is therefore not merely an ore body — it is a strategic supply security asset. The accounting treatment (historical cost of mineral rights) does not capture this scarcity premium.
💡Pure-play companies we can look at:
China Kings Resources Group Co., Ltd. (SSE: 603505)
PART III: FINANCIALS
10. Banking — The Core Deposit Intangible (CDI)
The Key Asset
A bank’s most valuable asset is not its loan portfolio or its investment securities. Those can be replicated by any competitor with access to capital markets. The genuinely irreplaceable asset in banking is a stable base of low-cost core deposits — particularly non-interest-bearing checking accounts held by businesses and households who have been banking at the same institution for decades.
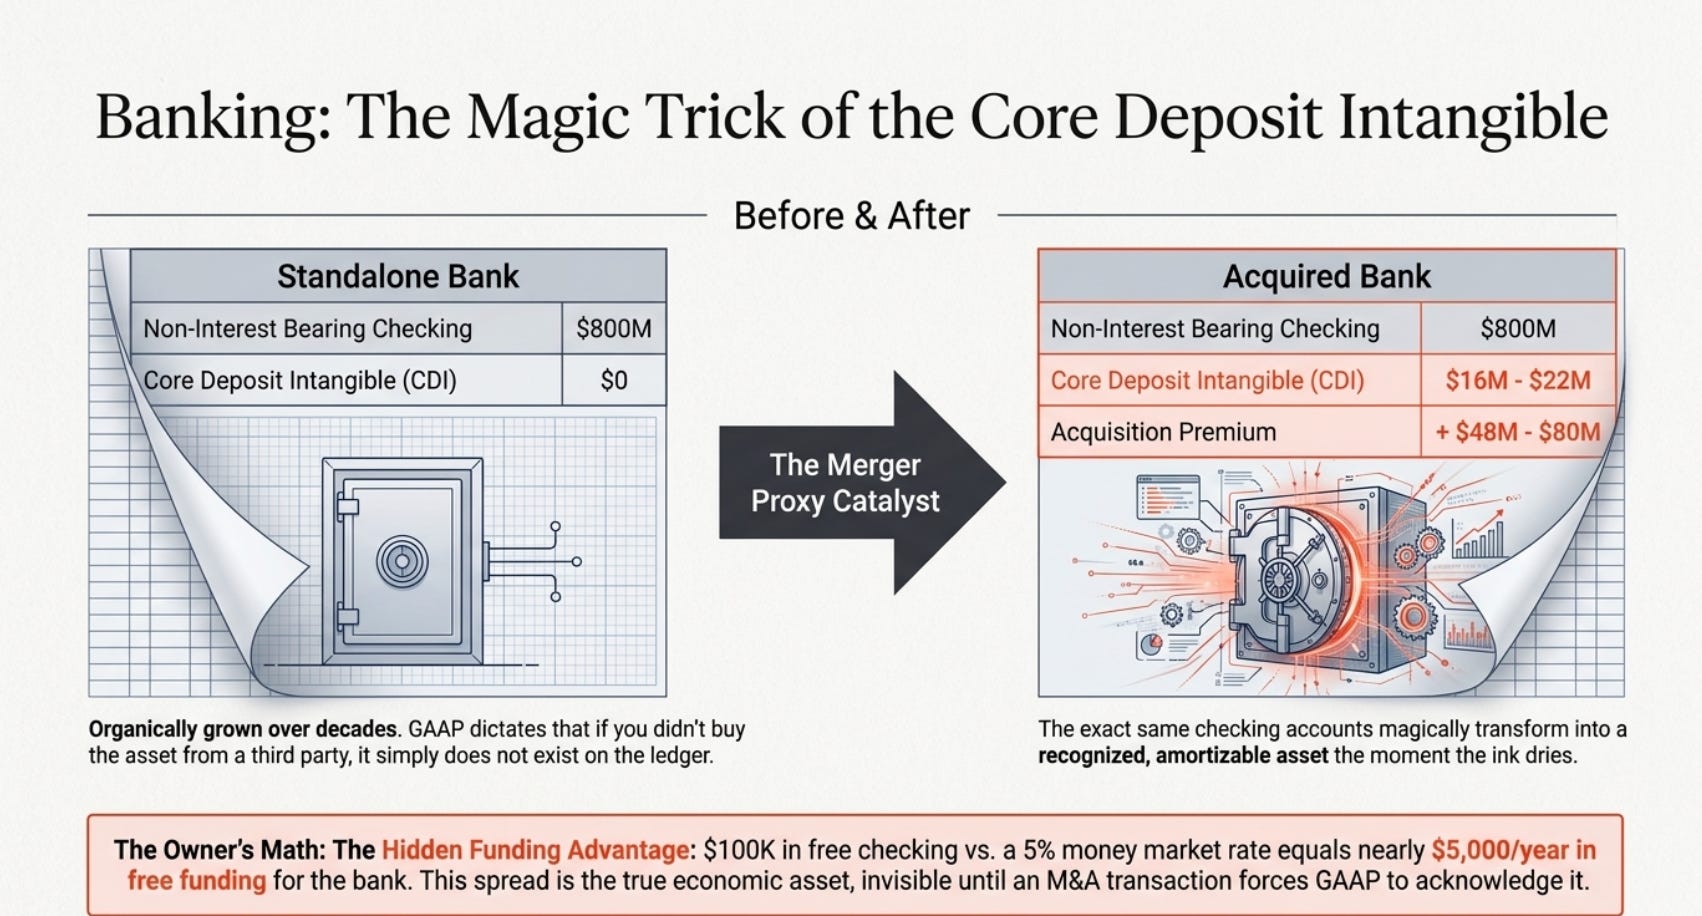
When a business deposits $100,000 in a checking account earning 0.1% interest, and that same business could theoretically earn 5% in a money market fund, the bank is receiving “free” funding worth nearly $5,000 per year per $100,000 of deposits. This differential — the funding cost advantage — is the core deposit intangible. It is real, measurable, and permanent as long as the customers stay.
What a Business Owner Would Pay Right Now
Any acquirer of a bank pays for this explicitly. The acquisition price for bank deposits — the “deposit premium” above the face value of deposits — reflects the core deposit intangible. According to Mercer Capital’s annual bank M&A analysis, deposit premiums for whole bank acquisitions ranged from 6% to 10% of deposits between 2015 and 2023. In the pre-Global Financial Crisis era, premiums reached 15–20%.
The CDI itself — separately amortizable from goodwill in an acquisition — averaged 2.70–2.74% of core deposits in transactions analyzed through mid-2024 (Mercer Capital, 2024 CDI Update), compared to a post-recession average of 1.47% and longer-term historical norms of 2.5–3.0%.
The Accounting Treatment (GAAP)
A standalone bank carries its own deposit franchise at exactly $0.00 in intangible assets. The bank has not paid anyone for these deposits — customers brought them in organically over decades. Under GAAP, you can only recognize an intangible asset when you have purchased it. So Ozarks National Bank of Rural Arkansas, sitting on $2 billion in non-interest-bearing checking accounts built over 60 years, shows $0 in core deposit intangible on its balance sheet. An acquirer buying this bank would immediately recognize a CDI of approximately $40–$54 million (2.0–2.7% × $2B), amortize it over 7–10 years, and the premium would be in addition to that.
The Discrepancy
A community bank with $3 billion in total deposits, of which $800 million are non-interest-bearing demand deposits, might trade at 1.1–1.3x tangible book value. The unadjusted P/TBV looks modest. An acquirer values those $800 million of non-interest-bearing deposits at roughly $16–$22 million in CDI (2.0–2.7% × $800M), plus a deposit premium of $48–$80 million (6–10% × $800M). The total implied value of the deposit franchise — invisible on the balance sheet — is $64–$102 million. Against a typical community bank tangible book value of perhaps $200–$300 million, this is a 25–50% adjustment to the “real” book value. The bank trading at 1.2x tangible book is actually trading at 0.9x adjusted tangible book once you recognize what an acquirer sees.
The precedent is documented in every bank merger proxy statement, where the target’s investment banker walks through exactly this analysis. It is publicly disclosed every time a bank is acquired. Yet the very same analysis is invisible when the bank stands alone.
💡 In shorts, Call Deposit Intangibles = the difference between a bank deposit’s Cost of capital to Average risk free rate
11. Insurance — The Float as Unrecognized Asset
The Key Asset
Insurance companies collect premiums before paying claims. The gap between collecting and paying can extend from months to decades (for long-tail liability insurance). During this period, the insurer holds and invests what Buffett calls “float” — money that belongs economically to policyholders but is available for the insurer to invest. The float is a permanent, revolving pool of investable capital that costs the insurer nothing (or less than nothing, if the underwriting operation runs at a profit).
What a Business Owner Would Pay Right Now
If you are buying an insurance company, you are buying two things: the underwriting operation (ability to write policies profitably) and the float (the investable pool). The float’s value is the present value of the investment income it can generate above the cost of holding it. For an insurer running a combined ratio below 100% (underwriting profit), the cost of float is zero or negative — the policyholders are paying the insurer to hold their money.
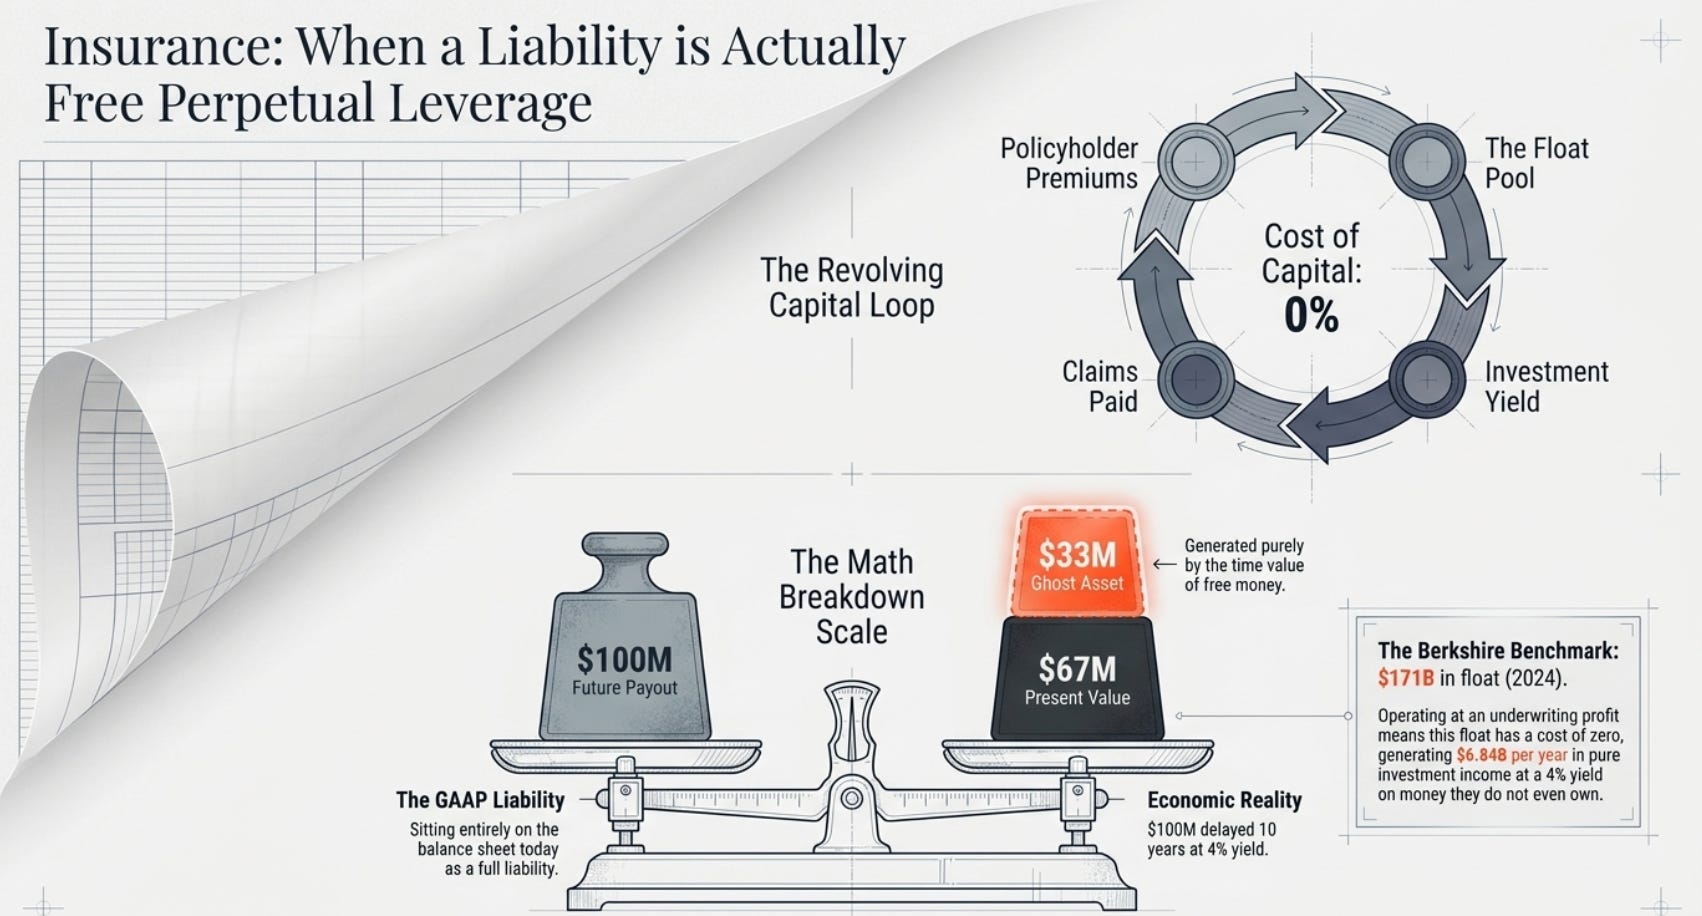
Berkshire Hathaway’s insurance float stood at $168.9 billion in 2023 and $171 billion at the end of 2024, per their annual report disclosures. Berkshire’s insurance operations have run at an underwriting profit for the majority of the past two decades, making this float essentially free leverage. At a conservative 4% return on invested assets (well below Buffett’s actual historical returns), $171 billion of float generates $6.84 billion per year in investment income — on capital that Berkshire does not own and does not pay interest on.
Buffett has written: “Though float shows up on our balance sheet as a liability, it has had a value to Berkshire greater than an equal amount of net worth would have had.” This is a direct acknowledgment that the standard balance sheet treatment fundamentally misrepresents the economic reality.
The Accounting Treatment (GAAP)
Float appears on the insurance company’s balance sheet as a liability — specifically as “unpaid losses and loss adjustment expenses” and “unearned premiums.” These are genuine liabilities — the insurer will eventually pay claims. But the balance sheet shows the liability at its projected settlement value without netting the investment income the company will earn between now and settlement. A $100 million unpaid loss reserve that will be paid in 10 years has a present value of approximately $67 million at 4% discount. The balance sheet shows it at $100 million. The difference — $33 million — is effectively an off-balance-sheet asset.
For clarity: we will be able to achieve $100 million when we take $67 million and compounded it at 4% per annum. Therefore, at 4% of risk-free rate of return, and 0% cost of float, the company will effectively be getting $33 million for free at the end of the period
The Discrepancy
For most insurance companies, the market partially recognizes this through Price-to-Book premiums. But the hidden asset becomes visible when comparing insurance companies on a float-adjusted basis. An insurer with $10 billion in float running at a 0% cost of float (breaking even on underwriting) and earning 4.5% on invested assets is generating $450 million per year in pure investment income on money it doesn’t own. A naive analysis looking at the balance sheet sees $10 billion in liabilities. An owner’s analysis sees $10 billion in permanent, revolving, essentially interest-free investment capital.
The practical metric: calculate the “cost of float” (underwriting loss/gain ÷ average float) and compare it to the current risk-free rate. Any insurer with a cost of float below the 10-year Treasury yield is operating an implicit financing advantage that does not appear as an asset anywhere on the balance sheet.
PART IV: INFRASTRUCTURE AND UTILITIES
12. Regulated Electric Utilities — Replacement Cost vs. Rate Base
The Key Asset
A regulated electric utility’s income-generating asset is its rate base — the regulatory value of invested assets on which it earns an allowed return (typically 9–11% on equity in the US regulatory framework). But the rate base is not the same as either book value or replacement cost.
What a Business Owner Would Pay Right Now
A business owner acquiring a utility’s transmission grid or generation assets would pay replacement cost — what it would cost to build the same infrastructure new today. An electric transmission line built in the 1975 for $50 million, depreciated to $15 million of net book value, might cost $250 million to replace in 2026 (labor, steel, permitting, right-of-way acquisition costs). The utility earns a regulated return on its $15 million rate base, not on $250 million of replacement value. But the stranded cost protection it receives from regulators, and the impossibility of a competitor replicating the asset, makes the $250 million replacement cost the relevant economic floor.
Brookfield Renewable Partners provides the canonical example: its hydroelectric generating stations, many built in the 1920s–1950s, sit at near-zero book value after 60–70 years of depreciation. Yet they generate long-duration, essentially free fuel (water), with licensed water rights that are perpetual. The replacement cost of the same generation capacity using new pumped hydro or conventional hydro would be 3–5x the current book value. Brookfield has explicitly disclosed that its hydroelectric assets are worth substantially more than their depreciated book value, which is one reason the company trades at a significant premium to stated book.
The Accounting Treatment
US GAAP (ASC 980) and IFRS both require regulated utilities to record assets at historical cost minus accumulated depreciation. A $5 billion transmission grid built in the 1970s might have a net book value of $1 billion after 50 years of depreciation. The rate base may be slightly higher (regulators allow deferred recovery of certain costs), but it is still a fraction of replacement cost. The $4 billion gap is invisible unless you build a replacement cost model.
The Discrepancy and Metric
EV/Rate Base is the standard metric for utility M&A. Recent utility acquisitions in the US have transacted at 1.3–1.7x rate base, reflecting a premium to regulatory asset value. But when you compare rate base to actual replacement cost — particularly for transmission and distribution infrastructure in dense urban markets — the replacement cost premium can be 3–5x book. The utility trading at 1.5x book might actually be at 0.4x replacement cost.
💡Rate base = Asset - Depreciation + Working capital
However, Rate base is not equivalent to replacement cost — especially when the assets are utilized for perpetual licensed water rights, which can only be replaced by a higher cost due to e.g. inflation, or higher barriers to entry
13. Wireless Towers — Incremental Tenant Economics
The Key Asset
A wireless tower is not a depreciating asset in any economically meaningful sense. It is a toll booth. A tower built in 2000 for $200,000 was depreciated on a 20-year straight-line basis; by 2020, it sat at near-zero book value. Yet the same tower in 2026 is generating $150,000–$250,000 per year in annual revenue (often under 20–25 year leases with automatic 3% escalators), serving 2–3 tenants.
The Business Owner’s Math
The critical metric is incremental tenant economics. The first tenant on a tower pays tower rent that roughly covers the tower company’s ground lease cost, maintenance, and financing. The second tenant on the same tower pays nearly 100% incremental margin — there is essentially zero additional cost to add a second carrier. The third tenant is also near-100% margin.
American Tower Corporation’s disclosure shows that when a second tenant is added to a US tower, the incremental EBITDA margin on that incremental revenue exceeds 95%. A tower generating $100,000 from one tenant that adds a second at $80,000 generates $76,000 of incremental EBITDA. A tower with three tenants at $90,000 each ($270,000 total) might have EBITDA of $235,000 — an 87% margin on a “depreciating” asset that is nearly fully amortized on the balance sheet.
The Accounting Distortion
Tower companies carry their towers at historical cost (construction and acquisition cost) minus accumulated depreciation. Under ASC 350, the intangible value of the tenant relationships and the exclusive site rights (which cannot be replicated by a competitor building a new tower in the same location) are not separately recognized unless acquired in a business combination.
Crown Castle International, for instance, has towers sitting at book values of $100,000–$300,000 that are generating $200,000–$350,000 per year in cash revenue with 90%+ EBITDA margins. The “replacement cost” analysis understates the true economic asset, because the replacement cost of a greenfield tower on the same site includes not just steel but the ground lease, the permitting, the zoning variances, the FAA clearances, and often 18–36 months of regulatory process — a process that is essentially impossible in dense urban markets where zoning restrictions prevent new towers.
The Discrepancy
Tower companies trade at extremely high EBITDA multiples (25–35x EBITDA) precisely because the market partially understands this dynamic. But the balance sheet understates the asset base so severely that Price-to-Book is meaningless — Crown Castle and American Tower have P/B ratios of 10–20x because the towers themselves are near-zero on the books but generate $100 billion+ in enterprise value. The anomaly for investors is most acute when tower companies trade at distressed levels, as Crown Castle did in 2024 after its strategy misstep in fiber — the underlying tower asset value was never impaired, but the stock fell 40%, creating a window where investors were buying the tower asset at a meaningful discount to its sustained cash flow value.
14. Airlines — Slot-Controlled Airport Gates
The Key Asset
At slot-controlled airports — LaGuardia (LGA), Reagan National (DCA), Heathrow (LHR), Haneda (HND), and a handful of others — the number of take-off and landing slots is permanently capped by government or airport authority regulation. The number of slots that exist today is essentially the number that will exist in 20 years. They cannot be created. They can only be transferred between carriers.
What a Business Owner Would Pay Right Now
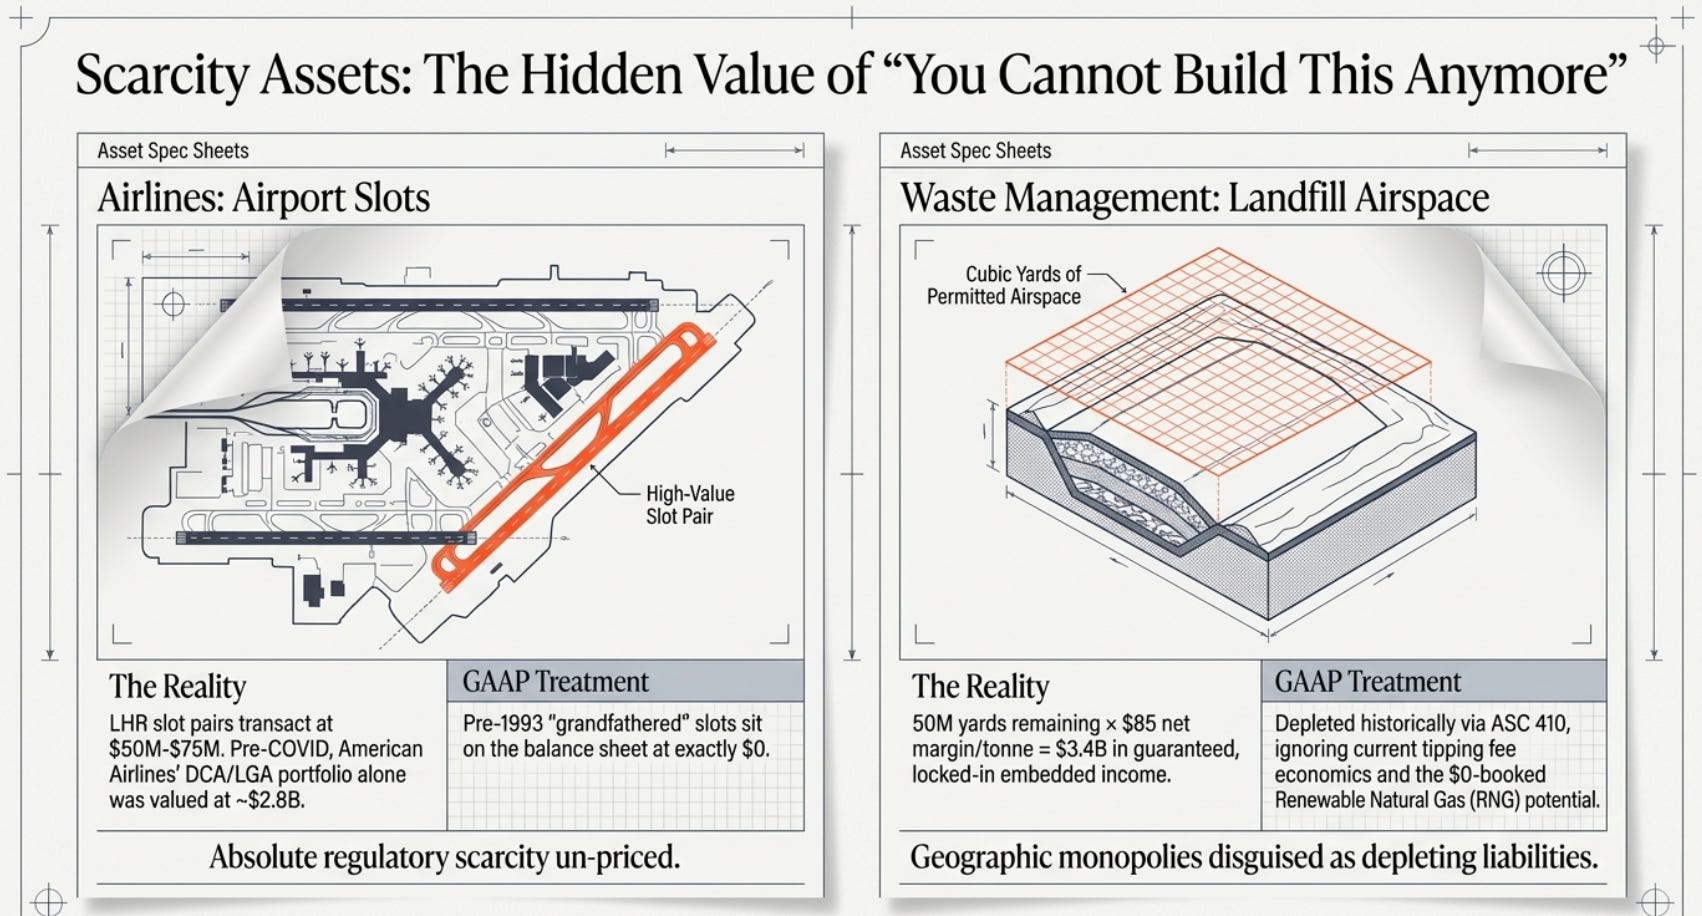
A slot pair (one take-off slot and one landing slot) at London Heathrow has transacted in secondary markets at $50–$75 million in recent years. American Airlines sold a pair of Heathrow slots to American Express Global Business Travel in 2016 for approximately $60 million. At Reagan National, a slot pair has transacted at $20–$40 million. At LaGuardia, slot pairs have been valued at $10–$20 million.
American Airlines, as of its pre-COVID balance sheets, held approximately 103 slot pairs at Reagan National and 75 slot pairs at LaGuardia. At even conservative estimates of $20M and $10M per pair respectively, the portfolio was worth approximately $2.8 billion. Delta Air Lines’ slot portfolio at these airports, combined with JFK international slots, has been valued at $3–$5 billion by aviation consultants.
The Accounting Treatment
Airport slots acquired before 1993 were received from the FAA at essentially zero cost — the government gave them to airlines as part of the transition to high-density rule slot assignments. These “grandfather slots” sit on airline balance sheets at zero or nominal value. Slots acquired through secondary market purchases since 1993 are recorded at acquisition cost and amortized over their useful life (which airlines typically argue is indefinitely useful, amortized over 40 years or not amortized as indefinite-lived intangibles). The majority of major carrier slot portfolios are either at near-zero (historical grandfathered slots) or at acquisition cost from transactions that may be 10–20 years old.
The Discrepancy
In April 2020, when Delta Air Lines’ market capitalization fell to approximately $15 billion, aviation analysts noted that Delta’s slot portfolio at LGA and DCA alone — at pre-COVID transaction prices — was worth an estimated $3–5 billion. Add JFK international slots and the number grows. The market was effectively pricing Delta’s slot portfolio at a steep discount to arms-length transaction prices, while simultaneously pricing in near-certain bankruptcy risk for the airline operations. Investors who understood that the slot portfolio was a standalone, separable, and eminently sellable asset were buying one of the most defensively valuable assets in aviation at 30–50 cents on the dollar.
15. Waste Management — Landfill Airspace as Irreplaceable Infrastructure
The Key Asset
A permitted landfill is not a dump. It is a regulated, engineered, permitted facility that took 7–10 years and $30–$100 million to permit and build, faces functionally zero chance of being replicated by a competitor in the same geography, and sits on a permanent franchise of waste disposal capacity measured in cubic yards of remaining “airspace.”
What a Business Owner Would Pay Right Now
A business owner values a landfill by its remaining permitted airspace multiplied by the current tipping fee per tonne, minus operating costs (which are roughly $10–$20/tonne of direct cost). In the northeastern US, tipping fees for municipal solid waste (MSW) range from $75–$130 per tonne. An active landfill with 50 million cubic yards of remaining airspace (a mid-size regional facility) holds approximately 40 million tonnes of remaining capacity. At $100/tonne tipping fee and $15/tonne operating cost, the gross margin per tonne is $85. Total embedded operating income: approximately $3.4 billion, generated over the remaining life of the facility (typically 10–30 years).
💡The conversion of 1 cubic yard to 1 tonne of waste is a common approximation in waste management, though the actual weight varies significantly based on material density and compaction:
Loose vs Compact: Loose residential waste averages only 225 lbs (102kg) per cubic yard, whereas compacted in a truck, it can reach 500–1,000 lbs (226–453kg) per cubic yard
Heavy Materials: Materials such as concrete, soil, or wet garbage are much denser; 1 cubic yard of solid concrete weighs approximately 2 tons (approx. 1.8 tonnes
The Accounting Treatment (GAAP)
Waste Management and Republic Services carry landfill airspace as a depleting asset under ASC 410 (asset retirement obligations). The cost of developing the landfill is capitalized and depleted as airspace is consumed, similar to the units-of-production method in mining. The landfill asset on the balance sheet reflects the historic cost of permitting, lining, engineering, and building the facility — not the current value of the remaining tipping fee revenue stream.
Waste Management’s 2023 10-K shows net landfill assets of approximately $6.2 billion across their portfolio. The company owns approximately 250 active municipal solid waste landfills. At average remaining capacity and current tipping fee economics, an owner valuation of their landfill portfolio — as the aggregated present value of remaining airspace at current prices — would substantially exceed this figure, particularly in high-fee markets like New England, New York, and California.
The Bonus Asset: Renewable Natural Gas
Old landfills generating methane from decomposing organic waste now qualify as Renewable Natural Gas (RNG) sources. RNG sells at massive premiums to conventional natural gas — in 2022–2023, RNG from landfills was selling at $20–$30/MMBtu equivalent, versus $3–$6/MMBtu for conventional natural gas. These methane rights were essentially worthless on old balance sheets — they were captured only to prevent atmospheric release. The economic transformation of landfill gas into premium RNG has created hundreds of millions of dollars in value for Waste Management and Republic Services from assets that were previously carried at zero.
PART V: CONSUMER AND INDUSTRIAL SERVICES
16. Broadcasting — FCC Spectrum Licenses at Historical Cost
The Key Asset
A television or radio broadcaster’s primary asset is its FCC broadcast license — the legal right to operate a transmitter on a specific frequency in a specific market. These licenses were granted by the FCC at no cost (or nominal auction prices) during the analog broadcasting era. In subsequent spectrum auctions, equivalent frequencies have sold at dramatically higher prices.
What a Business Owner Would Pay Right Now
Spectrum value is measured in $/MHz-POP — dollars per megahertz of bandwidth times the population covered. In the FCC’s 2017 broadcast spectrum incentive auction, television broadcasters sold their spectrum rights back to the government at approximately $0.50–$2.00 per MHz-POP, realizing billions in proceeds from licenses that had been carried on their books at essentially zero.
Nexstar Media Group, the largest US television station group, holds broadcast licenses across 200+ markets. The carrying value of those licenses on its balance sheet (primarily acquired through station purchases at historical M&A prices) is dramatically below the value that comparable spectrum has fetched in arms-length spectrum auctions. Gray Television (before its recent financial difficulties) similarly held a spectrum portfolio that, at auction-comparable pricing, exceeded its entire market capitalization.
The Accounting Treatment (GAAP)
Under ASC 350, FCC licenses are classified as indefinite-lived intangible assets — they are not amortized but are subject to annual impairment testing. The original broadcast licenses received for free are carried at $0. Licenses acquired through station purchases are recorded at the purchase price allocation to licenses in that specific acquisition. The result is a hodgepodge: some licenses at zero, some at 1995 M&A prices, some at 2015 M&A prices — none at 2026 spectrum auction comparables.
The Discrepancy
A television station group’s broadcast licenses are valued at historical cost or zero. The replacement cost — what it would take to acquire equivalent licensed spectrum in those markets today — is vastly higher, based on comparable auction precedents. Gray Television’s market capitalization in 2023 fell to approximately $400–$500 million before its debt difficulties became acute. Its broadcast spectrum portfolio, valued at recent comparable MHz-POP transaction prices, was estimated by some analysts at $2+ billion. The company was trading at a 75–80% discount to its spectrum replacement value, with the operating business essentially being given away for free.
17. Maritime Shipping — The Secondhand Vessel Market vs. GAAP Straight-Line Depreciation
The Key Asset
A dry bulk shipping or crude tanker company earns all of its income from exactly one thing: its fleet of vessels. Every dollar of revenue — whether from a time charter (daily rate, fixed duration) or a spot voyage — flows from the physical ship. The ship is the asset. The charter rate is the income. Strip everything else away.
The question is: what is that ship worth right now?
What a Business Owner Would Pay Right Now
This is the only sector in this entire paper where the primary income-generating asset has a continuously published, live, arms-length spot price — updated weekly by third-party brokers — entirely independent of any earnings multiple, discounted cash flow, P/E, or P/S ratio.
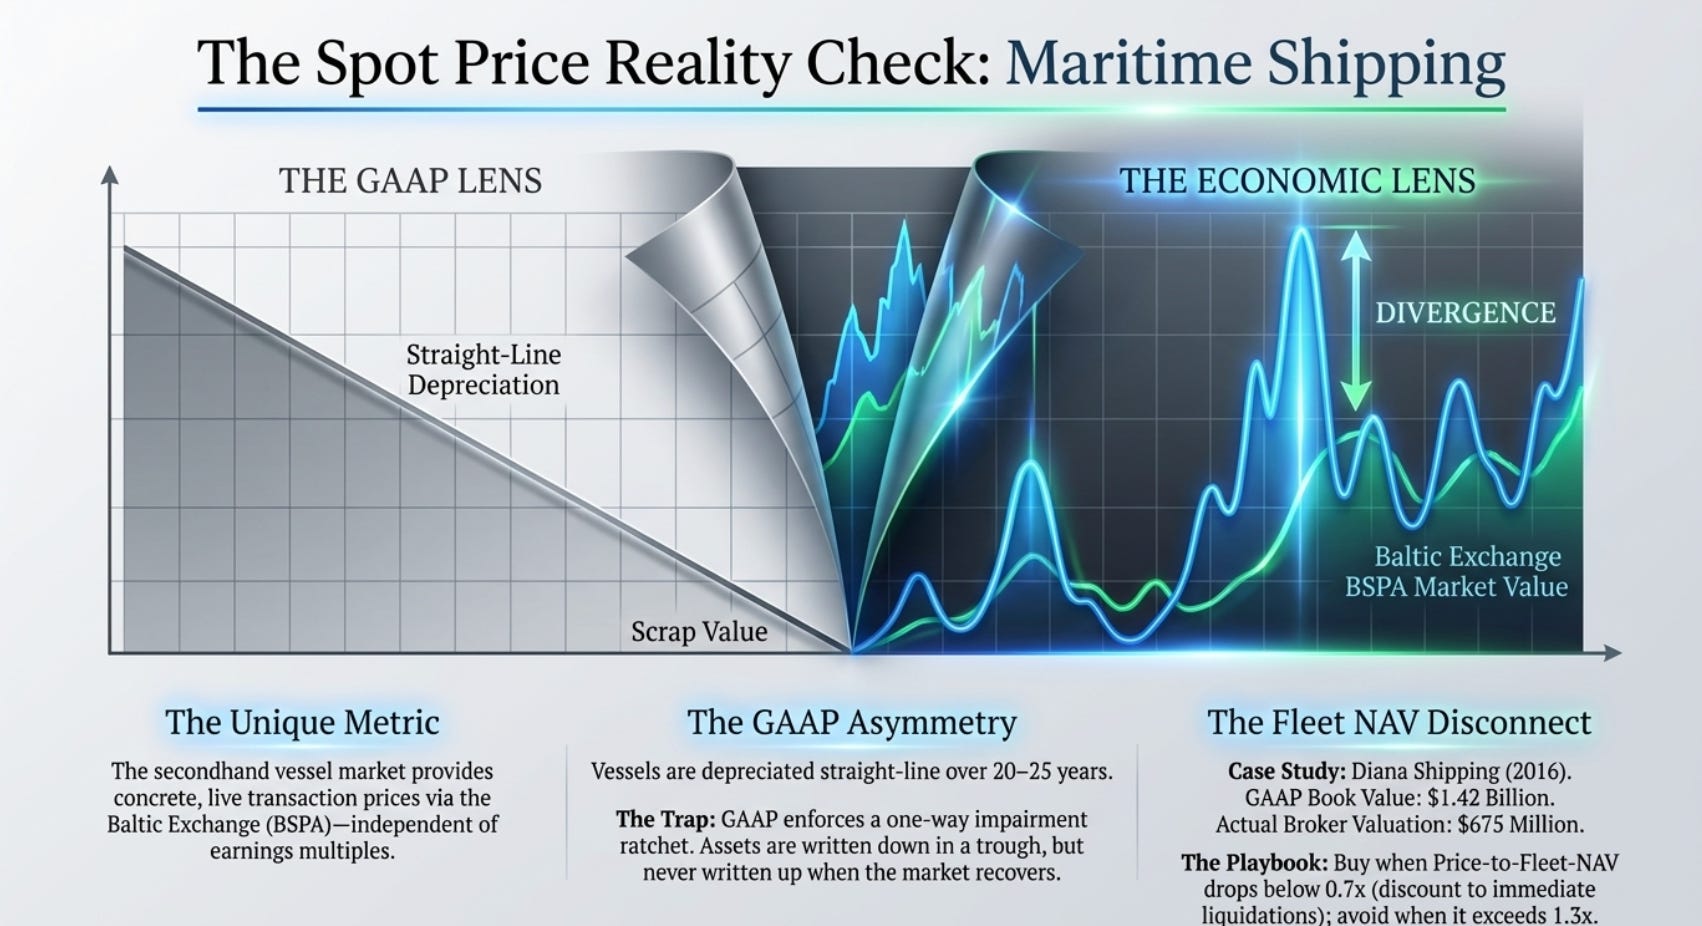
The Baltic Exchange Sale and Purchase Assessments (BSPA) publish every Monday the market value of reference vessels for each major ship class: a 5-year-old Capesize bulk carrier (172,000 DWT), a 5-year-old VLCC crude tanker (305,000 DWT), a 5-year-old MR product tanker (45,000 DWT), a 5-year-old Panamax dry bulk carrier (74,000 DWT), and others. These are not estimates. They are derived directly from recent, documented sales transactions between buyers and sellers in the global secondhand ship market.
VesselsValue.com, Clarkson Research Services, and Xclusiv Shipbrokers independently provide market valuations for individual named vessels based on comparable recent sales, adjusted for age, build quality, fuel efficiency, survey status, and installed equipment (scrubbers, eco-engines). Each sale is recorded with the IMO vessel number, seller, buyer, vessel age, and transaction price. The market is liquid — in the first nine months of 2024 alone, approximately 594 bulk carriers changed hands, averaging 66 sales per month, per Lloyd’s List data citing Xclusiv Shipbrokers.
The methodology for a business owner is therefore precise and immediate:
Step 1: Identify each vessel in the fleet by IMO number, type, age, and DWT. Step 2: Look up its current secondhand market value from the Baltic Exchange BSPA for the reference class, adjusted for actual age (Baltic publishes 5-year-old benchmarks; interpolate for other ages using broker age-adjustment curves). Step 3: Sum all vessel values to get Fleet Market Value — what the fleet would fetch in an orderly sale today. Step 4: Subtract net debt. Step 5: Fleet NAV = Fleet Market Value minus Net Debt.
This is not a multiple. It is not a projection. It is: “If we sold every ship tomorrow, at this week’s documented broker prices, and paid off all the debt, what is left?” A business owner buying the entire company pays no more than Fleet NAV — and often significantly less in distressed conditions.
Documented Specific Transaction Prices
The secondhand market produces concrete, named transaction prices. A 2019-built Newcastlemax bulk carrier (206,400 DWT, scrubber-fitted) — the Mineral Shougang International — was reported sold in late 2025 for $63.5 million, per Lloyd’s List citing shipbroker reports. Clarkson Research, per Seatrade Maritime, assessed a 5-year-old Capesize in 2023 at approximately $54.5 million — close to 90% of the then-prevailing newbuild price of $65 million, reflecting tight supply of available tonnage. A 10-year-old Capesize (same vessel type, ten years older) was worth approximately $19 million at the trough of the post-COVID recovery in early 2020, then surged to $33 million by 2022 as demand recovered — the same physical vessel, the same iron and steel, now worth 74% more because supply-demand dynamics in the freight market had shifted.
These prices are as observable and immediate as the oil spot price. There is no modeling. There is no assumption about future rates. You are simply looking at what a comparable ship sold for last week.
The Accounting Treatment (GAAP/IFRS)
Under GAAP (ASC 360), vessels are capitalized at historical acquisition cost and depreciated straight-line over a 20–25 year useful life to an estimated residual (scrap) value. A Capesize acquired in 2010 for $50 million, depreciated over 25 years to a $5 million scrap residual, carries annual depreciation of $1.8 million. By 2022 (12 years in), its net book value is $28.4 million — completely independent of the fact that a comparable 12-year-old Capesize sold in the secondhand market in 2022 for $28–$35 million, and in 2016 for $8–$10 million. The accounting answer never moves; the market answer moves constantly.
The critical GAAP asymmetry is the one-way impairment ratchet. Under ASC 360, vessels are tested for impairment only when circumstances indicate potential impairment. If the undiscounted future cash flows of a vessel exceed its book value — even modestly — no impairment is required, regardless of how far the market price has fallen below book. During the 2016 dry bulk trough, many companies with vessels purchased at 2007–2008 peak prices carried book values far above what the secondhand market would pay — yet no impairment was triggered because cash flows, even at depressed rates, technically covered the book values on an undiscounted basis.
Conversely — and this is the core discrepancy — there is no mechanism under GAAP to write up vessel values when the market recovers. After the 2016 trough, when the same ships that had been “impaired to trough value” recovered 40–80% in secondhand market prices during 2021–2022, the balance sheet showed nothing. The recovery was invisible. Fleet NAV had recovered dramatically; GAAP book value had not.
Under IFRS, IAS 16 technically permits a revaluation model for PP&E where vessels can be carried at fair value. In practice, almost no publicly listed shipping company elects the IAS 16 revaluation model for vessels, because the earnings volatility from marking the fleet to market every quarter would make reported income incomprehensible. Most IFRS shipping companies elect the cost model and take the same discrepancy as GAAP users.
The Discrepancy — Documented Cases
Value Investor’s Edge (J. Mintzmyer), using VesselsValue.com data, documented the following about Diana Shipping (NYSE: DSX) in Q3 2016: Diana’s 10-K stated a fleet book value of approximately $1.42 billion including newbuild advances. Independent broker valuation of the same fleet using actual comparable sales data from VesselsValue: approximately $675 million — a 54% overstatement of fleet value on the balance sheet relative to actual market clearing prices.
This is the opposite situation from most sectors in this paper: here, in a down market, GAAP overstated the asset because vessels had been bought at cycle-peak prices and straight-line depreciation had not fallen fast enough to match the collapsed market. Investors who used P/B to screen for “cheap” shipping stocks in 2016 were walking into a trap — book value was not the floor, it was the ceiling.
Then the cycle turned. By 2020–2022, those same vessel classes recovered to secondhand prices above their GAAP book values. Companies that had survived the 2016 trough, taken impairments, and operated through lean years, now held fleets whose secondhand market value significantly exceeded their depreciated book value. The Scorpio Bulkers (now Scorpio Holdings, SALT) purchase at $2.98 per share in 2016 — identified by Value Investor’s Edge specifically on a Fleet NAV vs. price basis — returned over 150% within a year as rates and vessel values recovered. The investment thesis had nothing to do with earnings multiples. It was: the ships are worth more, on a broker-assessed secondhand basis, than the price you are paying for the entire company.
The Practical Metric: Price-to-Fleet-NAV
Divide the market capitalization by Fleet NAV (sum of individual vessel secondhand market values from current broker assessments, minus net debt). When a shipping company trades at Price-to-Fleet-NAV below 0.7x, the market is pricing the equity at a discount to the immediate liquidation value of the fleet — a condition that has historically been temporary and followed by significant recoveries. When Price-to-Fleet-NAV exceeds 1.3–1.5x, the stock embeds significant optimism about future charter rates not yet reflected in asset values, which historically has been followed by corrections.
This is the most direct, non-earnings-based, non-multiple-based valuation framework available for any sector covered in this paper. The asset has a spot price. Look it up. Compare it to what you are paying.
18. Retail and Restaurants — The Below-Market Lease and Historical Cost Land
The Key Asset
Legacy retailers and restaurant chains that own their store sites and land carry real estate purchased decades ago at historical cost. The land beneath prime commercial locations does not depreciate — but under GAAP, it is carried at 1960s or 1970s acquisition prices indefinitely.
What a Business Owner Would Pay Right Now
A McDonald’s-owned parcel in a suburban US market, purchased for $40,000 in 1972, might be worth $2–$5 million today. McDonald’s has disclosed that it views itself primarily as a real estate company that happens to sell hamburgers — the land bank is the structural moat. Across approximately 14,000+ company-owned or ground-leased properties globally, the gap between 1960s–1980s historical land costs and 2026 market values represents billions of dollars in unrecognized value.
The same applies to hospitality: hotel chains that own land and buildings in prime urban locations — Marriott, Hilton, and their predecessors who accumulated real estate before franchising became dominant — carried that land at acquisition cost.
The Accounting Treatment
Under GAAP, land is carried at historical acquisition cost and is never depreciated (GAAP correctly recognizes that land does not wear out). However, it is also never revalued to market. Land purchased in 1965 for $50,000 in a location now worth $3 million sits on the balance sheet at $50,000. The $2.95 million appreciation is off-balance-sheet. Under IFRS, companies have the option to revalue PP&E including land to fair value (IAS 16 revaluation model), but most elect not to use it because of the earnings volatility it introduces.
The Discrepancy
Net-net style value investors have consistently found companies where the current market value of owned real estate — when independently appraised — exceeds the company’s entire market capitalization, even before counting the operating business. The classic example is Sears Holdings in its final years: the Sears Real Estate Investment Trust (Seritage Growth Properties, spun out in 2015) held properties in its portfolio with appraised values that had been invisible on the Sears balance sheet for decades.
19. Pharmaceuticals and Biotech — The Off-Balance Sheet Drug Portfolio
The Key Asset
A pharmaceutical company’s income-generating asset is a portfolio of drug products — both those already approved and generating revenue, and those in clinical development. Under GAAP, neither category is well represented on the balance sheet.
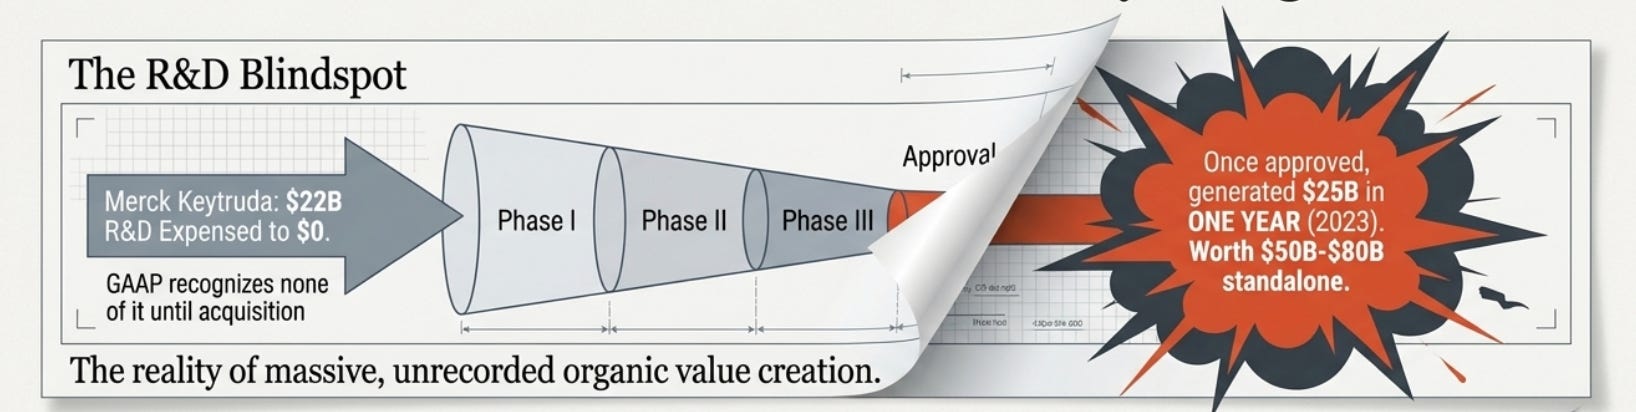
For already-approved drugs discovered internally: the entire development cost was expensed year-by-year as R&D. An approved drug that cost $800 million to develop has a balance sheet value of $0 — or the minor capitalized value of manufacturing licensing. A drug acquired from another company carries the acquisition price allocation to the drug intangible, amortized over its useful patent life.
For pipeline drugs in clinical trials: zero carrying value, zero balance sheet recognition, regardless of stage.
What a Business Owner Would Pay Right Now
For an approved, commercially marketed drug: (current annual revenue × net margin) capitalized at an appropriate multiple given remaining patent life and competition risk. This is computable with precision from disclosed financials (unless there is a blackswan event).
For Merck’s Keytruda (pembrolizumab), which generated $25 billion in revenue in 2023 — the world’s highest-revenue drug — Merck spent approximately $22 billion on its total R&D and acquisition costs related to this compound (primarily through its acquisition of Schering-Plough in 2009 and subsequent development). Every dollar was expensed. The drug’s balance sheet value today is essentially the amortized intangible from the Schering-Plough acquisition — a small fraction of its economic value. A business owner buying Keytruda’s revenue stream at 12x EBITDA contribution would pay approximately $50–$80 billion for that single asset. The approved drug asset is invisible on Merck’s balance sheet.
The Trial Probability Problem — The Most Important Variable, and the One You Cannot Price
For pipeline drugs, the fundamental challenge — and the key thing an investor must understand — is that there is no market price for a drug in clinical trial. You cannot sell it immediately. You cannot collateralize it. The asset’s value is entirely contingent on outcomes that are statistically probable but individually uncertain.
The base rate data, drawn from the largest publicly available studies of clinical trial outcomes, is sobering:
Overall Phase I to approval: Per the Citeline dataset analyzed for the 2014–2023 period by Norstella, the average likelihood of approval (LOA) for a new Phase I drug is 6.7% — an all-time low, having fallen from over 75% Phase I success rates during 2006–2008. The main bottleneck is Phase II, where only 28% of programs successfully advance to Phase III.
Phase III to approval: Approximately 55% of Phase III programs advance to NDA filing, and approximately 92% of NDA filings eventually receive approval.
By indication (per the MIT/Biostatistics study, from 406,038 clinical trial entries for 21,143 compounds): oncology historically had a 3.4% overall success rate (though this has improved in recent years to 8%+ with biomarker-selected trials); infectious disease vaccines have the highest overall rate at 33.4%; cardiovascular has historically been among the lowest at 6.6%.
The practical implication: a drug in Phase II has roughly a 15–20% implied probability of eventual approval (28% Phase II-to-Phase III transition × 55% Phase III-to-filing × 92% filing-to-approval). A drug with a clear mechanism of action, biomarker-selected patient population (which the MIT study confirmed significantly increases success rates), strong Phase 2 endpoint data, and a clean safety profile warrants substantially higher implied probability — in the range of 40–60% for best-in-class programs.
You Cannot Put a Market Value on Trial Probability Directly — But You Can Do This
The honest acknowledgment is that there is no “immediate sellable value” for a pipeline drug the way there is for a barrel of oil or a pound of uranium. You cannot liquidate a Phase III trial today for its expected NPV. The asset is illiquid, the outcome is binary, and the valuation is necessarily probabilistic.
What you can do is look for situations where:
The company’s P/S ratio is below 2.0 — meaning the market is paying less than two times current revenue for the entire enterprise, and implicitly assigning near-zero value to the pipeline.
The pipeline contains multiple Phase II and Phase III programs with statistically high probability of approval — not speculative early-stage assets, but late-stage programs with public clinical data available on ClinicalTrials.gov and published in peer-reviewed literature.
The mechanism of action is validated by prior approvals in the same target class (reducing the “first-in-class” risk that drives most Phase III failures).
FDA Fast Track, Breakthrough Therapy, or Priority Review designations are in place — these are not guarantees, but they are the FDA’s formal acknowledgment of preliminary clinical evidence.
The Merck/Keytruda situation from 2012–2016 is the canonical example: Merck traded at 12–16x trailing earnings reflecting only its existing drug portfolio. Keytruda was entering Phase II in melanoma. Investors who used published Phase I data from the Journal of Clinical Oncology, combined with prior anti-PD-1 mechanism validation from Bristol-Myers Squibb’s nivolumab program, could construct a high-probability case for approval. The market gave Keytruda essentially no credit until Phase III results were published. The “invisible” pipeline asset was worth more than the entire company’s existing revenue base.
The Accounting Treatment (GAAP)
Under ASC 730, all R&D costs are expensed as incurred. Phase I, II, and III trials, regulatory filing costs, and post-approval monitoring studies all flow through the income statement in the year they are incurred. A drug costing $800 million over 10 years to develop has exactly $0 in recognized assets on the balance sheet upon approval. This creates the fundamental paradox: the more a pharma company invests in building its future, the worse its current GAAP earnings look and the lower its book value — exactly the opposite of economic reality.
20. US Government-Sponsored Healthcare Insurers — The Medicaid & Medicare Advantage Membership Franchise
Note: This sector is structurally distinct from standard commercial insurance. The economics of US government-sponsored managed care deserve separate treatment because the membership base generates income through an entirely different mechanism — one that GAAP systematically under-recognizes.
The Key Asset
A Medicaid or Medicare Advantage managed care organization (MCO) earns its income from exactly one source: enrolled members under government contracts. The Centers for Medicare & Medicaid Services (CMS) or a state Medicaid agency pays the insurer a fixed per-member-per-month (PMPM) capitation rate for each enrolled life, regardless of how much or how little that member uses healthcare services. The insurer’s job is to manage care at a medical loss ratio (MLR) below the capitation rate and keep the spread.
The income-generating asset is the enrolled membership base under active government contracts — and the contracts that produce it. Not the buildings. Not the software. Not the medical providers. The enrolled lives, period.
What a Business Owner Would Pay Right Now
This is the rare sector where the business owner’s valuation methodology is handed to you directly by M&A precedent, with documented per-unit pricing.
When Centene Corporation acquired WellCare Health Plans in 2019 for $17.3 billion (total enterprise value), WellCare had approximately 5.5 million members, the vast majority in Medicaid and Medicare Advantage programs. The implied transaction price: approximately $3,145 per enrolled member. This is the market-clearing price for a government-sponsored managed care membership base — an arms-length transaction, unanimously approved by both boards, at a 32% premium to the then-current market price.
For Molina Healthcare, which serves approximately 4.75 million Medicaid members and 156,000 Medicare members as of 2022: the company’s market capitalization in normal trading conditions was approximately $16–18 billion — roughly $3,000–$3,500 per member. Yet on Molina’s balance sheet as of December 31, 2022, the total goodwill and intangible assets from all prior acquisitions was only $1.39 billion across 5.26 million total members — approximately $264 per member in recognized balance sheet intangibles.
💡This was where i made the mistake when writing the opportunity with Centene. Althought Centene was attractive, Molina Healthcare was next level attractive. This was a mistake that i made. The difference between a novice investor like me, and a legend like Michael Burry.
The delta is the critical number: $3,000–$3,500 per member in market price, versus $264 per member in recognized balance sheet value. The gap is approximately $14–$17 billion — the economic value of the government contract relationships, the state Medicaid contract rights, and the enrolled membership franchise that Molina organically built through winning state contracts over decades.
The Accounting Treatment (GAAP)
Here is the precise mechanism of the gap. Under GAAP, a company can only recognize an intangible asset when it was purchased from a third party in a business combination. If Molina wins a new state Medicaid contract organically — say, entering a new state and winning the RFP for 400,000 Medicaid lives — the value of that contract (400,000 × $3,145/member = $1.26 billion in comparable M&A terms) is recognized at exactly $0 on the balance sheet. Zilch. Because Molina did not purchase it from anyone.
If Molina had instead acquired a small MCO serving those same 400,000 lives for $1.26 billion, the same economic asset would be recognized as $1.26 billion in purchase price allocated to “member relationships” and “government contract intangibles” — amortizable intangible assets, sitting on the balance sheet.
The economic asset is identical in both cases. The accounting treatment is completely different based solely on how the membership was obtained.
The Bonus Asset: Medicare Advantage Star Ratings
CMS pays Medicare Advantage plans a quality bonus of approximately 5% on their base capitation rate for plans achieving 4+ Stars on the CMS Star Rating system. For a plan with 500,000 Medicare Advantage members receiving, say, $1,200/month in PMPM capitation, a 5% quality bonus is $60/month per member — $720 per year per member — or $360 million per year in additional revenue just from the Star Rating.
A 4-Star or 5-Star rating is itself an asset. It was earned through years of care management investment, member satisfaction programs, and clinical protocol investments. It sits at $0 on the balance sheet. It generates hundreds of millions of dollars in annual premium bonuses and is capitalized nowhere in financial statements.
The Discrepancy
The market trades Medicaid/Medicare Advantage MCOs at approximately $3,000–$3,500 per member. The balance sheet, when memberships were built organically, recognizes approximately $0–$264 per member in intangibles. The gap is not a rounding error — it is the entire economic value of the franchise. For Molina alone, the gap between M&A-comparable membership value and balance sheet intangibles represents $14–$17 billion in unrecognized asset value.
The practical metric: EV per enrolled member. Divide the enterprise value by total enrolled members. Compare to the WellCare/Centene transaction price of ~$3,145/member and the current trading prices of comparable MCOs. Any company trading below $1,500/member in government-sponsored managed care with a clean balance sheet and improving Star ratings deserves serious scrutiny.

PART VI: BONUS — TECHNOLOGY AS A CATALYST FOR UNLOCKING HIDDEN ASSET VALUE
This section identifies sectors where an emerging technology acts as a catalyst to reveal or realize asset value that already exists but has not been accessible. We focus only on cases with high probability of technology acting as catalyst — not aspirational futures.
A. Uranium + Small Modular Reactors (SMRs): From Stranded Asset to Tier-One Critical Resource
The Technology Catalyst
Small Modular Reactors (SMRs) are factory-built nuclear reactors with capacity under 300 MW (versus 1,000–1,600 MW for conventional large reactors). NuScale Power, Rolls-Royce SMR, and X-energy have advanced designs through regulatory review. The US NRC issued its first SMR design certification to NuScale in 2023. TerraPower is constructing its Natrium reactor in Wyoming with a 2030 target.
The Asset Being Unlocked
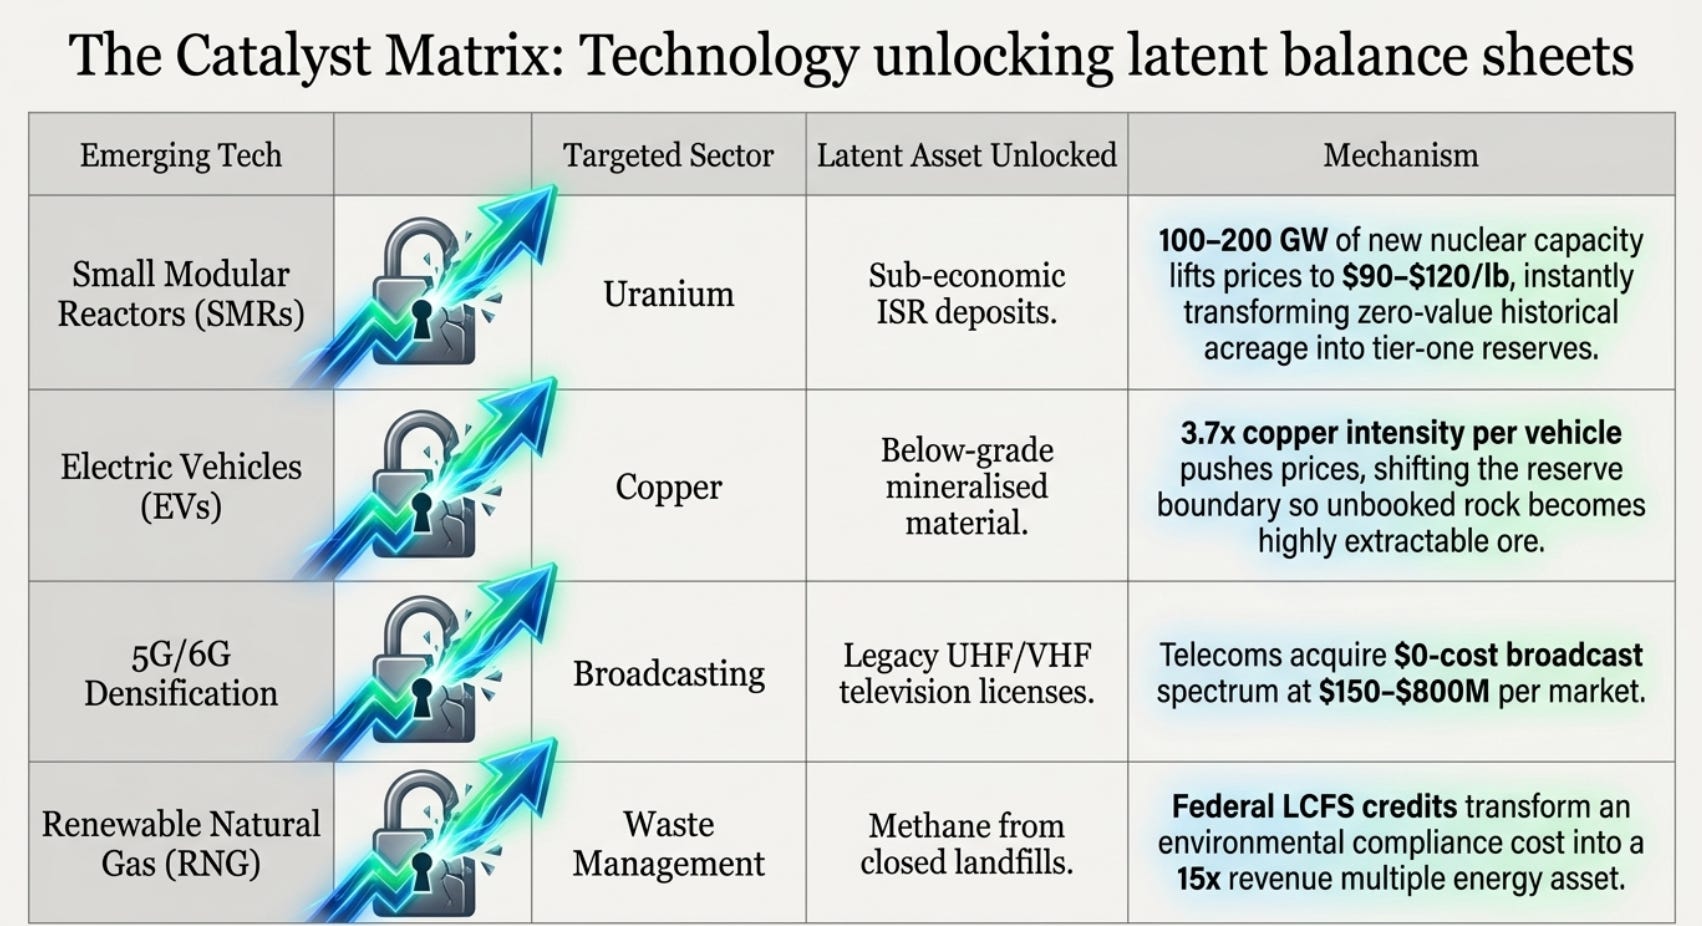
Uranium mines in geopolitically stable Western jurisdictions (Canada, Australia, the US) currently carry a scarcity premium. But their full value is constrained by current global reactor fleet demand of approximately 180 million pounds per year. If SMRs deploy at the scale anticipated by the IEA (100–200 GW of new nuclear capacity by 2040), uranium demand could increase by 30–50 million pounds per year above current levels — a 17–28% demand increase on a market already running at a supply deficit of 20%+.
The hidden asset being unlocked: uranium reserves in ISR-amenable deposits in the US (Wyoming, South Dakota) that are currently sub-economic at sub-$70/lb prices become highly economic in a $90–$120/lb world. Companies like Uranium Energy Corp (UEC) have “ready-to-produce” ISR operations that can restart within 6–12 months of a sustained price signal. Their asset bases — licensed ISR well fields, processing facilities — are carried at historical development cost on the balance sheet. In a $100+/lb uranium world catalyzed by SMR demand, these assets double or triple in economic value without any incremental capital investment. The technology (SMR) makes the latent asset (ISR uranium reserves) economically relevant.
Historical Analog
Shale technology in oil. Prior to the commercial application of horizontal drilling and multi-stage hydraulic fracturing (circa 2008–2012), the Permian Basin, Bakken, and Eagle Ford shale plays contained billions of barrels of known but economically inaccessible hydrocarbons. Companies sitting on this acreage carried it at low-cost historical acquisition values. As shale technology reduced breakeven costs from $80+/bbl to $35–$45/bbl, the hidden value of the acreage was unlocked without changing what was in the ground. Pioneer Natural Resources’ acreage in the Midland Basin, acquired at $2,000–$5,000 per acre in the 2010–2015 period, was subsequently valued at $30,000–$50,000 per acre. The acreage existed the whole time. The technology made it worth 10–25x more.
B. Copper + Electric Vehicle and Grid Infrastructure: Demand Shock to an Irreplaceable Metal
The Technology Catalyst
An electric vehicle contains approximately 85 kg of copper versus 23 kg in a conventional ICE vehicle — a 3.7x increase. A DC fast-charging station requires an additional 8–10 kg. Grid infrastructure upgrades needed to deliver power to EVs and integrate renewable generation require substantial copper investment: busbars, transformers, cables, and switchgear are all copper-intensive.
The Asset Being Unlocked
Copper reserves in existing, permitted, producing mines are fixed in quantity. Permitting a new copper mine in the US or Western Europe typically requires 15–20 years from discovery to production, based on historical timelines. The copper already in the ground at existing mines becomes structurally more valuable as EV penetration drives demand higher without an ability to rapidly increase supply.
The specific asset being unlocked: “below-grade” or “marginal” ore that is currently uneconomic at $4.25/lb copper becomes economic at $6–$8/lb. Freeport-McMoRan has disclosed that its portfolio includes substantial “mineralized material” below its current reserve cutoff grade. This material sits off-balance-sheet entirely (mineral resources below reserve grade are not booked under either GAAP or IFRS). As copper prices rise due to EV-driven demand, the reserve boundary shifts, and previously unbooked material becomes bookable, extractable, and valuable — without any exploration spending.
Probability Assessment: High. The IEA’s 2023 Critical Minerals Report documented a projected copper supply deficit of 20+ million tonnes by 2040 under a 2°C scenario. BloombergNEF and Wood Mackenzie have independently corroborated this conclusion. The demand growth is not speculative — it follows directly from announced EV production targets by every major automaker.
C. Landfill Airspace + Renewable Natural Gas and Carbon Credits
The Technology Catalyst
Landfill gas capture technology has existed for decades, but the economics were marginal. The commercialization of Renewable Natural Gas (RNG) as a fuel for heavy trucks (qualifying for LCFS credits in California and Federal Renewable Fuel Standard credits), combined with rising natural gas prices and the emergence of voluntary carbon markets, has fundamentally transformed the economics of landfill methane.
The Asset Being Unlocked
Waste Management’s 2023 annual report discloses that its renewable energy operations — primarily landfill gas — generated approximately $475 million in revenue. But this was built from assets that had zero value on the balance sheet a decade ago: old, “closed” landfills that had stopped accepting waste but continued generating methane from decomposing organic material. The methane capture rights on these closed landfills were valued at cost (essentially zero, since the wells were installed for environmental compliance, not for revenue generation).
The transformation: a closed landfill in California generating 5 million cubic feet of methane per day, converted to RNG and sold with Low Carbon Fuel Standard (LCFS) credits at $0.25–$0.50/gallon equivalent premium, generates $3–$7 million per year in revenue from an asset that one decade ago generated zero revenue and was a pure compliance cost. At a 15x revenue multiple, this single closed landfill is worth $45–$105 million — from an asset carried at approximately zero on the balance sheet.
Waste Management has 26 active landfill gas-to-energy projects and is developing additional RNG projects. The portfolio of renewable energy assets embedded in “closed” landfills is materially underrepresented in any balance sheet analysis.
Probability Assessment: High. LCFS markets in California are functioning, RNG prices are established, and federal RFS credits are well-established policy. The technology risk is minimal. The only risk is regulatory, and the policy direction — incentivizing renewable natural gas from waste — has bipartisan support given its domestic energy security angle.
D. Broadcasting Spectrum + 5G/6G Network Densification
The Technology Catalyst
5G and the emerging 6G network architectures require dramatically more spectrum diversity than previous generations. The FCC’s spectrum reallocation policy — systematically repurposing lower-frequency broadcast spectrum for wireless broadband — has already yielded the 2017 broadcast incentive auction. The same dynamic will recur: as 6G standardization advances (anticipated 2030+), demand for mid-band and lower-band spectrum will increase.
💡Think SiriusXM opportunity — It is what Munger deems as “cheap current cash flows plus Massive Optionality”.
The Asset Being Unlocked
Broadcast television stations operating in markets where VHF and UHF spectrum is valued by wireless carriers will face acquisition offers from spectrum-hungry telecom companies. The existing broadcast infrastructure — the tower, the transmitter, the affiliate agreement — has declining intrinsic value as linear TV viewership continues its structural decline. But the spectrum license becomes more valuable with each passing year.
Gray Television, Nexstar, and Tegna hold broadcast licenses that were received for free or purchased decades ago. The specific asset being unlocked by 5G/6G: a UHF TV license covering a major metropolitan market (covering millions of POPs) at 10–30 MHz of bandwidth has a spectrum value of $150–$800 million at current MHz-POP auction prices — versus a carrying value of perhaps $20–$50 million for legacy-acquired licenses. If a broadcaster operating in a DMA with declining ratings eventually monetizes the license through a spectrum auction or direct sale to a wireless carrier, the embedded value far exceeds the carrying value and the current market capitalization.
Probability Assessment: Medium-High. Spectrum reallocation auctions are certain; the timing and prices are uncertain. But the structural dynamic — wireless carriers needing more low- and mid-band spectrum while linear TV audience collapses — creates an inevitable convergence that will eventually surface the latent spectrum value.
E. Agricultural Minerals (Potash/Phosphate) + Precision Agriculture Technology
The Technology Catalyst
Precision agriculture — GPS-guided variable rate application, drone imaging, soil sensor networks, and AI-driven crop optimization — is increasing the demonstrated link between fertilizer input quality and crop yield. This is increasing demand for premium, high-purity potassium chloride (MOP) and specialty fertilizers at exactly the time that lower-quality Chinese and Eastern European supply faces geopolitical constraints.
The Asset Being Unlocked
Nutrien’s Saskatchewan potash reserves are already the lowest-cost, highest-quality source of MOP in the world. But a significant portion of these reserves sits in “below-solution-mine cutoff” ore bodies that require conventional underground mining — currently marginal at $300–$350/tonne MOP prices. If precision agriculture lifts MOP price to $400–$500/tonne sustainably (consistent with 2021–2022 pricing), these below-cutoff ore bodies become economic reserves. The reserve base effectively doubles without a drill bit being turned.
More specifically: the adoption of enhanced efficiency fertilizers (EEFs) — potassium varieties that are slow-release or coated to reduce volatility loss — is creating a premium product segment where North American producers (Nutrien, Mosaic) have technological advantages over commodity Chinese producers. The existing ore bodies that produce standard MOP would, with processing technology investment, produce premium EEF products at $50–$100/tonne higher realized prices — transforming the reserve economics without changing the geology.
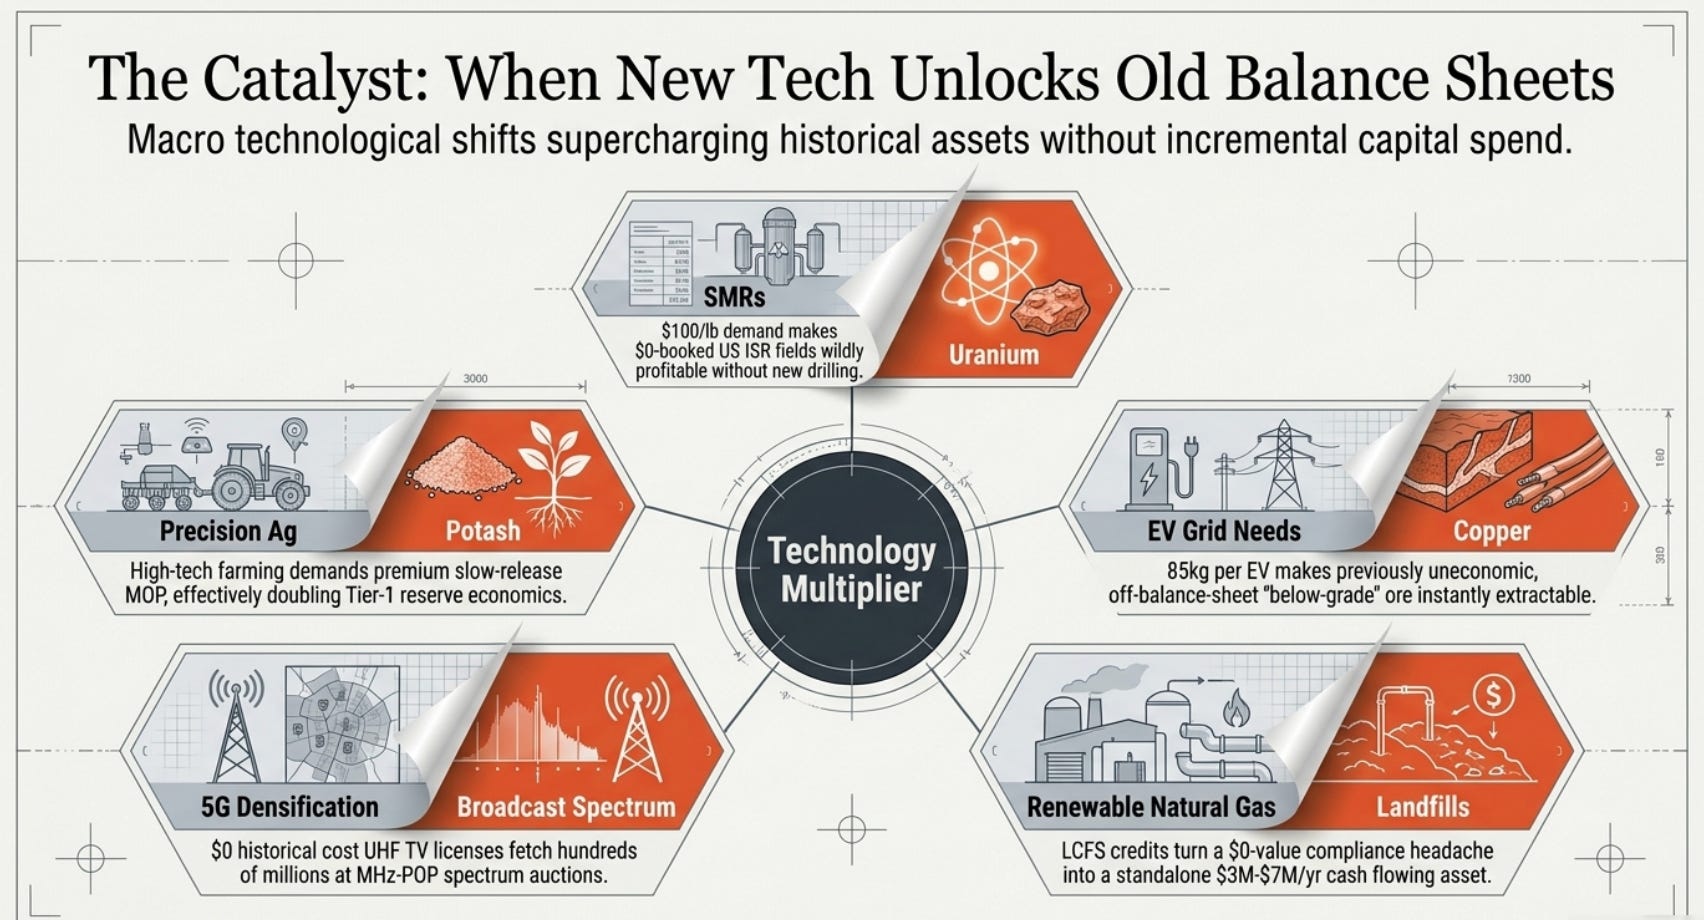
CONCLUSION: THE FRAMEWORK RESTATED
The pattern across every sector in this analysis is the same, and it is worth stating clearly.
Accounting standards — GAAP and IFRS alike — are designed for one primary purpose: to tell you what a company spent on its assets, adjusted for wear and depletion. They were never designed to tell you what those assets are worth today.
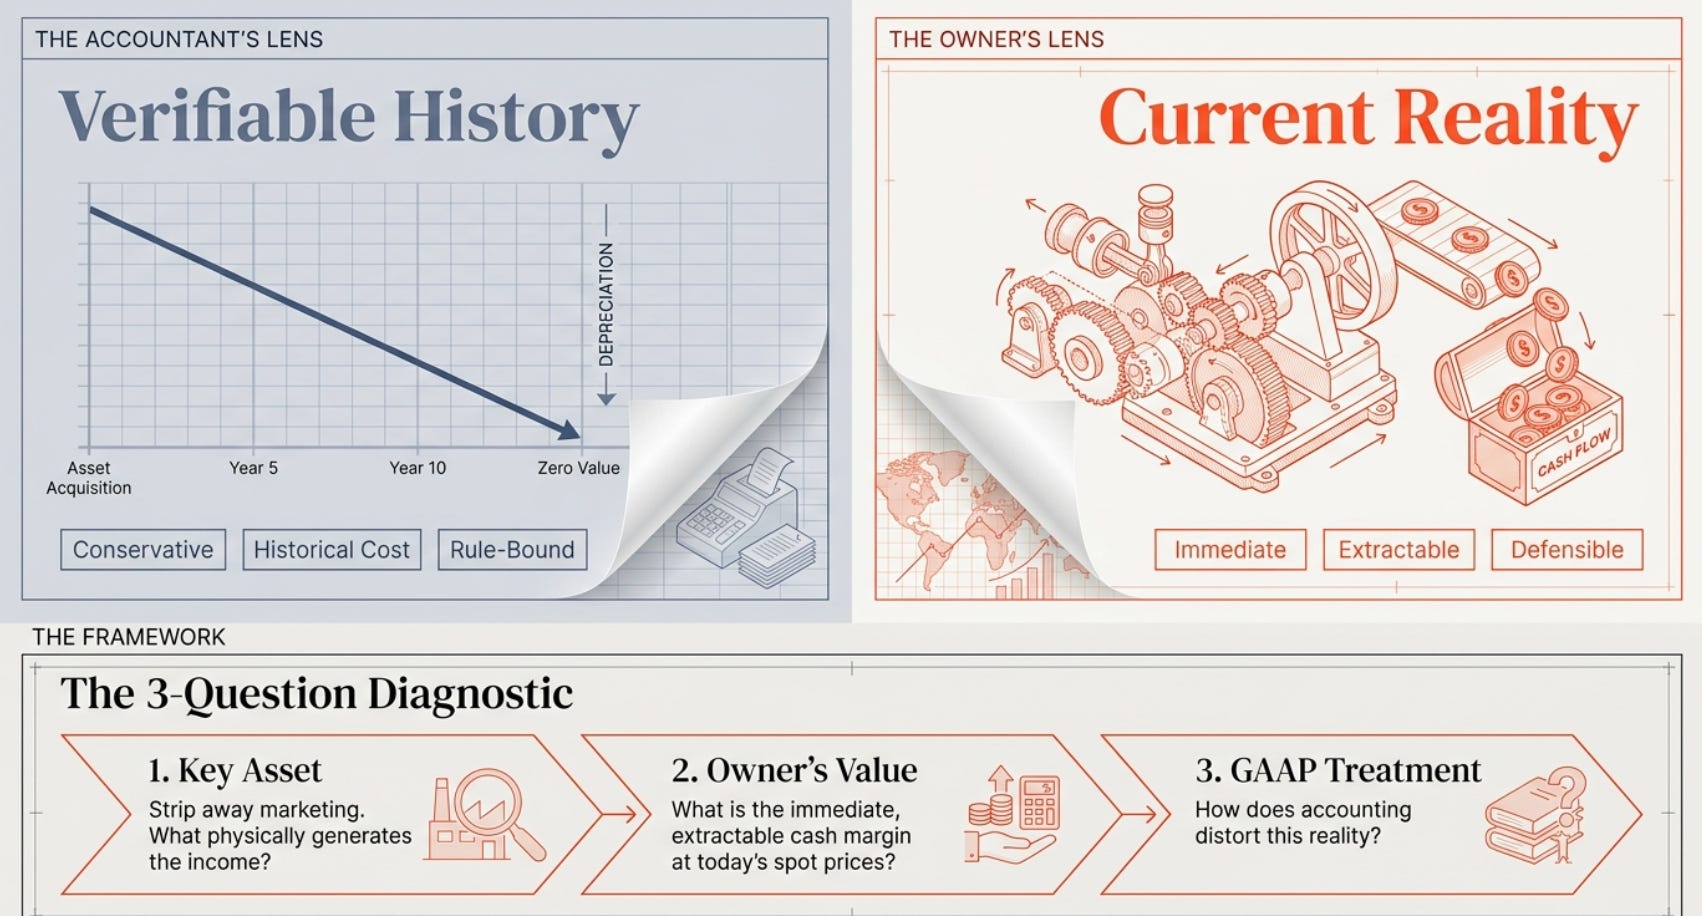
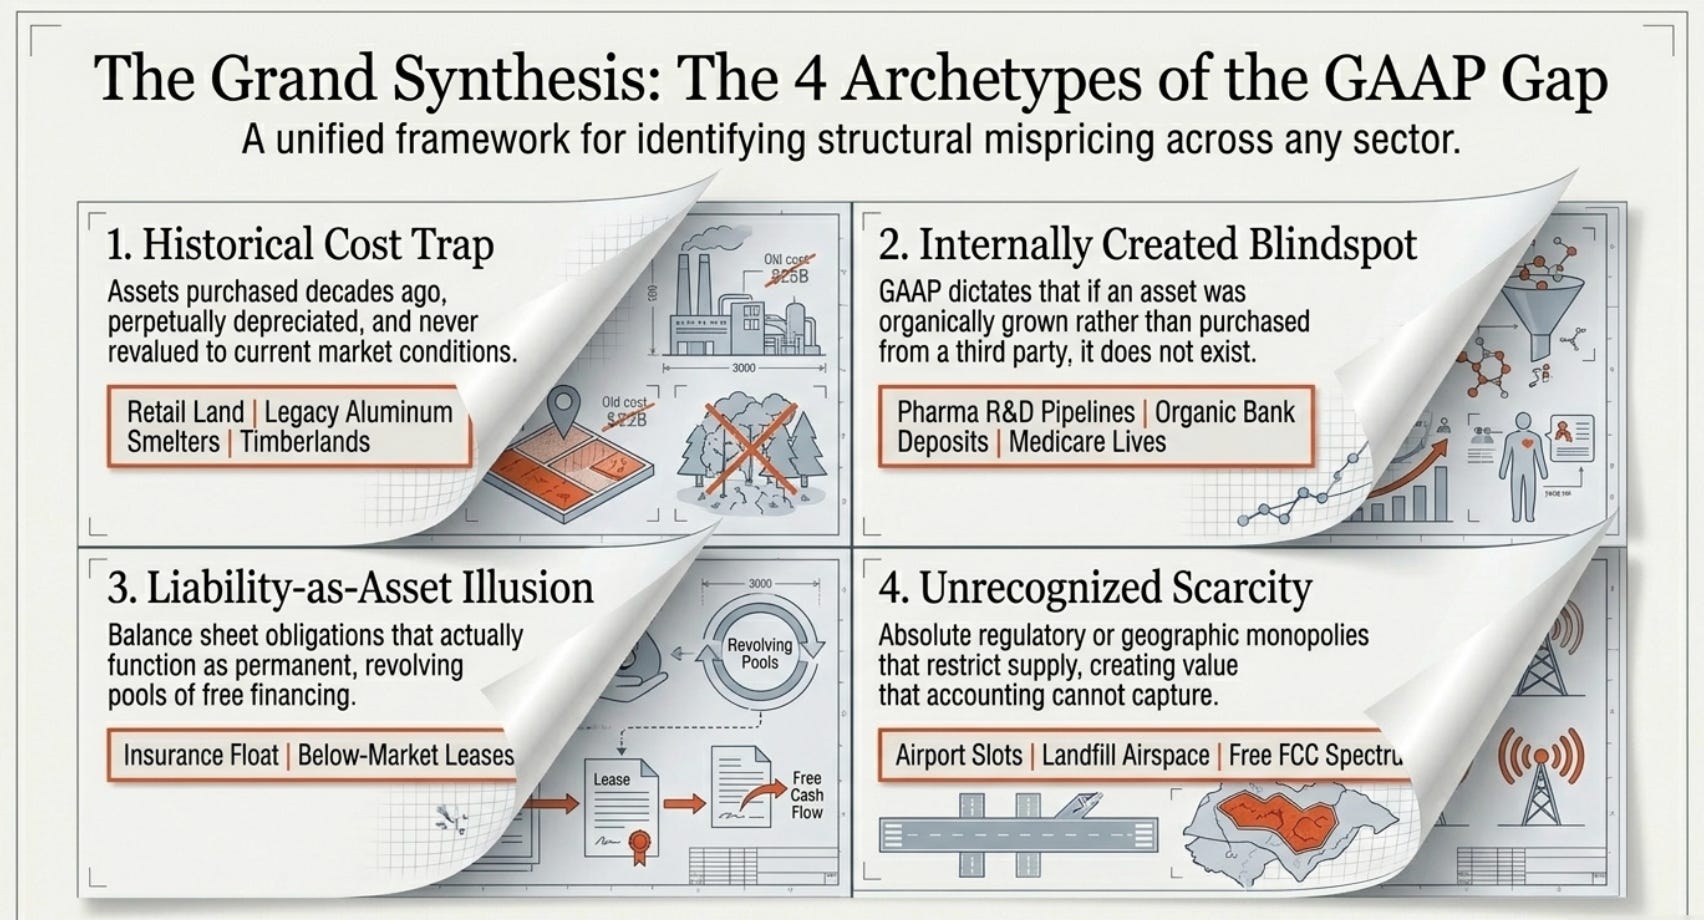
The gap between “what was spent” and “what it is worth” is always widest in four situations:
1. When the asset was acquired long ago at historical prices. Land purchased in 1970. Smelters built in 1985. Timber planted in 1990. Spectrum licenses issued free in 1985. All of these sit at cost while the world has changed around them.
2. When the asset is internally created and therefore has no purchase price to capitalize. Drug pipelines. Core deposits. Ore bodies discovered (not purchased) through exploration. Internal R&D programs. You cannot capitalize what you did not buy from a third party.
3. When the asset generates recurring cash flows but is carried as a liability/ can be acquired at a higher price in the market now relative to what it was booked for. Insurance float. Below-market leases. Non-interest-bearing deposits. The accounting system sees the obligation; the business owner sees the funding advantage. Ships that could be sold for way higher than it is accounted for in the company’s balance sheets.
A business owner does not look at a balance sheet to value an asset. A business owner asks: “What does this asset produce right now, at today’s prices, minus today’s costs? And what would it cost to replace it if it disappeared tomorrow?” The answers to those two questions define the owner’s value.
Throughout this paper, the methodology has been consistent: identify the key asset, price it at what a business owner would pay today based on actual current output and current market comparables, and compare that to what GAAP shows. The gap is the opportunity.
But there is one additional layer that synthesizes everything above — the framework that converts insight into action, and that explains when these mispricings are most extreme and most exploitable.
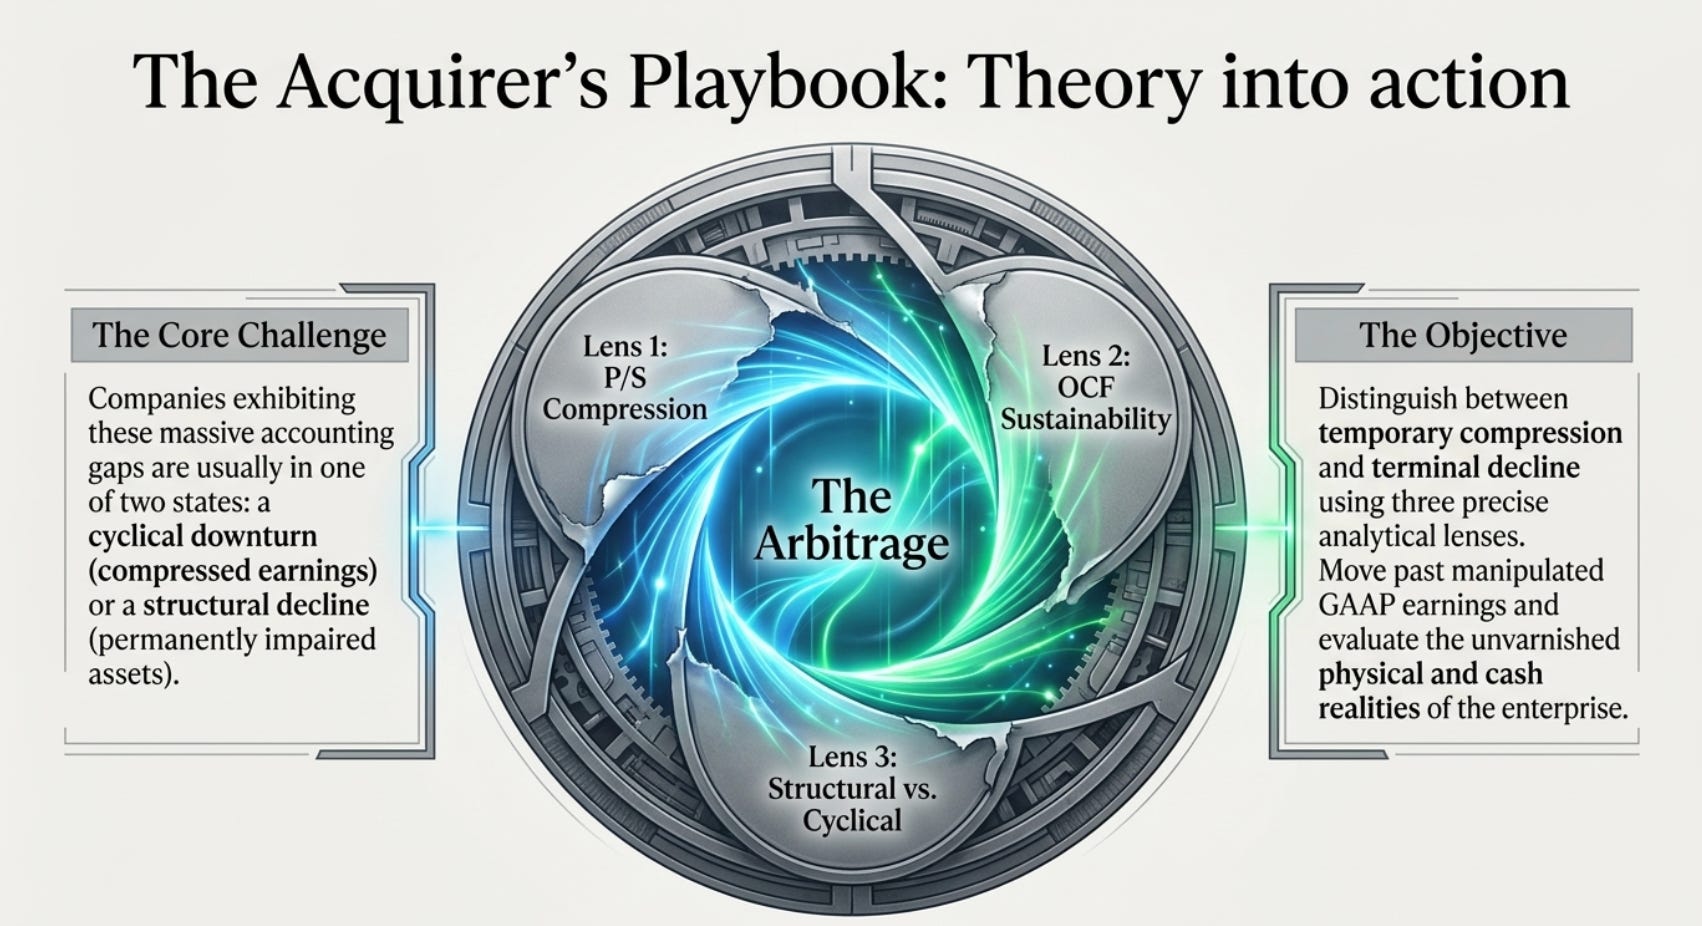
The Acquirer’s Multiple, P/S, OCF Sustainability, and Historical Average Reversion
The companies most affected by accounting-versus-reality gaps are almost universally in one of two states: (1) a cyclical downturn where earnings are temporarily depressed, making P/E multiples look high even as asset values remain intact, or (2) a structural misperception where the market is pricing a business as if its core assets are permanently impaired.
Distinguishing between these two is the critical judgment. The framework uses three lenses:
Lens 1: Price-to-Sales (P/S) Against Historical Averages
Revenue is the most stable financial metric — it moves with commodity price cycles and demand, but it does not collapse the way earnings do in downturns. A copper miner whose earnings have gone negative because copper fell from $4.50 to $3.00/lb still has the same ore body, the same equipment, and the same workforce. The business has not been destroyed; the margin has been temporarily compressed.
The P/S ratio, compared to the sector’s historical average P/S, is the first screen. The sectors in this paper have the following historical average P/S ranges (based on long-run data across cycles):
Oil & Gas E&P: 0.7–2.5x (average approximately 1.5x)
Steel distribution: 0.1–0.4x (average approximately 0.25x)
Copper mining: 1.0–3.5x (average approximately 2.0x)
Broadcasting: 0.5–1.5x (average approximately 0.9x)
Community banking: 2.0–5.0x (average approximately 3.5x)
Waste management: 1.5–3.5x (average approximately 2.5x)
Airlines: 0.2–0.8x (average approximately 0.4x)
A company trading at P/S of 0.3x in a sector with a historical average of 1.5x is not automatically cheap — it may be cheap for a reason. But it is a signal to examine the quality of the underlying asset. If the primary income-generating asset is intact (the ore body still exists, the landfill still has airspace, the deposit franchise is still sticky), then the P/S compression is almost certainly cyclical, not structural.
Lens 2: Operating Cash Flow Sustainability
The question is not whether the company is earning profits today — in a cyclical downturn, it may not be. The question is whether the company can sustain operations and service its obligations through the trough without permanently impairing the asset.
Operating Cash Flow (OCF) — not net income, which is distorted by the very accounting gaps this paper describes — is the correct metric. Specifically:
OCF / Total Debt: Can the company service its debt from operating cash flow at trough prices? A ratio above 0.15x (OCF covers 15% of debt per year at trough) typically suggests the company can survive a 3–5 year downturn without asset-destroying dilution or forced sales.
Maintenance CAPEX vs. Depreciation: If maintenance CAPEX is materially below the depreciation charge, the company is “harvesting” an asset — it is generating cash that the income statement does not fully credit. This is most visible in Semiconductor fabs (depreciated to near-zero but still producing), aluminum smelters (fully amortized but still running), and oil wells (carrying value near depletion but still producing). A company where OCF consistently exceeds net income by 50% or more is usually one where depreciation charges dramatically overstate actual asset consumption.
OCF / Revenue (Operating Cash Flow Margin): For distressed situations, an OCF margin above 10% even at trough prices suggests the business model is fundamentally intact. The accounting losses may be driven by non-cash charges (depreciation, depletion, amortization, write-offs) that are themselves artifacts of the accounting gaps this paper describes.
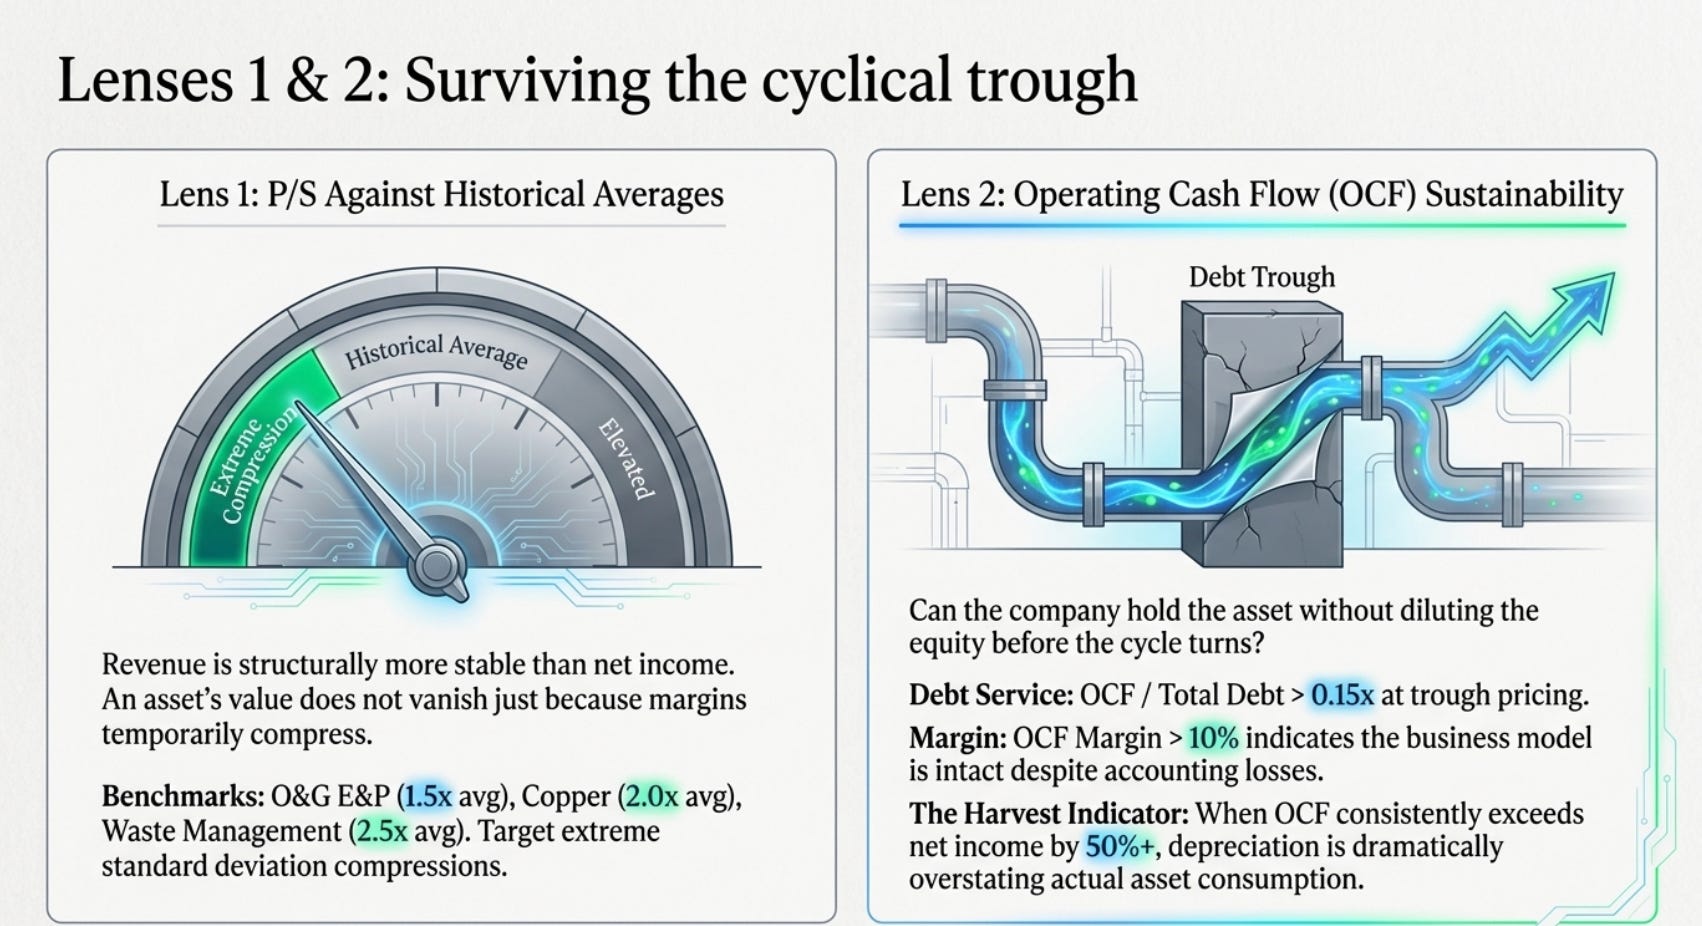
Lens 3: The Structural vs. Cyclical Test
The single most important judgment in distressed asset investing is whether a decline is cyclical (temporary compression of earnings while the asset remains valuable) or structural (permanent impairment of the asset’s ability to generate value).
The assets in this paper have a characteristic that makes them inherently more resistant to permanent impairment than most: they are either physically fixed in the ground (uranium, copper, phosphate, water rights), legally protected by government regulation (gaming licenses, FCC spectrum, airport slots, landfill permits), or inherently sticky due to relationship economics (bank core deposits, Medicaid membership franchises).
An E&P company whose PDP reserves exist in the ground at $70/bbl WTI is not structurally impaired because oil temporarily falls to $45/bbl. The oil is still there. The LOE is still $12/bbl. The moment prices recover, the operating income snaps back. This is not the case for, say, a newspaper company where the decline in print advertising is structural — the asset (classified advertising relationships) is genuinely and permanently gone.
The test: ask whether the primary income-generating asset identified in Section 1 of each sector analysis still exists at the same quantity and quality as before the decline. If the answer is yes — the ore body is untouched, the water rights are unimpaired, the spectrum license is unchanged, the deposit franchise is intact — then the downturn is almost certainly cyclical, and P/S compression against historical averages is the signal to act.
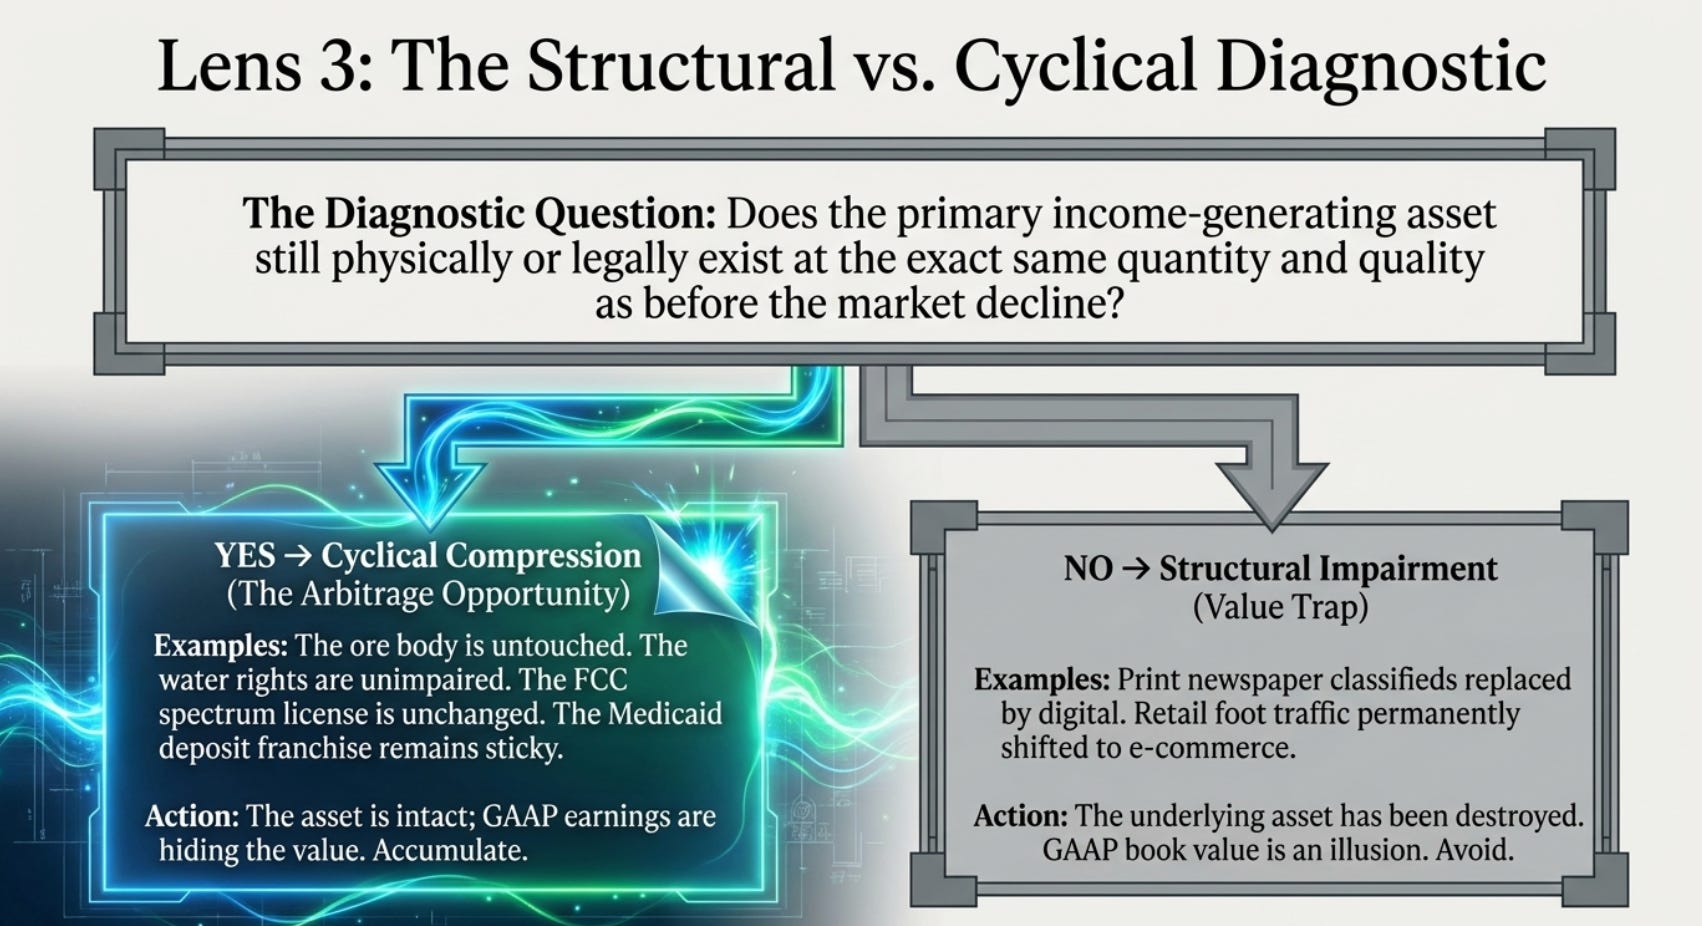
Putting It Together: The Acquirer’s Arbitrage in Practice
The complete framework is:
Identify the primary income-generating asset — using the methodology applied throughout this paper (asset first, income second).
Price the asset at immediate owner’s value — in-ground reserves at current net margin, licensed positions at current GGR per table, membership base at comparable M&A per-member value, deposit franchise at CDI/deposit premium, water rights at comparable transaction price.
Compare to the GAAP book value — identify the size and nature of the gap.
Check current P/S against the sector’s 10-year historical P/S average — significant compression is the entry signal.
Test OCF sustainability — OCF/Total Debt above 0.15x at trough, and OCF margin above 10% at trough, suggests the business can survive until the cycle turns.
Apply the structural vs. cyclical test — if the primary asset is physically or legally intact, the downturn is cyclical. Act accordingly.
Warren Buffett described this framework in its simplest form in his 1979 letter to Berkshire shareholders, discussing his purchase of Washington Post shares at a small fraction of the company’s replacement cost: “Most security analysts, portfolio managers and investment bankers... are quite certain to agree with us that the Post properties were worth at least $400 million. And $150 million purchase cost versus $400 million value is not a difficult equation.” The asset existed. The market temporarily mis-priced it. The framework identified the gap. The rest is patience.
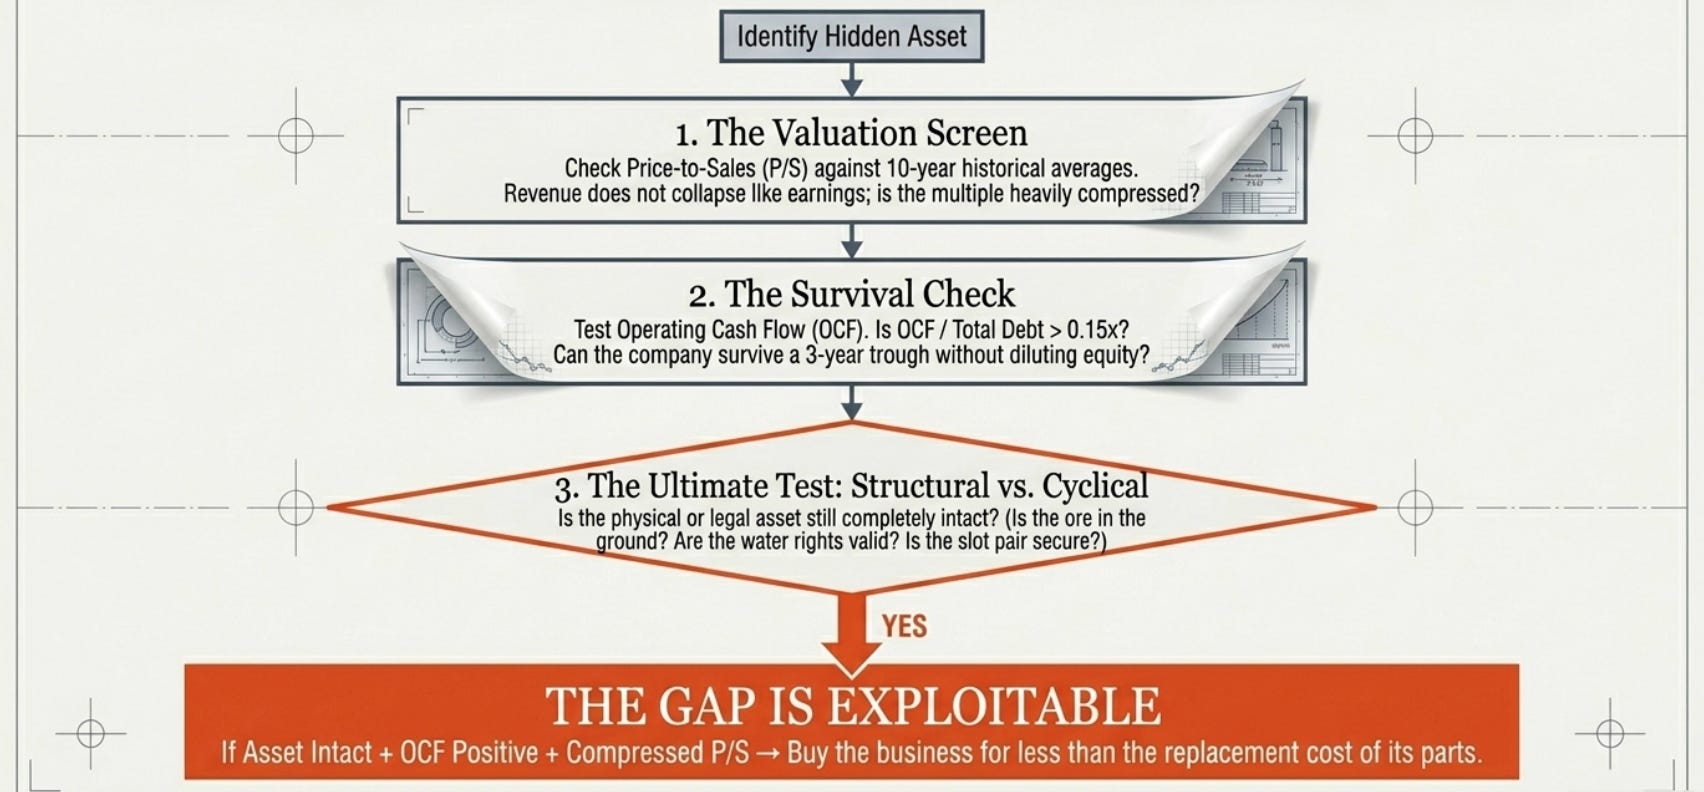
This white paper is for educational and analytical purposes. All data referenced reflects publicly available information from company annual reports (10-Ks), SEC filings, industry publications, and documented market transactions as cited throughout. No investment advice is implied or intended.
If you like what you read, check out my other writings 👇
Rust, Rigs, and the Recurring Revenue Hidden in Plain Sight: A Deep Dive into Beng Kuang Marine (SGX: BEZ)

The Old Steel and the Sea: Why You Should Care About a Ship Maintenance Company
Investment Reflection #2 — The Grand Play: 100 Years of the World’s Nations as Characters in the Greatest Story Ever Told

“The world is not a chessboard. It is a living organism, where every cell — every nation — eats, competes, cooperates, and occasionally tries to eat the others. Understanding it requires not just memorizing moves, but understanding hunger.”

The Tide Is Going Out: Commodity Houses, Private Credit, and the AI Debt Bomb

Start Here: What This Article Is About
Why I Passed on Graftech (EAF): Riding The Battery Hype, Or Perhaps Not...

There is a kind of company that is the most dangerous thing in investing. It is not the fraudulent company. It is not the obviously bad company with terrible products and incompetent management. Those are easy — you just avoid them. The truly dangerous company is the one with a
The Beautiful Trap: Why I'm Passing on The Hour Glass (SGX: AGS)

There’s a peculiar kind of investment that keeps you up at night — not because it’s bad, but because it’s genuinely good. Good enough to admire. Not good enough to buy.
The Diamond in the Rough That Isn't Quite Yours: Why I Passed on Boustead (SGX: F9D)

There is an old saying that investors have borrowed, bent, and quoted so many times it has nearly lost its sharpness: a bird in the hand is worth two in the bush. Warren Buffett, characteristically, gave it a precise mathematical form. The value of any investment, he wrote, is determined by three questions:
The Schoolteacher's Secret Insurer: Why Horace Mann (NYSE:HMN) Is Sitting on My Watchlist

“The stock market is a device for transferring money from the impatient to the patient.” — Warren Buffett

The Dormitory King That Couldn't Leave Home: Why I Passed on Centurion (SGX: OU8)

There is a deceptively simple question that Warren Buffett borrowed from Aesop’s ancient fable, and has repeated across decades of shareholder letters: “How many birds are in the bush? How sure are you they’re there? And how long until you get them out?”
The Children's Place: A $90 Million Bet on a Company That Used to Be Worth $2 Billion (NYSE: PLCE)

There is a classic scene in every heist movie. The detective walks into a room, sees the chalk outline, the scattered evidence, the broken window, and immediately knows something went terribly wrong long before anyone called the police. You do not need the full autopsy report to read the body.
World War 3 In Iran and Why Oil Price Will Continue Increasing — It Arrived Sooner Than Anyone Expected

This is Part 2 of a continuing analysis of California Resources Corp (CRC). Part 1 built the foundational investment case: a company trading at $44 per share against a conservative intrinsic value of $108–$156, built on 567 million barrels of proved developed oil reserves in California, and a management team spending hundreds of millions buying back its…
The Most Overlooked Oil Company in America — And Why That Might Be the Opportunity of the Decade

Date of analysis: 28 December 2025
The Art Of Saying No - MYPS: Playstudios Inc

PLAYSTUDIOS (MYPS) is a Las Vegas-based mobile gaming company that operates free-to-play social casino games and a loyalty platform called playAWARDS, which lets players redeem points for real-world rewards at places like MGM Resorts, Norwegian Cruise Line, and Wolfgang Puck restaurants. On the surface, this sounds like a clever moat. A loyalty program.…
The Art Of Saying No - UGP: Ultrapar Participacoes S.A (Part 2 of 2)

Question 2: How Certain Are You?
The Art Of Saying No - GLIBK: GCI Liberty Inc

Picture this: a single telecommunications company — the dominant one — serves over 200 communities scattered across the largest state in the United States. Alaska. A state with just over one person per square mile. A state where 39% of residents are underserved by broadband. A state where, until recently, some villages received internet via satellite li…

The Art Of Saying No - UGP: Ultrapar Participacoes S.A (Part 1 of 2)

The Setup: A Value Investor Dream?


The Art of Saying No - RIG: Transocean LTD

“The difference between successful people and really successful people is that really successful people say no to almost everything.” — Warren Buffett
The Art of Saying No - KPRX: Kiora Pharmaceuticals Inc

“The difference between successful people and really successful people is that really successful people say no to almost everything.” — Warren Buffett
The Art of Saying No - DNUT: Krispy Kreme Inc

“The difference between successful people and really successful people is that really successful people say no to almost everything.” — Warren Buffett

🎓 A Business Strategy Primer Part 7 - Learning From Great Companies

The Billion-Dollar Playbook: How Market-Based Management Powered Koch Industries’ Unstoppable Rise
The Art of Saying No - MRX: Marex Group PLC

“The difference between successful people and really successful people is that really successful people say no to almost everything.” — Warren Buffett


The Art of Saying No - SFIX: Stitch Fix Inc

“The difference between successful people and really successful people is that really successful people say no to almost everything.” — Warren Buffett
🎓 A Business Strategy Primer Part 2 - Brainstorming Solutions With Value At The Core

Creating An Irresistible Offer
The Art of Saying No - TDOC: Teladoc Health Inc

“The difference between successful people and really successful people is that really successful people say no to almost everything.” — Warren Buffett

The Art of Saying No - MDU: Mdu Resources Group Inc

“The difference between successful people and really successful people is that really successful people say no to almost everything.” — Warren Buffett


The Art of Saying No - AFCG: Advanced Flower Capital Inc

“The difference between successful people and really successful people is that really successful people say no to almost everything.” — Warren Buffett
The Art Of Saying No - VYX: NCR Voyix Corp

“The difference between successful people and really successful people is that really successful people say no to almost everything.” — Warren Buffett
The Art of Saying No - VSTS: Vestis Corp

“The difference between successful people and really successful people is that really successful people say no to almost everything.” — Warren Buffett

🛢️Basic Energy Primer Part 2 - Business and Competitive Landscape

The Man Who Bet Everything on Being Wrong
The Art of Saying No - CISS: C3is Inc

“The difference between successful people and really successful people is that really successful people say no to almost everything.” — Warren Buffett
The Art of Saying No - PSHG: Performance Shipping Inc

“The difference between successful people and really successful people is that really successful people say no to almost everything.” — Warren Buffett

The Art Of Saying No - MAGN: Magnera Corp

The Magnera Corporation Analysis Nobody Asked For (But Everyone Needs)
The Art of Saying No - CHR: Cheer Holding Inc

“The difference between successful people and really successful people is that really successful people say no to almost everything.” — Warren Buffett
The Art of Saying No - WIMI: WiMi Hologram Cloud Inc.

“The difference between successful people and really successful people is that really successful people say no to almost everything.” — Warren Buffett
⚡️Alternative Energy Primer Part 3 - Industry and Sector Technicals

The €2.2 Billion Mistake That Revealed Everything
⚡️Alternative Energy Primer Part 2 - Business & Competitive Landscape

The Shipwreck That Changed Everything

🏥 A U.S. Health Insurance (Managed Care Organizations) Sector Primer

1️⃣ Industry Fundamentals & Macro View

