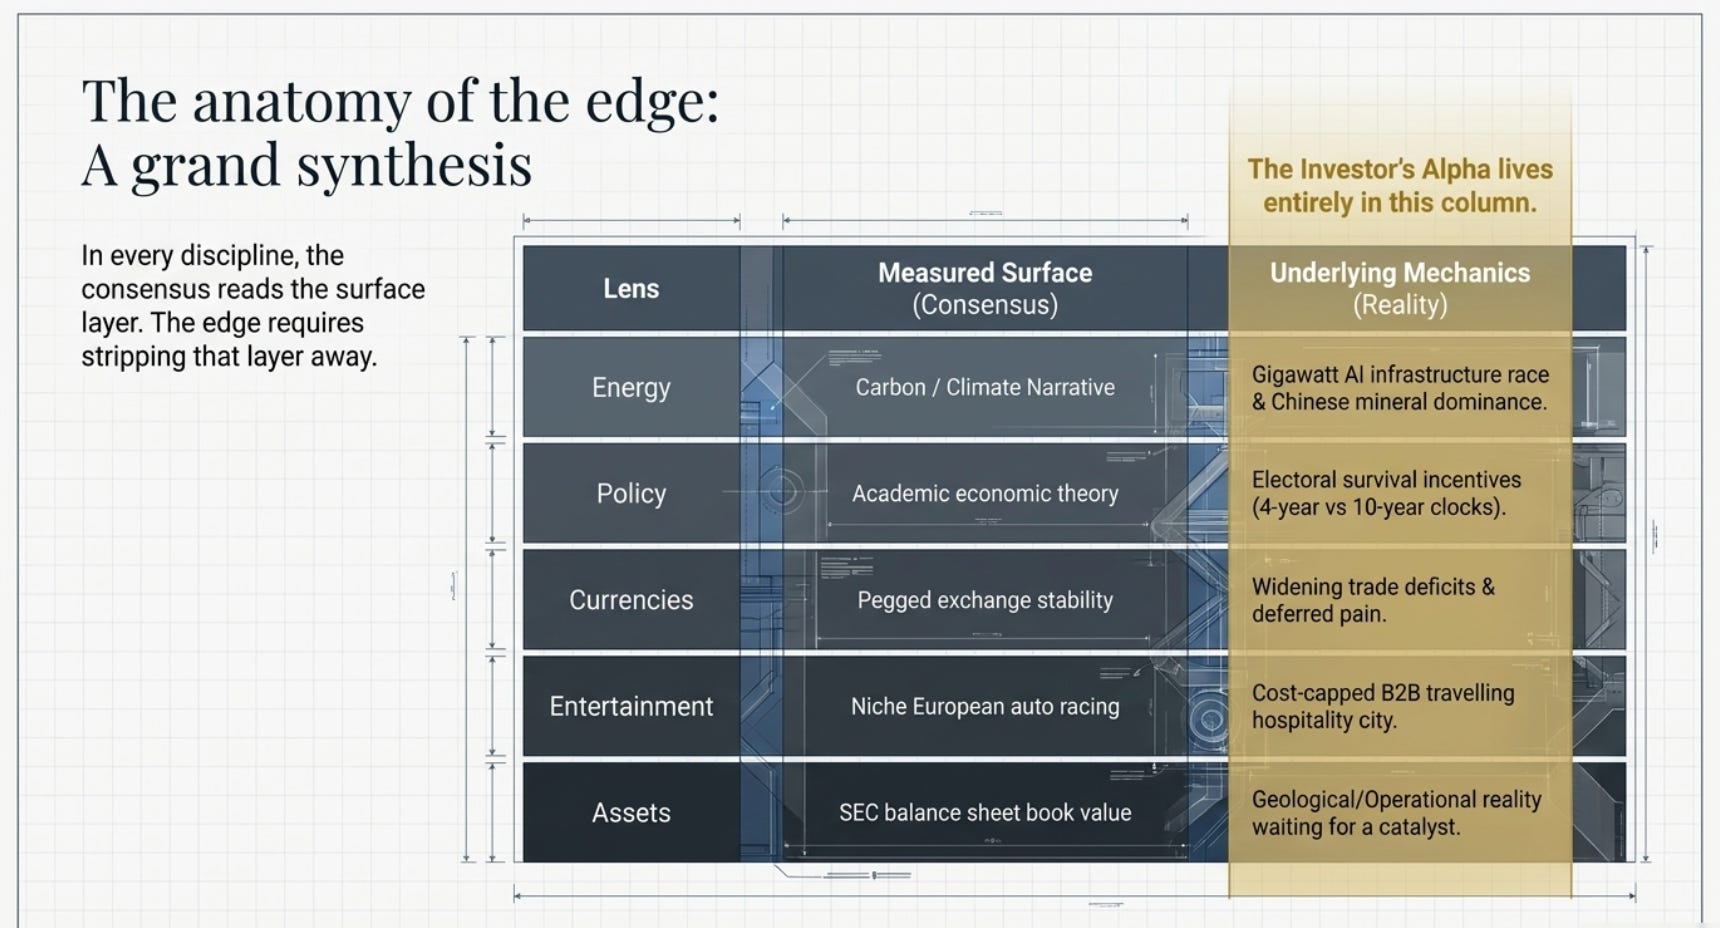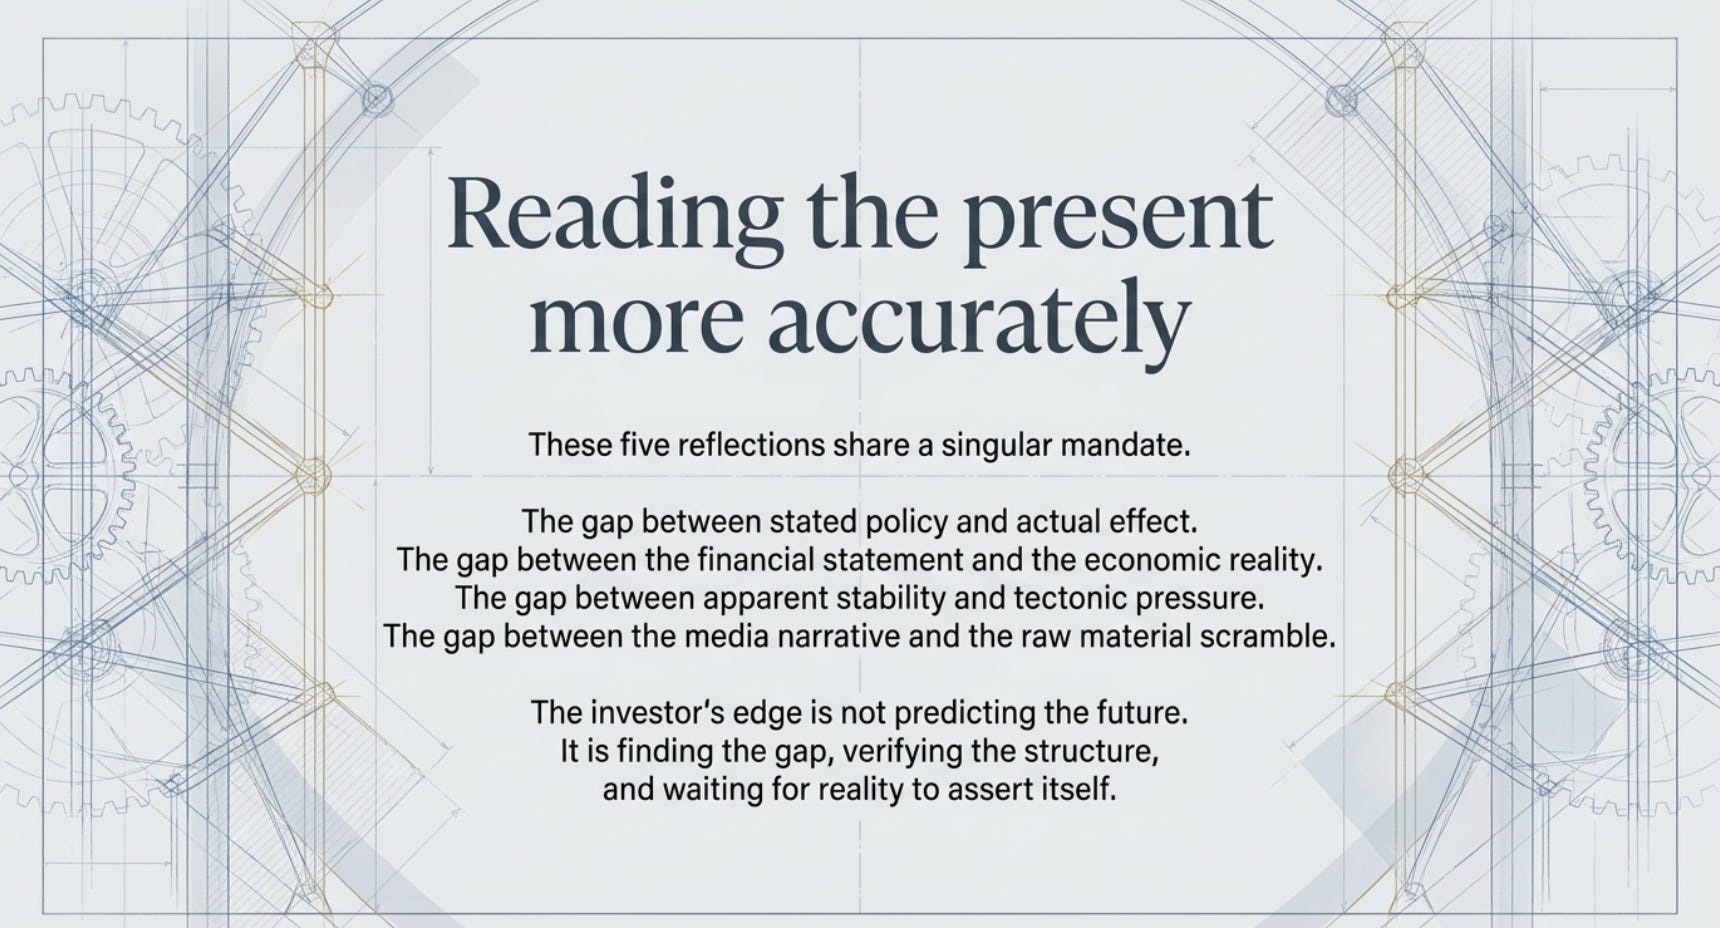
I. The Black Blood That Built the Modern World Order — And What Comes After It
There is a liquid that has shaped borders, toppled governments, funded wars, and quietly determined which currencies the world trusts. It doesn’t look like much. It’s thick and dark and smells faintly of something ancient. But for roughly a century, it has been the single most important physical substance on earth — not because of what it is, but because of what it does, and more critically, who controls the doing.
To understand where global money and power are flowing in the next 30 years, you have to start here. Because the transition that is underway right now — the one the media frames as a climate story — is not primarily a climate story at all. It is a geopolitical and financial story of extraordinary depth. And if you understand it the way an investor must, you’ll see that the terrain is shifting in ways most people have not yet mapped.
How a Liquid Became the World’s Backbone
Begin with the basics. Oil is not just fuel. That framing is far too narrow. Petroleum is the substrate beneath virtually everything in the modern industrial world. It’s in the asphalt under your car. It’s in the plastic bottle holding your water. It’s in the fertilizer that grew your food, the synthetic fiber in your shirt, the rubber in your shoes, the pharmaceuticals in your medicine cabinet. When people say oil is important, they tend to picture gasoline. The reality is far larger than that.
For transportation specifically, oil still powers roughly 80% of all movement on earth — planes, ships, trucks, cars. There is no substitute at scale for aviation fuel, no battery technology that today powers a container ship carrying 20,000 tonnes of goods from Shanghai to Rotterdam. A world without oil, even tomorrow, would be a world that stops.
This physical reality created a political reality: whoever controlled the oil controlled something close to the circulatory system of industrial civilization. And that reality, compounding over decades, eventually built something even more powerful than the oil itself.
The Invisible Engine of Dollar Dominance
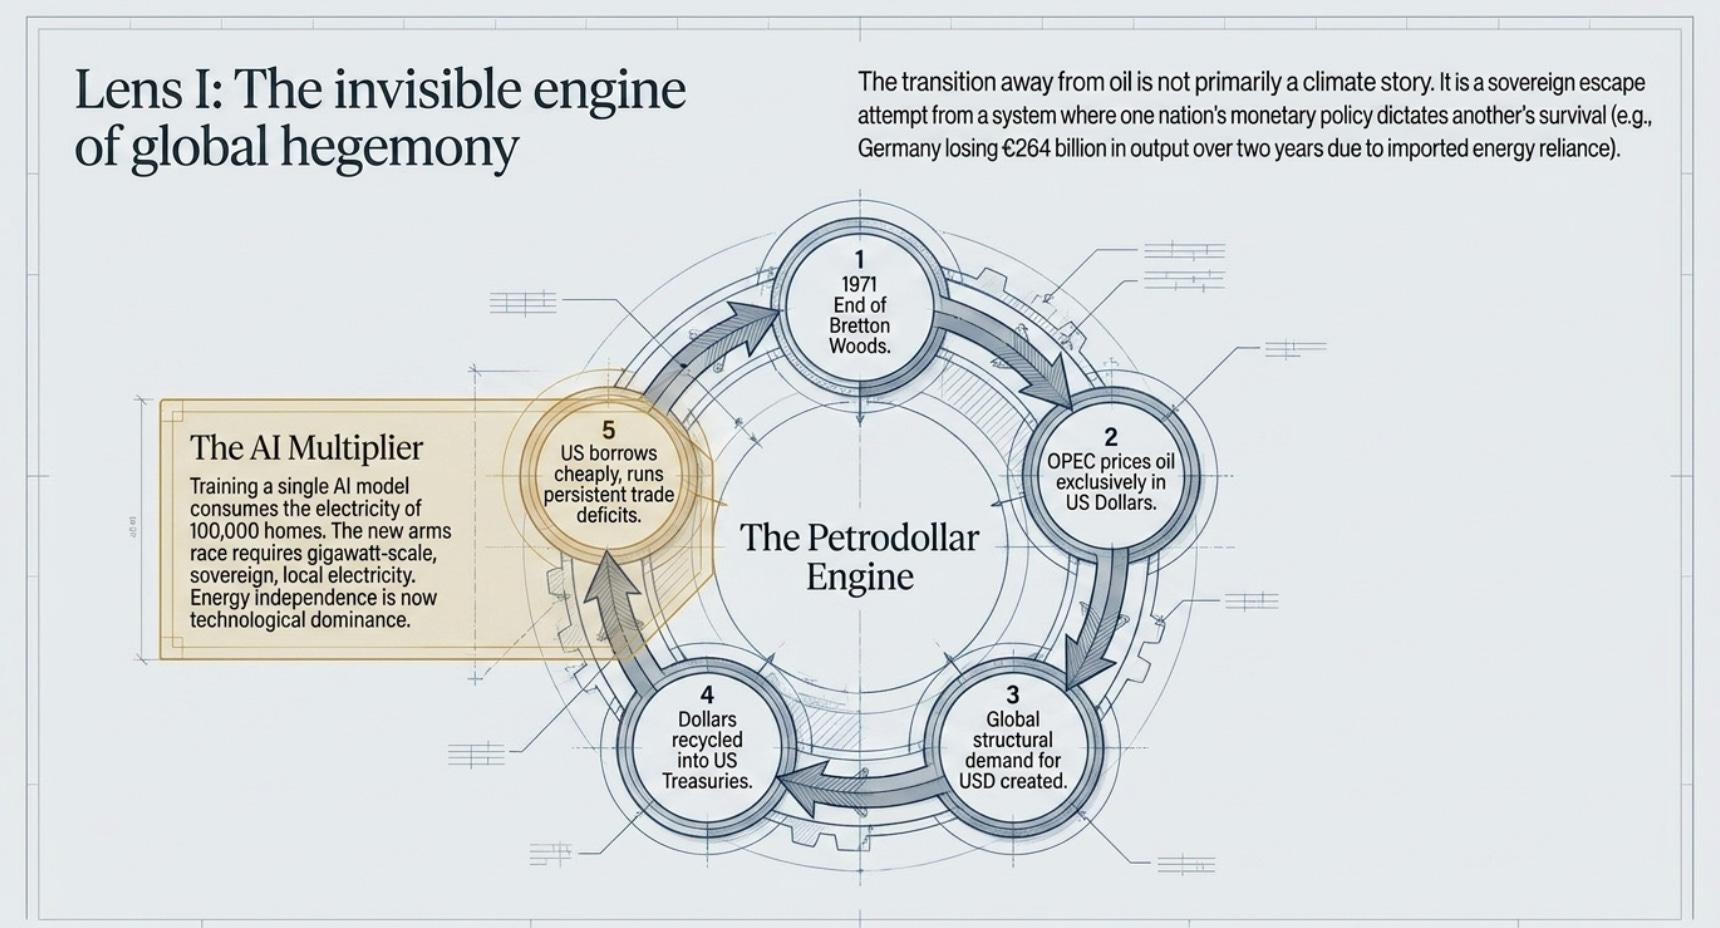
In 1971, something happened that most people treat as a dry footnote in macroeconomic history. On August 15th, US President Richard Nixon announced that the United States would no longer redeem US dollars for gold. The Bretton Woods system — where the dollar was backed by gold and every other currency was pegged to the dollar — simply ended.
The world was in shock. If the dollar wasn’t backed by gold, what was it backed by? The answer, hammered out quietly in the years that followed through intensive diplomatic work, was oil.
By 1974, an agreement had been forged with Saudi Arabia that would define global finance for the next fifty years. The mechanics were elegant in their brutality. Saudi Arabia and its OPEC neighbors agreed to price and settle all oil sales exclusively in US dollars. In exchange, the United States provided military protection, security guarantees, and access to arms. The deal meant something profound: every country on earth that needed to import oil — and virtually every country needed to import oil — had to first acquire US dollars to pay for it.
This created a permanent, structural, global demand for US dollars that had nothing to do with whether America’s economy was well-managed, whether its politicians were competent, or whether its interest rates were attractive. Countries had to hold dollars the way you have to hold oxygen. The dollar became the world’s reserve currency not because America earned it through virtue, but because it sat at the bottleneck of the world’s most essential commodity.
The consequences cascaded. Countries ran trade surpluses with the US, accumulated dollars, then recycled those dollars into US Treasury bonds — lending money back to America at low rates. This allowed the United States to borrow cheaply, run persistent trade deficits, and consume more than it produced, year after year, decade after decade, without the currency crisis that would have destroyed any other nation doing the same. Economists call this the “exorbitant privilege.” It is perhaps the greatest structural advantage any nation has held in modern history, and it was purchased not with gold but with black liquid.
The system created a remarkable set of incentives. If a major oil-producing nation were to price its oil in euros, or yuan, or a gold-backed currency, the demand for US dollars would fall. The US’s ability to borrow cheaply would erode. Its financial hegemony would weaken. It is worth noting — and left to the reader’s own investigation — that the leaders of several oil-producing nations who publicly discussed pricing oil in non-dollar currencies found their governments facing extraordinary external pressure in the years that followed.
Why Every Country Is Quietly Trying to Escape This System
Here is the tension that drives the energy transition in ways that have nothing to do with carbon. Being forced to hold US dollars means being exposed to US monetary policy. When the US Federal Reserve raises interest rates — as it did aggressively in 2022 and 2023 — dollars become more expensive, and countries that owe dollar-denominated debt are suddenly squeezed. Their currencies weaken against the dollar, their import bills surge, and they face financial crises that originated not in their own decisions but in a room in Washington, D.C.
Germany understood this vulnerability acutely with natural gas. When Russia shut off Nord Stream gas deliveries in 2022, Germany — Europe’s largest economy — found itself in an energy crisis overnight. Industrial production slowed. Winter heating became a national security concern. GDP contracted. Germany lost roughly €264 billion in economic output over two years because its energy supply was a political hostage held by another nation’s government.
Energy dependency is geopolitical vulnerability. And every major nation on earth has understood this for decades. What has changed is that there is now a genuine alternative — not a perfect one, not a complete one, but a real one. Renewable energy is the first energy source in human history that is both scalable and inherently local. The sun shines everywhere. The wind blows everywhere. A solar panel installed in Morocco generates electricity for Morocco. It does not require purchasing dollars, does not require navigating shipping lanes, does not require diplomatic relationships with regimes thousands of miles away. It is, for the first time, truly sovereign energy.
This is why the energy transition is happening regardless of whether you believe in climate science. It is happening because energy independence is national security. Saudi Arabia itself understands this — Vision 2030, the kingdom’s ambitious diversification plan, is a sovereign admission that the petrodollar era will end. Aramco’s partial IPO in 2019 was, in a sense, Saudi Arabia quietly cashing out a portion of its prize while it still commands the highest price.
The AI Multiplier — Why the Stakes Just Got Higher
There is one development that has dramatically accelerated the strategic importance of cheap, locally generated electricity, and it arrived in the past three years with startling speed.
Training a single large-scale artificial intelligence model consumes as much electricity as 100,000 homes do in a year. That is not a metaphor or an exaggeration — it is the actual measured power draw of the infrastructure required. And the trajectory is upward. Microsoft, Google, Meta, and Amazon are each planning gigawatt-scale data center expansions across the United States, Europe, and Asia. A gigawatt is the output of a large nuclear power plant. These companies need not one such facility, but dozens.
The country that can generate vast quantities of cheap, reliable, locally produced electricity will be the country where AI infrastructure is built. The country where AI infrastructure is built will be the country that leads AI development. The country that leads AI development will be the dominant economic and military power of the mid-21st century. This chain of causation is not speculative — it is already visible in the investment decisions of the world’s largest companies.
Here is the extraordinary consequence: renewable energy was already strategically important for geopolitical sovereignty. It is now doubly, triply important because it is the fuel for the most consequential technological race in human history. Countries that dismiss the energy transition as an environmental luxury are missing that it is actually an arms race for the infrastructure of the future.
The Supply Chain Slides Downward — From Wells to Mines
Now comes the most interesting part for the investor, the part where the story turns from geopolitics to specific, touchable, investable economic realities.
When you replace an oil-powered world with an electricity-powered world, you don’t eliminate commodities. You swap one commodity for another. And the new commodities are fundamentally different in their geography and their geopolitics.
Oil, broadly speaking, is concentrated in a handful of politically sensitive regions — the Middle East, Russia, Venezuela, Nigeria. The world’s energy dependence on these regions created the petrodollar system. But the clean energy infrastructure — the solar panels, wind turbines, electric vehicles, and the batteries that store their power — requires a different set of raw materials, and those materials are concentrated in a different set of regions with their own set of political complexities.
Consider copper. An electric vehicle requires approximately 83 kilograms of copper, compared to roughly 23 kilograms for a conventional internal combustion vehicle. A single offshore wind turbine requires 9 to 15 tonnes of copper. A utility-scale solar farm consumes 5 to 6 tonnes of copper per megawatt of capacity. The International Energy Agency projects that copper demand from clean energy alone could double or triple by 2040. There is no clean energy world without copper. It is as foundational to the energy transition as steel was to the industrial revolution.
Now consider where copper comes from. The world’s largest copper reserves sit in the Democratic Republic of Congo and Zambia — the ancient geological formation known as the Central African Copper Belt. The DRC alone holds an estimated 20% of global copper reserves. The DRC also holds more than 70% of global cobalt reserves — a material essential for lithium-ion batteries in every electric vehicle on earth.
And here is where the story becomes remarkable. Chinese companies — CMOC Group (formerly China Molybdenum), Zijin Mining, and others — have, over the past fifteen years, quietly acquired controlling positions in many of the most significant mines across the DRC and the broader African continent. China does not necessarily have to own these resources for them to serve Chinese strategic interests. Under a framework of long-term supply contracts, equity stakes in African mining operations, and infrastructure loans from Chinese state banks through Belt and Road Initiative agreements (China has committed over $1 trillion in BRI investment, a disproportionate share of which targets resource-rich African nations), Beijing has positioned itself as the dominant intermediary in the supply chain of the clean energy transition.
This is the structure: the ore is African, but the processing, refining, and manufacturing is overwhelmingly Chinese. China today processes roughly 85 to 90% of the world’s rare earth elements — not because it mines all of them, but because it built the processing infrastructure when no one else thought it was worth doing. For rare earth materials specifically, this means that even ore mined in Australia or the United States often travels to China for processing before it can become a magnet for a wind turbine or an EV motor.
The investor’s observation here is precise: the transition from oil to clean energy does not dissolve the geopolitical commodity problem. It transforms it. The world spent fifty years fighting over the supply of petroleum. The next fifty years will involve a different but structurally analogous contest over the supply of copper, cobalt, lithium, and rare earth elements. The battleground will be different — less in Middle Eastern deserts, more in African jungles and Andean highlands. But the underlying dynamic is the same: nations that control the critical inputs to modern civilization hold extraordinary leverage over those who need them.
For the investor, the key insight is this: the supply chain of the energy transition is moving downward — from the liquid that was burned in engines, to the metals and minerals that are built into the machines that replace those engines. Understanding that supply chain, country by country and mineral by mineral, is one of the most valuable analytical frameworks available for the next decade.
II. The Policy Graveyard — Why the Men Who Run Economies Have Almost Never Built One
Let me describe an experiment that has been conducted countless times, in countless countries, across every political system humanity has tried. A person of ambition, intelligence, and genuine conviction rises to a position of economic authority — finance minister, prime minister, central bank governor, president. They arrive with a theory of how economies work, shaped by academic credentials, political ideology, or simply the consensus of the advisors around them. They apply their theory through policy. And with remarkable regularity, the results diverge from the intent in ways that the theory predicted would not happen.
This is not a coincidence. It is a structural feature of how democratic governance and economic complexity interact, and understanding it is one of the most useful lenses an investor can develop.
The Engineer Who Never Walked the Ground
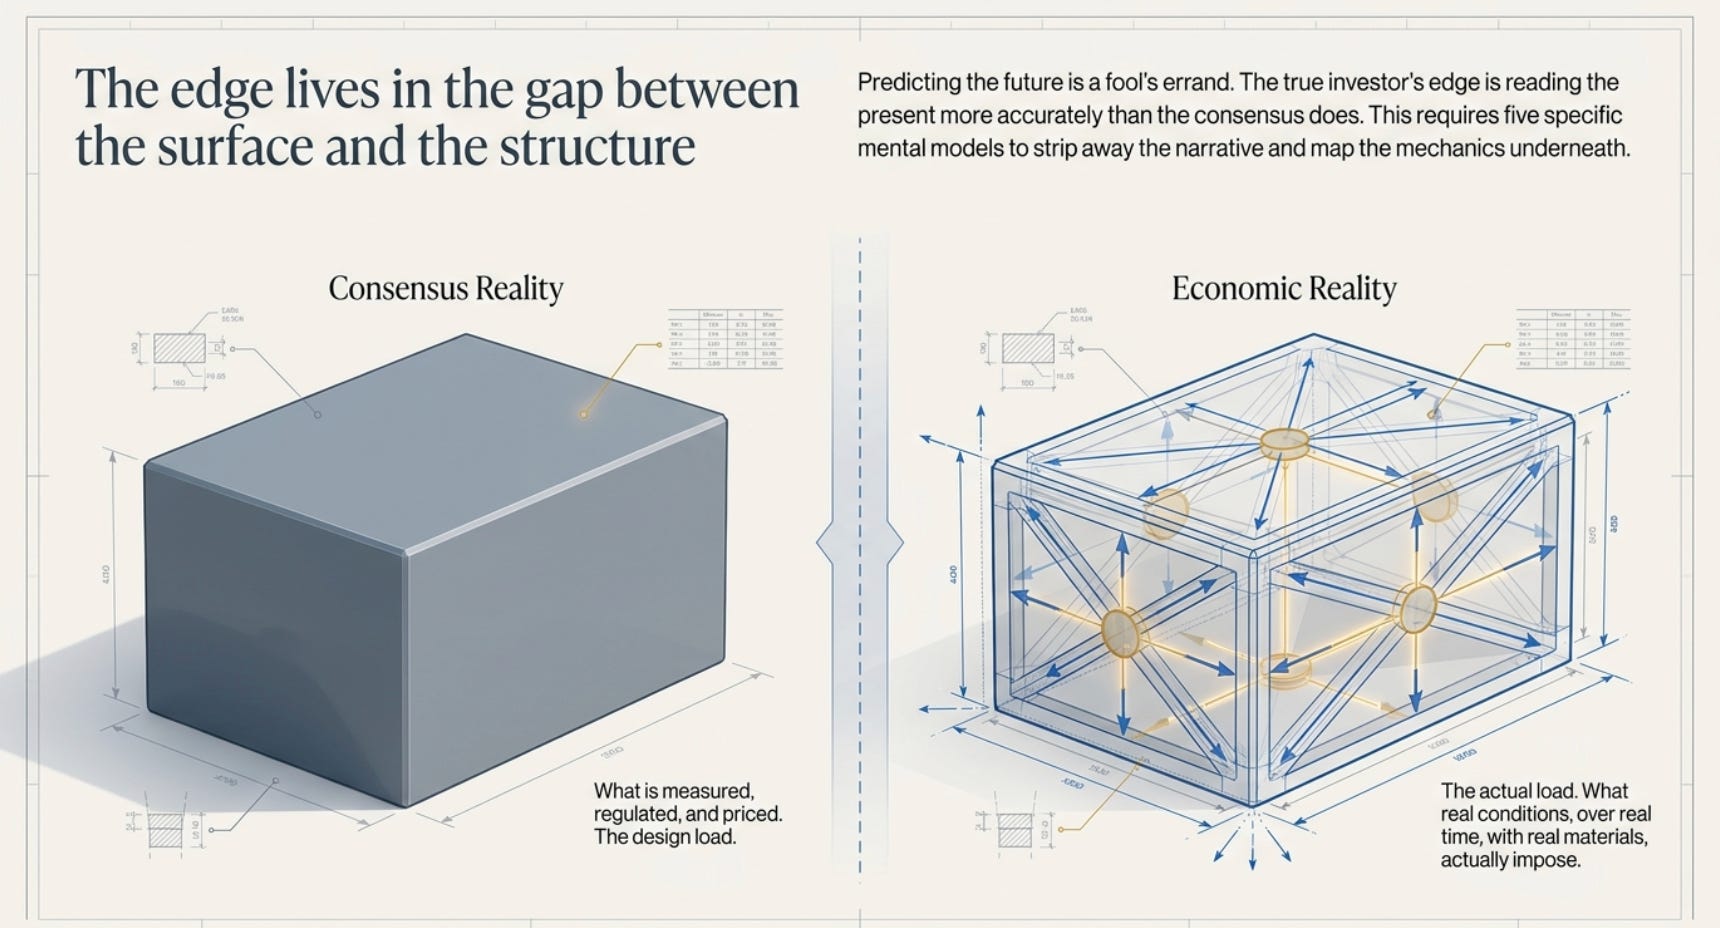
In engineering, there is a famous distinction between the design load and the actual load. The design load is what the engineer calculates the structure must support. The actual load is what real conditions, over real time, with real materials, actually impose. Bridges that were calculated to be perfectly safe have collapsed because the engineer’s model didn’t account for wind-induced resonance, or the way steel fatigues under repeated stress, or the way soil shifts under specific moisture conditions. Theory, however mathematically rigorous, is always an abstraction of reality. And reality does not consult the abstraction before asserting itself.
Economic policy is a bridge built by engineers who, in most cases, have never personally felt the ground vibration. A finance minister who studied economics at a prestigious university, then worked in government, then in international finance, then returned to government — this is the standard biography. It is a career spent entirely above the level of the economy, studying it, modeling it, advising on it, but never actually inside it. Never running a business where making payroll required genuine creativity in a bad month. Never experiencing what it means to hire your first employee and feel the weight of that obligation. Never navigating the actual friction of regulation, of tax compliance, of bank credit decisions, of customer behavior.
This matters not because experience is the only teacher — some of the most practically useless thinkers are purely experiential — but because the gap between policy design and policy impact is almost always largest precisely in the dimensions that lived experience would illuminate.
When Good Intentions Create Predictable Disasters
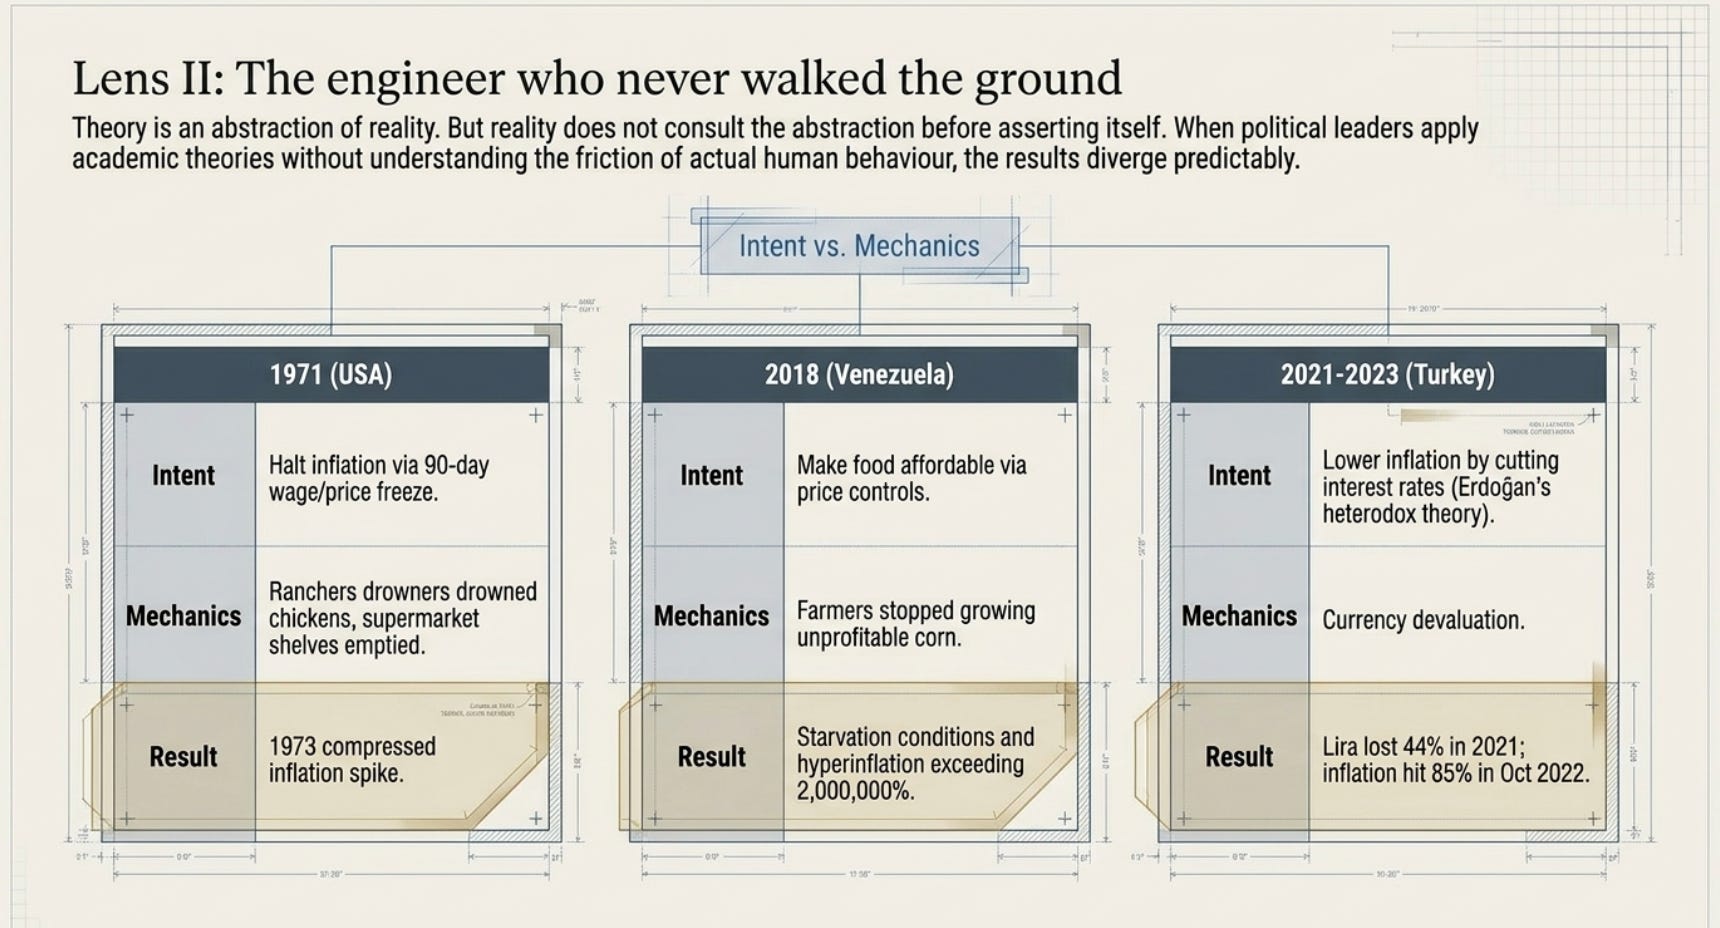
Nixon’s wage and price controls are perhaps the most instructive American example. In August 1971, facing inflation driven by his own expansionary policies and a weakening dollar, Nixon announced a 90-day freeze on all wages and prices in the American economy. The logic was clean: if prices can’t rise, inflation stops. Phase One became Phase Two, which became Phase Three, which became Phase Four, as the administration kept trying to maintain control over a market that could not be controlled.
The result was a masterclass in unintended consequences. Farmers, unable to sell chickens profitably under the controlled prices, drowned them rather than sell at a loss. Cattle ranchers withheld beef from markets. Supermarket shelves emptied. A nation that produced enormous agricultural surpluses faced food shortages — not because food was scarce, but because the price mechanism that signals where food should go was disabled. When Phase Two price controls were lifted in 1973, prices exploded upward to where they would have been naturally, creating a spike of inflation that was, in effect, the compressed release of all the natural price discovery the controls had prevented.
Venezuela offers the modern textbook case. Hugo Chávez and later Nicolás Maduro implemented price controls on food staples to make them “affordable for the poor” — a genuine humanitarian instinct. But price controls don’t change the cost of production. A farmer who cannot sell corn at a profit has only one rational response: stop growing corn. Venezuelan agricultural production collapsed. Shelves emptied. The country that sits atop one of the world’s largest oil reserves simultaneously experienced starvation conditions and hyperinflation that, at its peak in 2018, exceeded two million percent annually. The most generous reading of these events is that the policy was well-intentioned and catastrophically wrong. The mechanism of failure was entirely predictable from basic economic reasoning.
Turkey provides the most recent, and in some ways the most astonishing, example. President Erdoğan holds a heterodox conviction — stated repeatedly, publicly, and with evident sincerity — that high interest rates cause inflation rather than suppress it. This inverts the mainstream economic consensus and roughly every empirical study of monetary policy conducted in the modern era. But Erdoğan controls Turkey’s central bank, and from 2021 to 2023, he forced it to cut interest rates while inflation was surging. The Turkish lira lost 44% of its value in 2021. Inflation reached 85% in October 2022. Ordinary Turkish citizens watched the purchasing power of their savings evaporate in real time.
Here is the investor’s observation: Erdoğan’s position was not privately held — it was publicly stated years before the crisis. The pattern was visible. The theory was known. The policy direction was announced. An investor who understood monetary economics, and who took the stated policy seriously, had time to position accordingly. The lira’s collapse was not a surprise; it was a prediction confirmed by events.
The Electoral Clock vs. the Economic Calendar
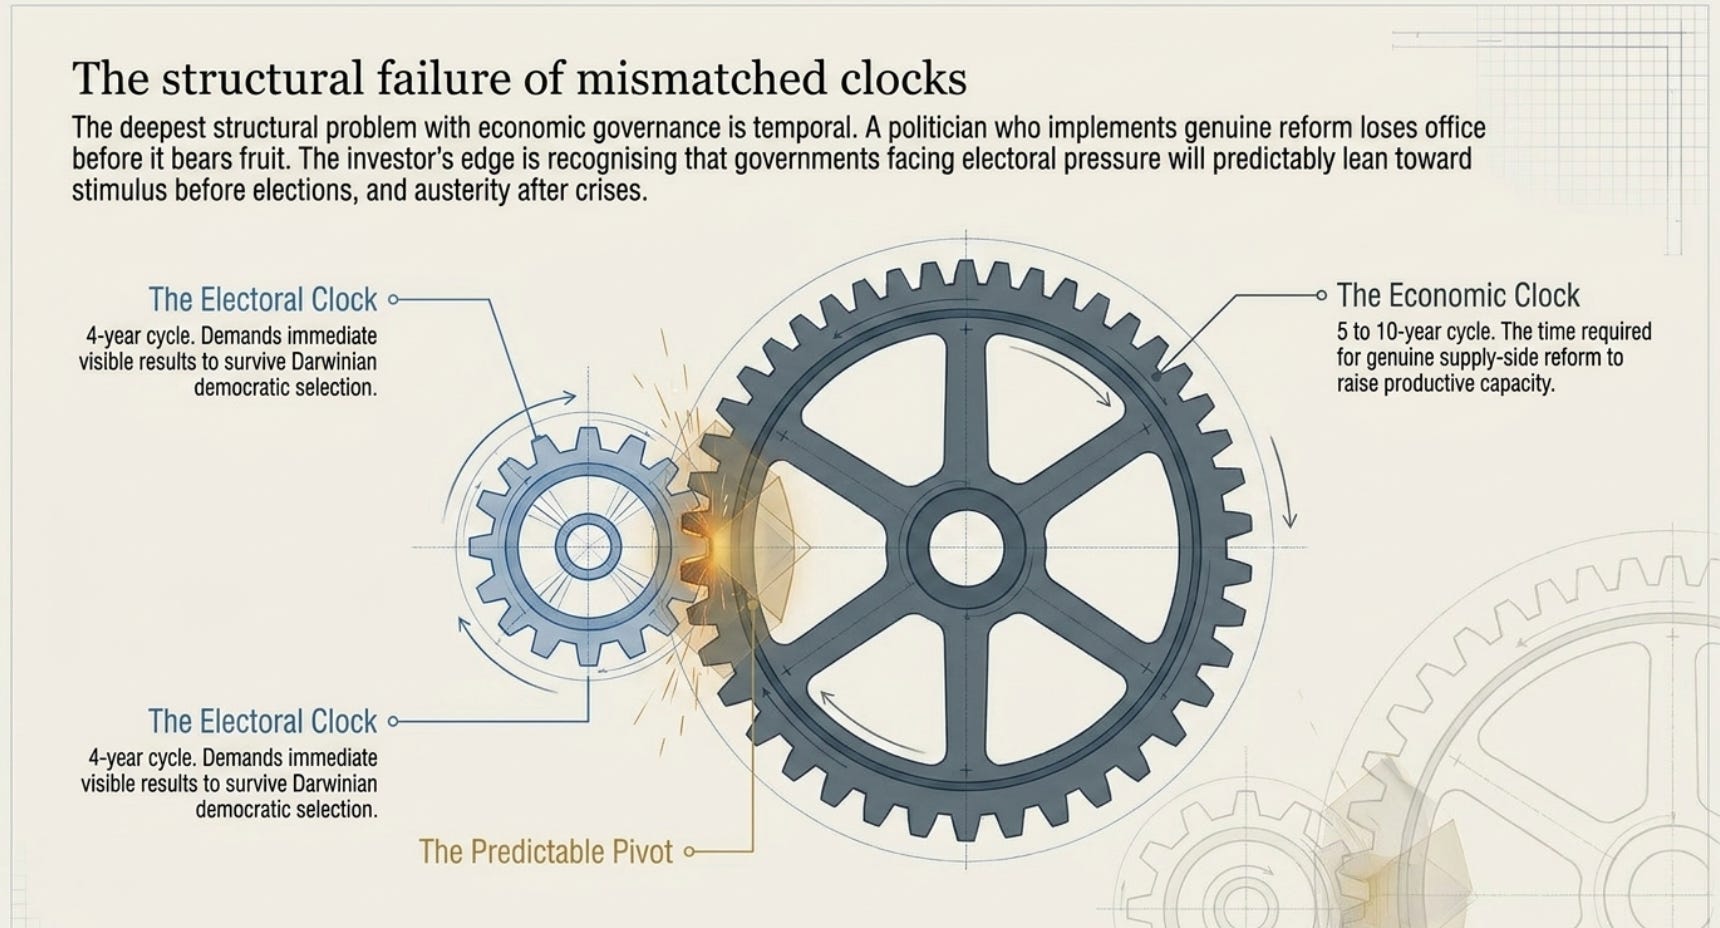
The deepest structural problem with economic governance is temporal. Real economic reform — the kind that raises a country’s productive capacity sustainably — takes five to ten years to produce visible results. Electoral cycles are four to five years. The math is brutal: a politician who implements genuine supply-side reform that will bear fruit in year eight cannot credibly point to results at the year-four election. Their opponent, who promises immediate relief through spending, wins. The reformer loses office before the reform delivers. The cycle repeats.
This is not a character flaw in individual politicians. It is the inevitable consequence of the incentive structure in which they operate. Democratic politicians who prioritize long-run economic health over short-run electoral survival are, in the Darwinian logic of democratic politics, selected against. The system rewards the person who makes voters feel good today, not the person who makes voters rich in a decade.
For the investor, this creates a predictable pattern. Governments facing electoral pressure will lean toward stimulus, spending, and money supply expansion before elections and toward austerity, rate hikes, and painful adjustment after crises. The specific timing varies by country and context, but the directional pull of incentives is remarkably consistent. This doesn’t apply to just governments but business/ capital cycles as well — now we know why people in power often “fail-up”.
III. The Illusion of the Peg — How Governments Borrow Tomorrow’s Pain to Pay for Today’s Smile
Picture a small town called Spendsville.
The mayor is worried. The economy is sluggish, people are unhappy, and nobody is spending money. So he does what feels good in the short term: he prints more money and borrows heavily to hand out cash, build roads, and keep everyone smiling. It works. The town is buzzing. Shops are full. People are happy.
But here is the part most people miss.
Money is just a claim ticket. It is a piece of paper that says I am owed one apple. But if the mayor prints twice as many tickets without growing more apples, each ticket is now only worth half an apple. That is inflation. Prices didn’t really go up — your money just became worth less.
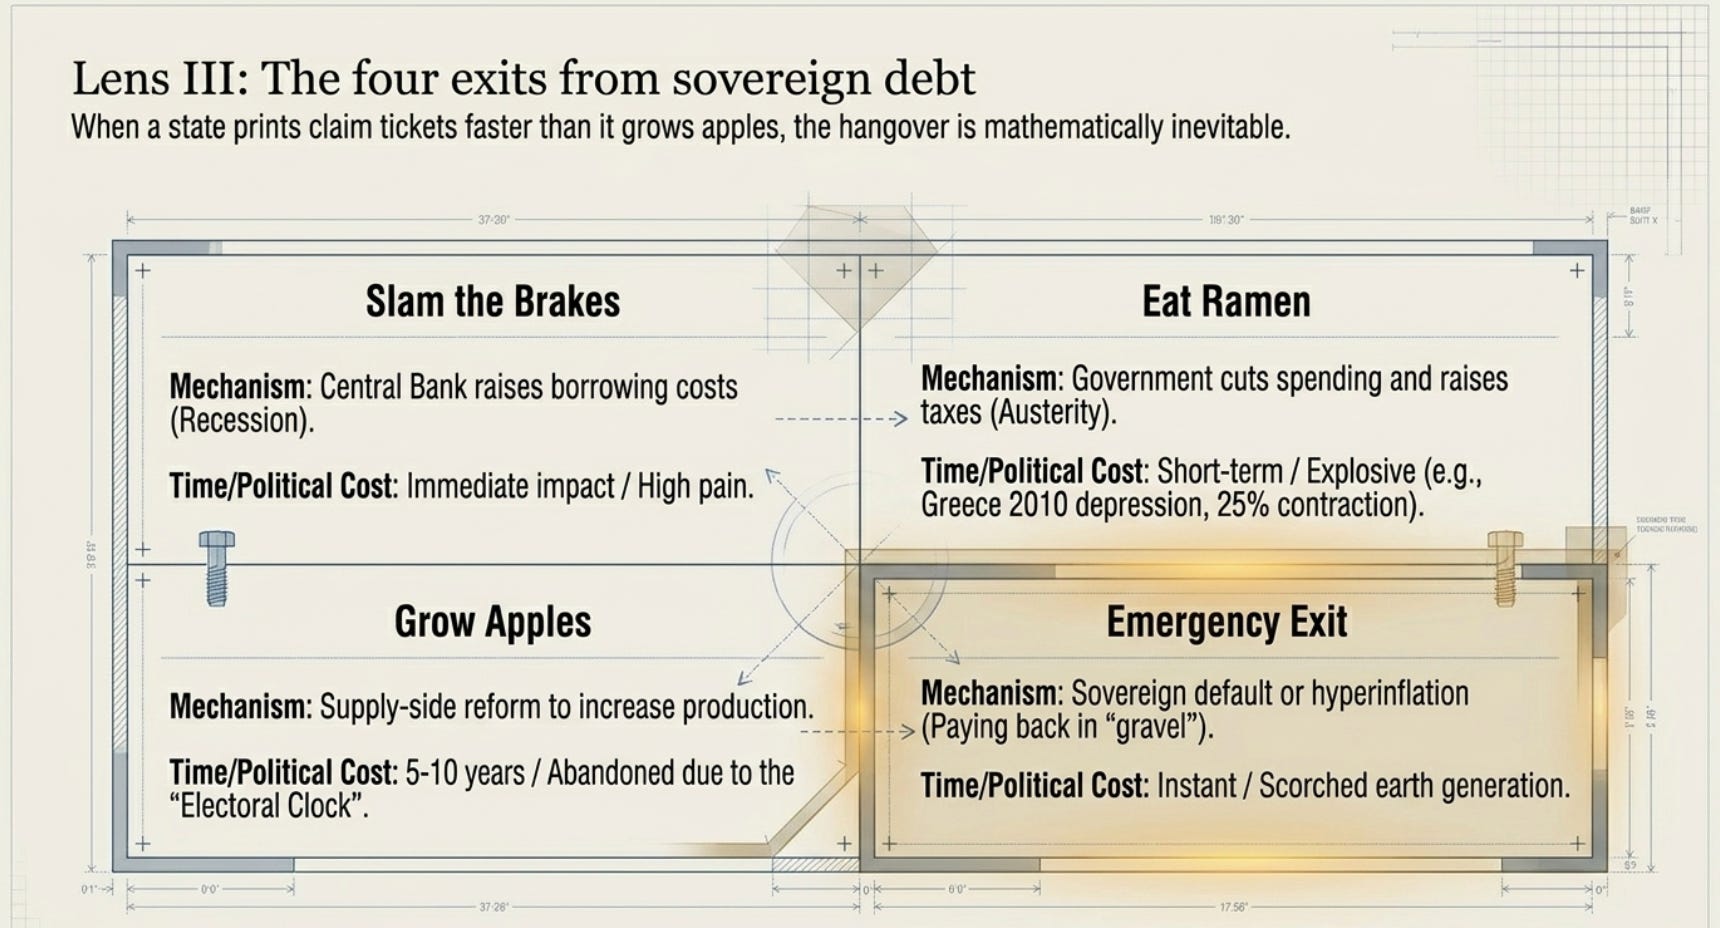
Now the hangover hits. Prices are soaring. The town owes massive debts. The mayor has four ways out, and none of them are pleasant.
The first option is to slam the brakes. The mayor calls the town’s bank referee — the Central Bank — and says, raise the cost of borrowing money. Suddenly the man who wanted a loan to open a bakery can’t afford it anymore. The family thinking of buying a house on credit decides to wait. People stop spending. And when people stop spending, shop owners stop raising prices, because if they do, nobody buys. Inflation dies. But so does growth. It’s like curing a fever by jumping into ice water — it works, but you’re shivering afterward. This shivering is a recession: unemployment rises, businesses shrink, and everyone feels the squeeze. The whiplash is real.
The second option is to eat ramen. The mayor looks at the town’s books and says, we spent like crazy — now we tighten our belts. He cancels the new swimming pool project. He cuts the town doctor’s budget. He raises everyone’s taxes by 5%. Money gets pulled back out of the system. Debts get paid. Books get balanced. But the townspeople are furious. Services got worse and they’re paying more taxes. This is austerity — and historically, it is politically explosive. Greece attempted it in 2010. The streets filled with protests almost immediately, with 100,000 people surrounding the parliament building before the ink on the agreement with international creditors had dried. The government nearly collapsed. The economy contracted by 25% over six years — a depression, not a recession.
The third option is to grow your way out. Here is the elegant solution — the one everyone wants but nobody has the patience for. Instead of taking money away or making borrowing painful, what if the town just produced more apples? If there are twice as many apples, prices naturally fall without hurting anyone. The mayor passes laws making it easier for farmers to grow, businesses to hire, inventors to build. This is supply-side reform. It is beautiful in theory and brutally slow in practice. It takes five to ten years to show results. Politicians need to win elections every four years. So this option is almost always abandoned before it delivers, or never started at all.
The fourth option is to pull the emergency exit. The debts are so crushing that nothing else works. So the mayor does the unthinkable — he either says we’re not paying you back (sovereign default), or he prints so much money that the debt becomes meaningless in real terms. Imagine you owe someone 1,000 gold coins. You secretly pass a law making gold worth the same as gravel. You hand them 1,000 coins of gravel and call it even. Technically, you paid. But you just handed them trash, and everyone knows it. No one lends Spendsville money for a generation. Citizens who saved their whole lives watch their savings evaporate. It is the nuclear option. It ends the immediate crisis but scorches the earth.
Argentina: The Country That Tried All Four and Still Collapsed
Argentina is the perfect investment case study not because it is exotic or unusual — but because it is typical. It is what happens when the underlying economic mechanics run their full, uninterrupted course. The fact that it happened in a country most people think of as sophisticated and educated makes it more instructive, not less.
In 1989, Argentina had just endured hyperinflation exceeding 3,000% annually. The bolivar was being replaced almost daily. Businesses couldn’t set prices. Workers demanded salary adjustments weekly. The economy was a hall of mirrors where every reflection was distorted. Then, in 1991, under Economy Minister Domingo Cavallo, Argentina implemented what seemed like a brilliant solution: the Convertibility Plan. Every Argentine peso would be permanently, legally, irrevocably pegged to one US dollar. The Central Bank was required by law to hold one dollar in reserve for every peso in circulation. No cheating. No exceptions.
It worked magnificently — for a while. Inflation dropped from 3,000% to 4% in a single year. Foreign investment poured in. Economic growth averaged 6% annually through the early 1990s. Argentina was held up as a model for emerging market reform, celebrated by international institutions, studied by economists. The peg seemed like it had broken the cycle.
Here is where the trap springs.
A currency peg means surrendering monetary sovereignty. Argentina’s peso could not weaken to reflect Argentina’s actual economic conditions — it was locked. In 1999, Brazil — Argentina’s largest trading partner — allowed its currency, the real, to depreciate sharply. Overnight, Brazilian goods became 40% cheaper than Argentine goods. Brazilian workers and Brazilian companies were suddenly far more competitive. Argentina’s exports collapsed. Its factories couldn’t compete. But because the peso was fixed to the dollar, Argentina had no mechanism to restore competitiveness through currency adjustment.
To maintain the peg and keep the lights on, Argentina had to borrow dollars. But it couldn’t print dollars — only the US Federal Reserve could do that. So Argentina borrowed from international markets, from the International Monetary Fund, from domestic pension funds, running up a debt load that by 2001 had reached 62% of GDP with no credible path to repayment. It was paying off old credit cards with new ones. Every borrowed dollar kept the peg alive for one more day and made the eventual collapse one order of magnitude more catastrophic.
In December 2001, the lenders finally said enough. The Argentine government, facing a bank run as citizens tried to convert pesos to dollars before the peg broke, imposed the corralito — a freeze on bank accounts. Argentine citizens were allowed to withdraw no more than 250 dollars per week from their own savings. Families who had spent their working lives accumulating savings in what they believed were secure, dollar-equivalent peso deposits found they could not access their own money.
The government defaulted on $100 billion in sovereign debt — the largest sovereign default in history at the time. GDP contracted by nearly 11% in 2002. Unemployment hit 25%. More than half the population fell into poverty. The country went through five presidents in thirteen days as each government failed to command legitimacy under conditions of economic collapse.
The painful investor’s lesson from Argentina isn’t that pegs are always wrong. Hong Kong has maintained a dollar peg since 1983 and survived repeated speculative attacks.
The “Fortress” vs. The “Empty Vault”: Hong Kong maintains a massive Exchange Fund of over US$425 billion, which is roughly 1.7 times its entire monetary base. This creates “unlimited credibility” because the market knows every HK dollar can be exchanged for a US dollar. In contrast, Argentina’s reserves were frequently depleted to pay for imports or government debt; by the 2001 collapse, they lacked the dollars to back the pesos in circulation, triggering a bank run.
Constitutional Balance vs. Printing Money: Hong Kong is legally bound by Article 107 of its Basic Law to keep spending within its means and avoid deficits. They cannot simply print money to pay for social programs. Argentina, however, suffered from “fiscal dominance,” where the government ran large deficits and forced the central bank to fund them. This created a surplus of pesos that the central bank couldn’t back with dollars, making the 1:1 peg mathematically impossible to keep.
Internal Deflation vs. Political Rigidity: When the US dollar gets too strong, Hong Kong’s economy stays competitive by allowing wages and property prices to fall (internal adjustment). During the 1997 Asian Financial Crisis, Hong Kong residents accepted pay cuts and lower rents to stay afloat. Argentina had highly unionized labor and rigid laws that made wage cuts politically impossible. Since prices couldn’t fall internally to match the peg, the only remaining “escape valve” was to break the peg and let the currency crash.
The lesson is more precise: a peg without the fiscal discipline to sustain it is not a policy tool. It is a delay mechanism. It borrows time from the future to create the appearance of stability in the present. The longer the delay, the more compressed the eventual adjustment — and the more ordinary citizens bear the cost that the peg was designed to spare them.
George Soros understood this with crystalline clarity in 1992. The British pound was pegged to the European Exchange Rate Mechanism at a rate the UK economy could not support. Britain’s inflation was higher than Germany’s, its interest rates were constrained by the peg, and its economic conditions demanded lower rates that the peg wouldn’t allow. Soros borrowed pounds, shorted them against the deutschmark, and waited. When the peg broke — as economic mechanics demanded it must — he made roughly $1 billion in a single day. He did not discover a secret. He simply understood the underlying economics better than the people who set the exchange rate.
The asymmetry that pegged currencies create — false stability on the surface, accumulating tension beneath — is one of the most consistently investable phenomena in global markets. The signs are almost always visible before the break: widening trade deficits, dwindling foreign exchange reserves, a government increasingly reliant on borrowing to maintain the illusion of stability. The only question is timing, and timing is where the risk lies. Keynes famously noted that markets can remain irrational longer than you can remain solvent. In currency crises, they can also remain stable longer than the fundamentals suggest they should. But stable is not the same as sustainable.
IV. The Greatest Show on Wheels — Why Formula 1 Is One of the Most Misunderstood Business Empires on Earth
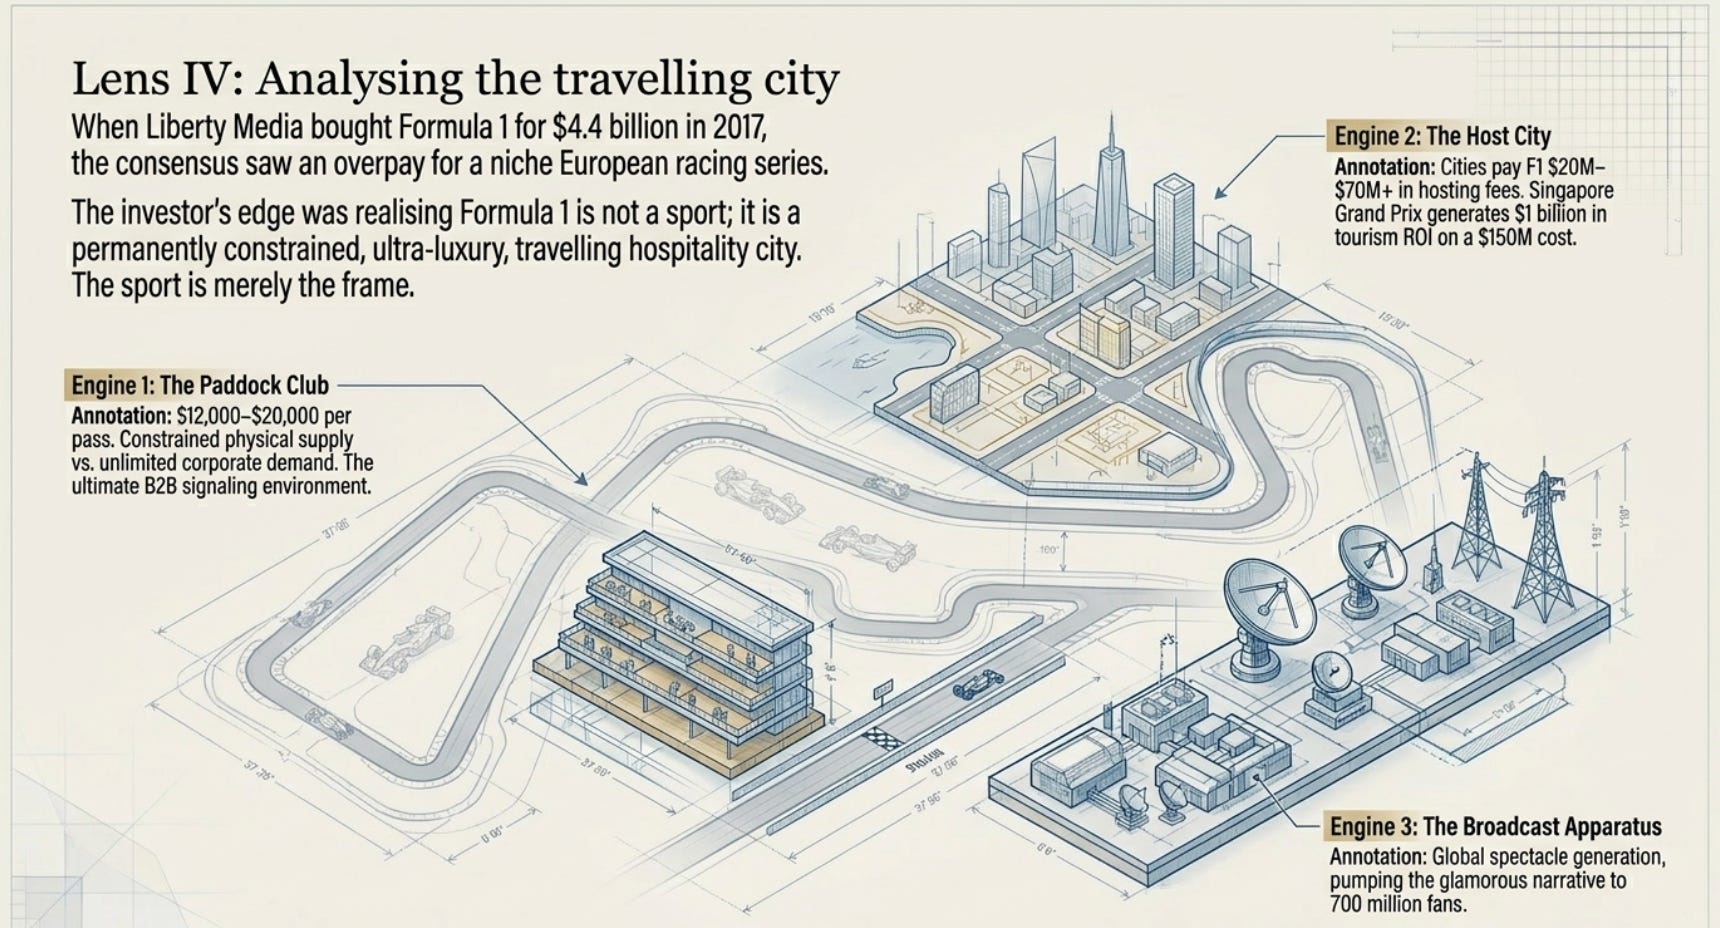
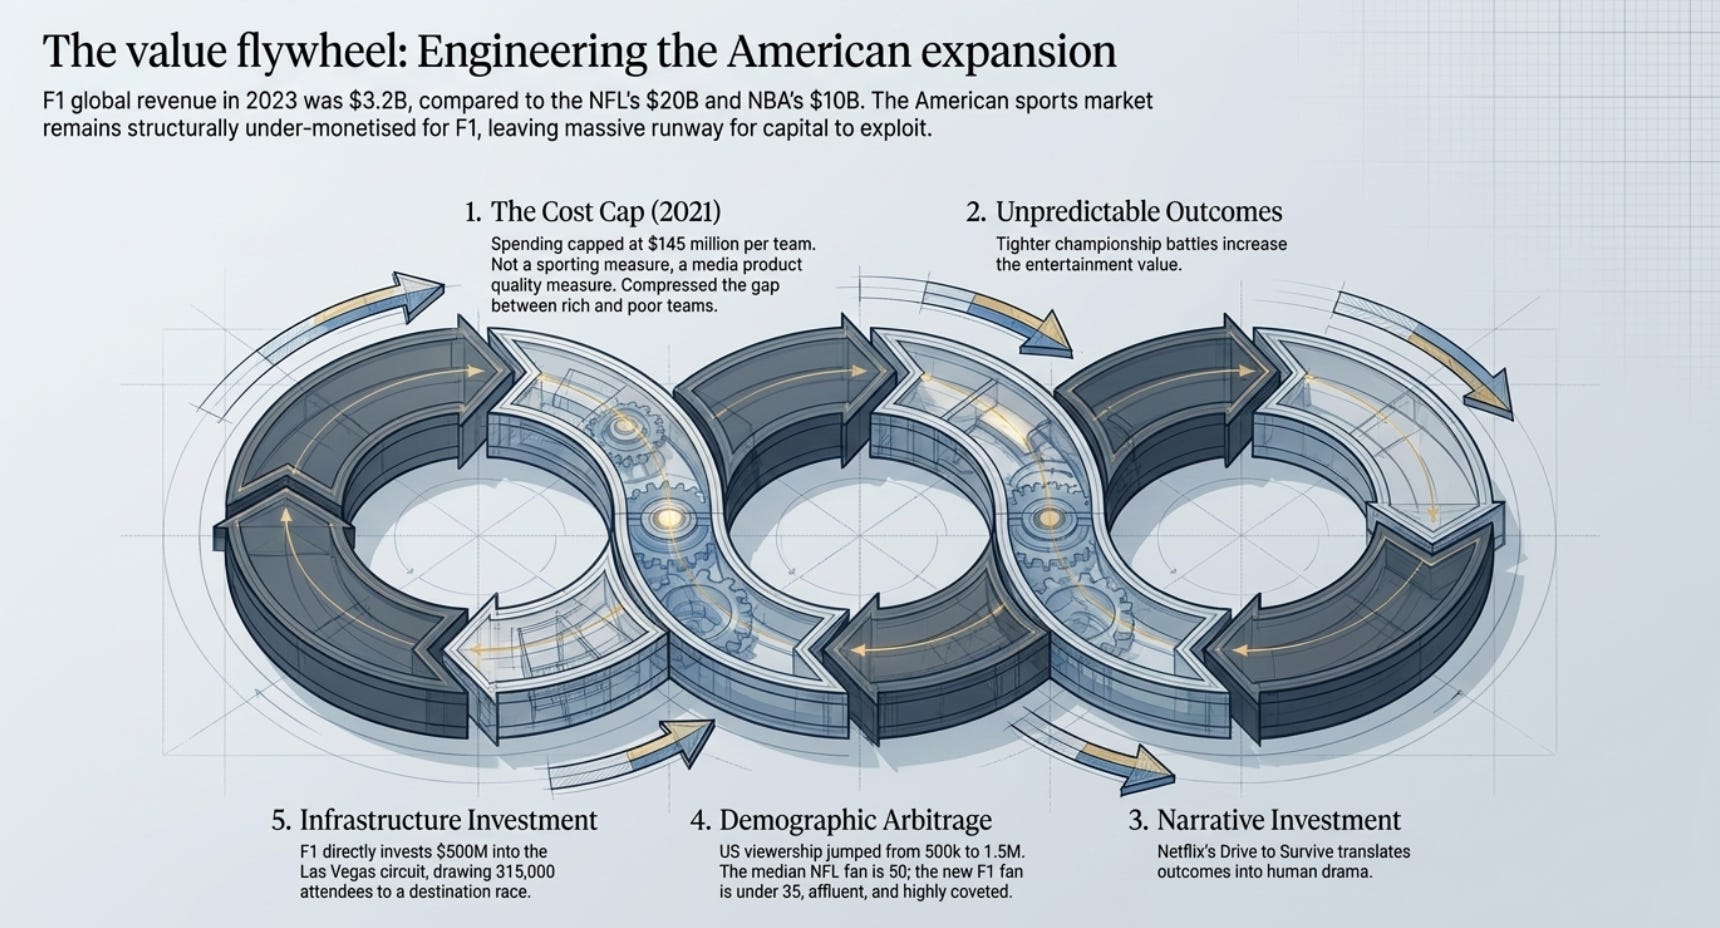
Formula 1 is often described as a sport, but from a strategic perspective, it is one of the most sophisticated business models in global entertainment. When Liberty Media acquired F1 for $4.4 billion in 2017, they weren’t just buying a racing series; they were buying a platform that effectively crowdsources its own Research & Development (R&D) and brand building.
The Ultimate Arbitrage: Outsourcing the R&D
The core of F1’s brilliance lies in its relationship with the 10 competing teams. In a traditional league like the NFL, the league office is responsible for much of the marketing and infrastructure. In F1, the teams—global giants like Mercedes, Ferrari, and McLaren—act as the sport’s primary “content creators” and “technology laboratories.”
R&D Subsidization: The teams collectively spend billions of dollars annually on engineering and innovation. F1 (the entity) does not pay to develop the cars; the teams do.
Brand Synergy: When Mercedes-Benz spends hundreds of millions to develop a world-beating engine, they are inadvertently building the “Formula 1” brand as the pinnacle of human achievement.
Asset-Light Model: Because the teams bear the cost of manufacturing, logistics for their own equipment, and staff salaries, Liberty Media operates an incredibly “lean” business. They own the IP and the broadcast rights without the heavy overhead of maintaining the “players” (the cars).
Minimal Capex, Maximum Growth
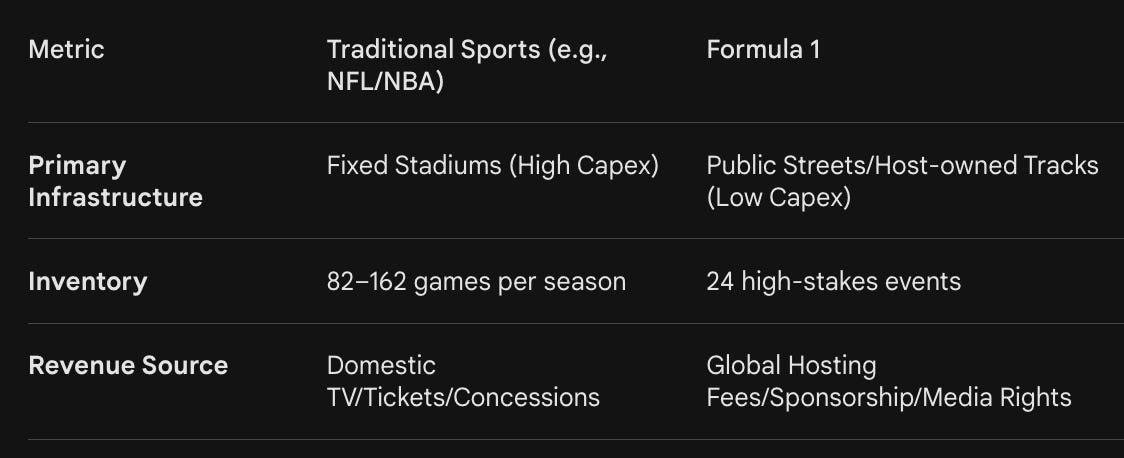
Relative to American sports leagues, F1’s growth requires remarkably little capital expenditure (Capex).
The “Stadium” Problem: An NFL or MLB team often requires a billion-dollar stadium, frequently subsidized by taxpayers or requiring heavy debt. F1, conversely, uses a “Traveling Circus” model.
Host-Funded Infrastructure: Host cities (like Silverstone) or governments (like Saudi Arabia or Singapore) pay F1 a “sanctioning fee” for the privilege of hosting. They also bear the cost of building or maintaining the circuit.
The American Exception: Las Vegas was a rare case where F1 invested $500 million of its own capital into land and a pit building. This was a strategic move to vertically integrate a “flagship” event, but the standard model remains: the host takes the risk, and F1 takes the fee.
The Sovereign Tailwinds
Why does a country like Qatar or Azerbaijan pay $50 million to $70 million annually just for a race? Because F1 provides a unique economic and diplomatic tailwind.
Urban Transformation: An F1 race acts as a 3-day global advertisement. For Singapore, the race is credited with generating over $1.5 billion in tourism receipts since its inception.
Soft Power: Hosting a Grand Prix signals that a city is a “Global Hub,” attracting high-net-worth individuals and corporate sponsors who might never attend a standard trade show.
Economic ROI: While the hosting fee is high, the influx of 300,000+ fans—who spend on hotels, flights, and dining—creates a massive multiplier effect for the local economy.
The Engineering Engine: Driving the World Economy
The “cool” factor of F1 isn’t just the speed; it’s that the sport pushes the boundaries of physics, which then trickles down into the broader industrial complex.
Thermal Efficiency: Modern F1 hybrid power units achieve over 50% thermal efficiency—a benchmark that was previously thought impossible for internal combustion engines. For context, most road cars hover around 30%.
Data and Simulation: F1 teams process millions of data points per second. The “Digital Twin” technology and simulation software developed by teams like McLaren are now used to optimize hospital traffic flows, improve 5G networks, and streamline pharmaceutical manufacturing.
Industrialization: The push for lighter, stronger materials (carbon fiber composites) and more efficient aerodynamics directly influences the aerospace and automotive industries, moving the global economy toward a more efficient future.
The Virtuous Cycle
By implementing a cost cap (currently around $135 million per team), Liberty Media has turned F1 teams from “money pits” into “profitable franchises.” This makes the teams more stable, the racing more competitive, and the brand more valuable. F1 provides the stage, the teams provide the multi-billion dollar tech, and the world watches as the “pinnacle of motorsport” dictates the future of global engineering. A true beauty to be admired.
V. Seeing What the Regulator Cannot — The Art of Asset Discrepancy Investing
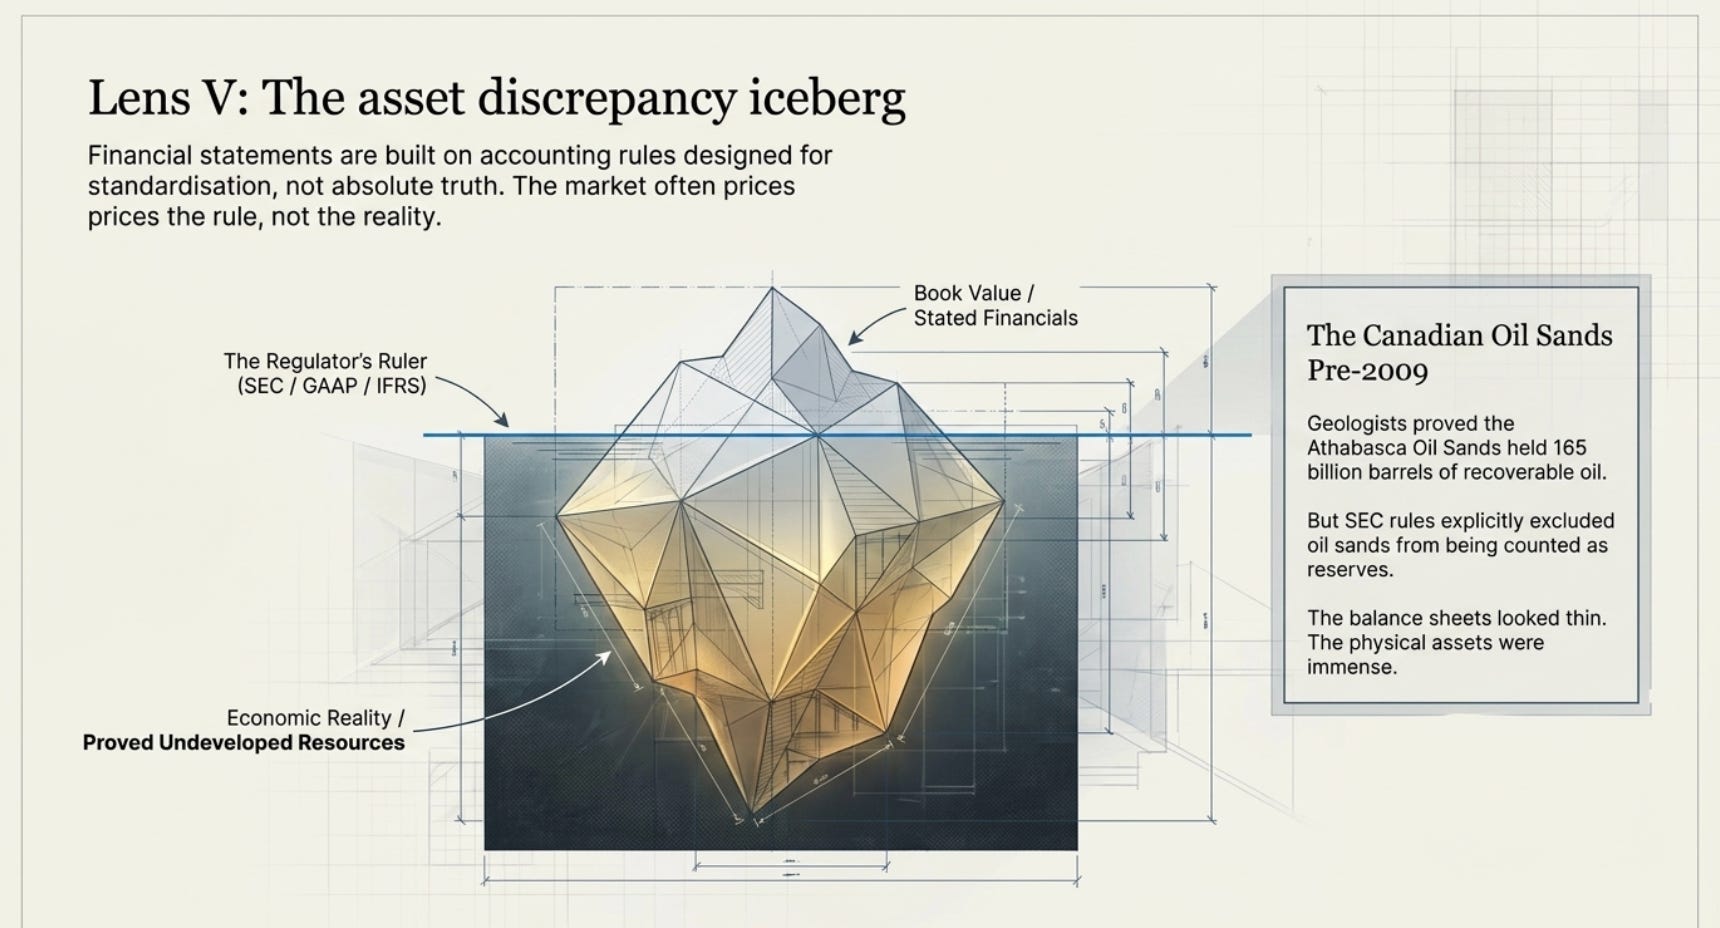
Imagine you are a geologist, and you have spent three months drilling test wells on a piece of land in Alberta, Canada. The results are unambiguous: there are hundreds of millions of barrels of oil beneath this ground. You have the data. You have the core samples. You can prove it. The oil is there.
Now imagine that the accounting rules used to put a value on this company’s oil in its financial statements say that this oil — because of the way it sits in the rock — cannot be counted as a formal “reserve.” The balance sheet looks thin. The market, reading the balance sheet, prices the company cheaply. But you, standing in the field with the data, know the economic reality is far richer than the financial statement suggests.
This is not a hypothetical. It is precisely the situation that faced investors in Canadian oil sands companies in the decades before 2009. And understanding why it happened — and how it resolves — is one of the most powerful analytical frameworks available to an investor who is willing to do the primary research.
The Gap Between the Regulator’s Ruler and the Industry’s Reality
The United States Securities and Exchange Commission governs how publicly listed oil and gas companies must report their reserves to investors. The intent is protective: by establishing standardized definitions, the SEC ensures that a company cannot claim to own reserves that it has not actually confirmed. This is sensible and necessary.
But standardized rules, applied to a world of enormous geological diversity and technological change, will always create a gap between what the rules measure and what economic reality contains.
Prior to 2009, the SEC’s proved reserves rules explicitly excluded “oil and gas producing activities from shale, tar sands, or coal.” Oil sands — the thick, viscous bitumen that must be dug from the earth rather than pumped — were simply off the table. Canadian companies like Suncor Energy and Canadian Natural Resources (CNRL) possessed what are among the largest hydrocarbon accumulations on earth — the Athabasca Oil Sands of Alberta contain an estimated 165 billion barrels of recoverable oil, the third-largest proved reserve base in the world — but could not book these reserves under SEC rules. Their US-listed financial statements showed a fraction of the economic reality. The assets were real. The SEC’s ruler simply couldn’t measure them.
Investors who understood this gap — who read not only the SEC filings but the technical resource assessments, who understood the mining and upgrading economics of oil sands production, who appreciated that at a sufficiently high oil price these resources were highly profitable to extract — were looking at companies whose true asset value was substantially in excess of what any conventional financial analysis would suggest.
In 2009, the SEC modernized its rules. The exclusion of oil sands and unconventional resources was removed. Companies were permitted to book proved reserves from shale, tight oil, and oil sands, provided those reserves met revised technical and economic feasibility criteria. Almost immediately, the balance sheets of companies with significant unconventional resource positions were transformed. Reserve tallies increased dramatically. Valuations adjusted upward. The gap between the regulator’s ruler and economic reality closed — and the investors who had recognized the gap before the rule change were paid very well for that insight.
The SEC also modernized its pricing methodology. Previously, companies had to use a single-day price (December 31st of the reporting year) to assess the economic feasibility of their reserves — which created wild swings in reported reserves based on where oil happened to be priced on one arbitrary day. The 2009 reforms replaced this with a 12-month average price, producing a more stable and economically meaningful measure. Again, investors who understood the distortion that the old methodology created, and who anticipated the direction of regulatory reform, had an informational edge.
The Framework — How to Find Asset Discrepancies Systematically
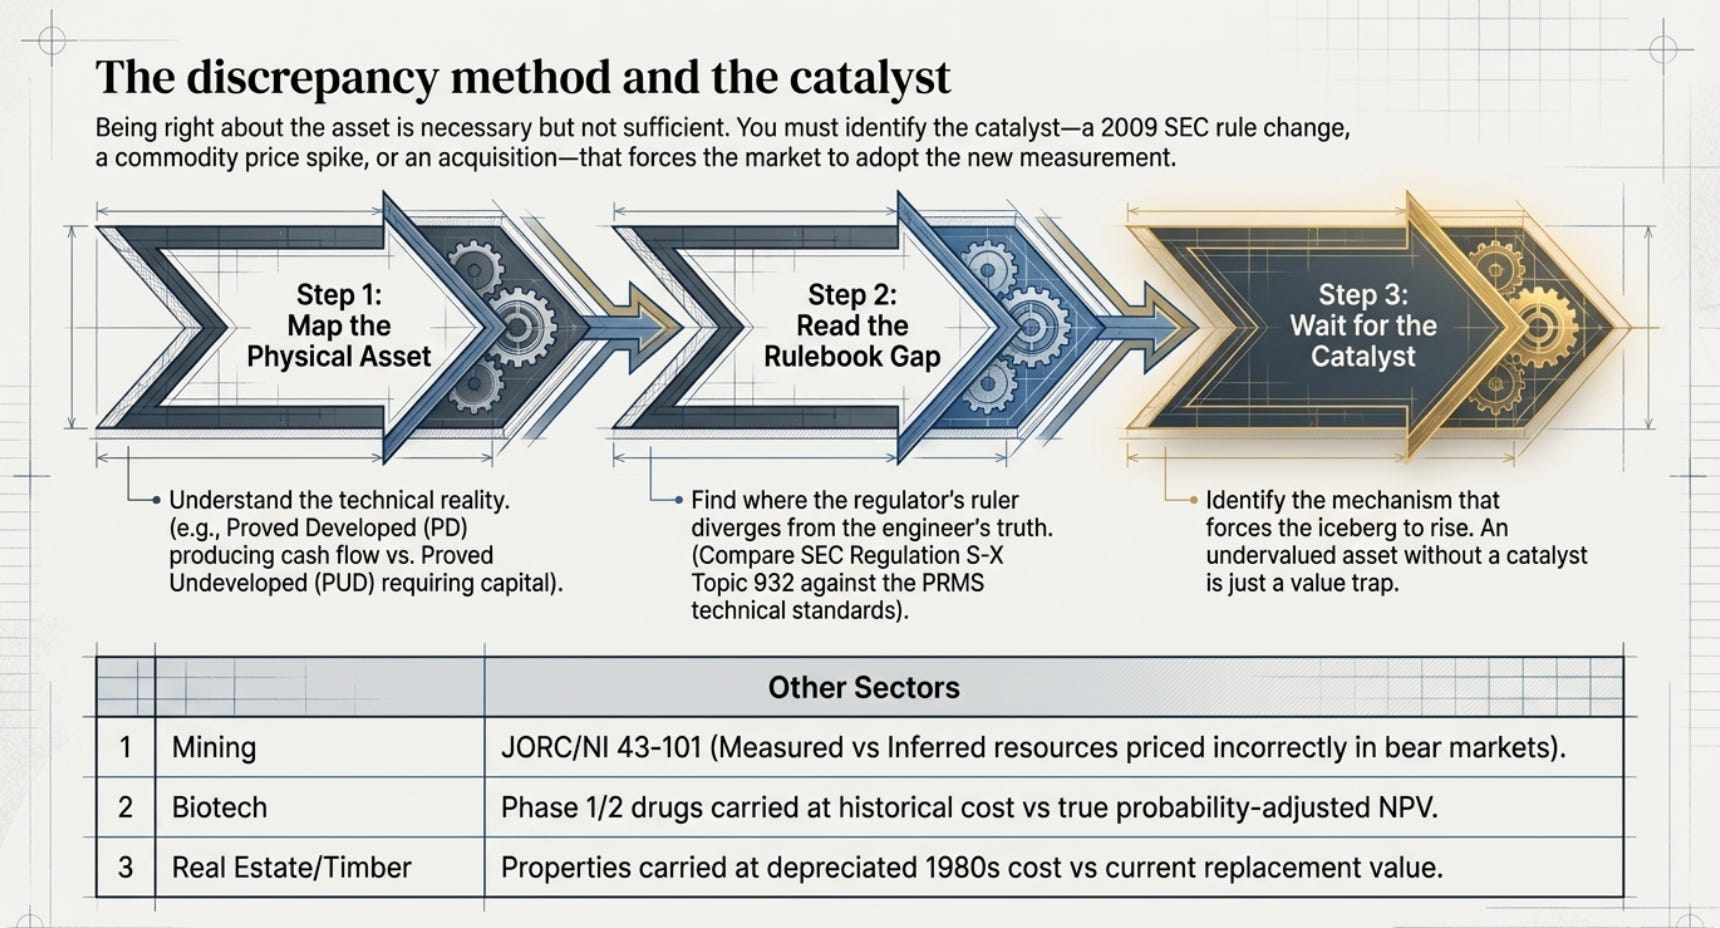
What the oil sands example illustrates is a general method, not a one-off insight. The method has three steps.
The first step is to understand the primary income-generating asset of a business at a technical level — not a financial statement level. In oil and gas, this means understanding what proved developed (PD) reserves actually are versus proved undeveloped (PUD) reserves. PD reserves are wells that are already drilled and producing cash flow today. PUD reserves are confirmed resources that would require additional capital investment to produce. These two categories look similar on a balance sheet summary but are economically very different. A PD reserve in a low-cost basin is essentially a bond — it will pay out at a predictable rate with known decline curves and already-sunk capital costs. A PUD reserve is closer to an option — it has value, but only if you have the capital, the intention, and the economic conditions to develop it. The market frequently does not price this distinction correctly, especially in commodity downturns when negative sentiment obscures the value of productive assets underneath the noise.
The second step is to understand how the SEC or the relevant regulatory body requires those assets to be reported, and where the reporting methodology diverges from economic reality. This requires reading the actual regulatory framework — not just the financial statements that result from it. The SEC’s Regulation S-X, Topic 932, and related staff guidance for oil and gas producers is publicly available. The Society of Petroleum Engineers’ Petroleum Resources Management System (PRMS) represents the industry’s own technical standards for resource classification. Reading both — and comparing them — reveals where the financial statement understates or overstates the economic position.
The third step is to wait, with patience, for the catalyst. This is the most critical qualifier of the entire framework, and it cannot be skipped. An undervalued asset that stays undervalued forever is not an investment opportunity — it is a value trap. The asset discrepancy framework only generates returns when something closes the gap: a rise in commodity prices that makes previously marginal reserves highly profitable, a regulatory change that allows previously excluded assets to be formally recognized, a merger or acquisition by a private buyer who can value the assets correctly because they are not constrained by public market accounting, or a supply shock that forces the market to re-evaluate asset quality.
The Broader Application — Other Sectors Where the Gap Exists
This is not an oil-specific insight. The mechanism — regulatory accounting diverging from economic reality in ways that create systematic mispricing — exists in every capital-intensive industry.
In mining, National Instrument 43-101 (Canada) and the JORC Code (Australia) set standards for mineral resource disclosure. The technical categories — measured, indicated, inferred resources — each carry different confidence levels and are valued very differently by the market. But the market’s discount rate applied to “inferred” resources often swings wildly with commodity sentiment rather than with changes in the actual geological confidence. During bear markets in base metals, companies whose measured and indicated resources are trading at fractions of their technical net present value have historically offered extraordinary returns to investors with the patience and analytical rigor to recognize the gap.
In pharmaceuticals, drug pipeline assets at Phase 1 and Phase 2 clinical stages are carried on balance sheets at their historical cost — the actual cash spent on research. Their economic value, assessed by probability-adjusted NPV models using clinical success rates and expected market sizes, can be dramatically higher or lower than book value depending on the specific asset. Biotech investors who can read clinical trial data and correctly assess the probability of approval have an edge that is not reflected in the accounting.
In real estate, particularly in jurisdictions where book value accounting rules are stringent, properties are often carried at historical cost decades after market values have shifted dramatically. A hotel chain that built properties in a city in 1980 and carries them at depreciated historical cost may have balance sheet real estate values that represent a small fraction of current replacement cost or market value. This is less true in IFRS jurisdictions (where fair value accounting is common) but highly relevant in US GAAP contexts.
In timber, timberland REITs present a particularly clean example. The value of standing timber (the actual trees, which grow in value as they grow in size) is often carried at a conservative cost basis rather than current market value. Investors who track stumpage prices and timber inventory appraisals independently of what the financial statements show have repeatedly found opportunities where the underlying asset value far exceeds the public market valuation of the entity that owns it.
The Synthesis — Why This Belongs in an Investment Framework
The underlying reason this framework works — when it works — is that public market valuations are built primarily on financial statements, and financial statements are built on accounting rules, and accounting rules are not designed to reflect economic reality with perfect accuracy. They are designed to provide consistent, auditable, comparable disclosures that serve a regulatory function. These are different objectives. The gap between the regulatory function and the economic reality is where the investor who does primary research — who reads the industry’s own valuation standards, who talks to geologists and engineers and operators, who understands what the asset actually does and what it is actually worth in the hands of someone who can operate it correctly — lives.
The crucial final point is this: being right about the asset is necessary but not sufficient. You also need to be right about the catalyst, or at minimum right that one will arrive within a reasonable investment horizon. A barrel of oil in the ground that will never be produced at a profit is worth nothing regardless of what the technical report says. The supply shock, the regulatory change, the acquisition, the commodity price recovery — these are what converts the analytical insight into actual returns. The asset discrepancy is the reason to invest. The catalyst is the mechanism of return. Both must be present, or you are waiting at a station where no train will come.
This is the edge. Not genius. Not luck. Just the willingness to look beneath the financial statement to the economic reality underneath it, and to understand — precisely — how and why the market’s measuring stick is producing the wrong number.