
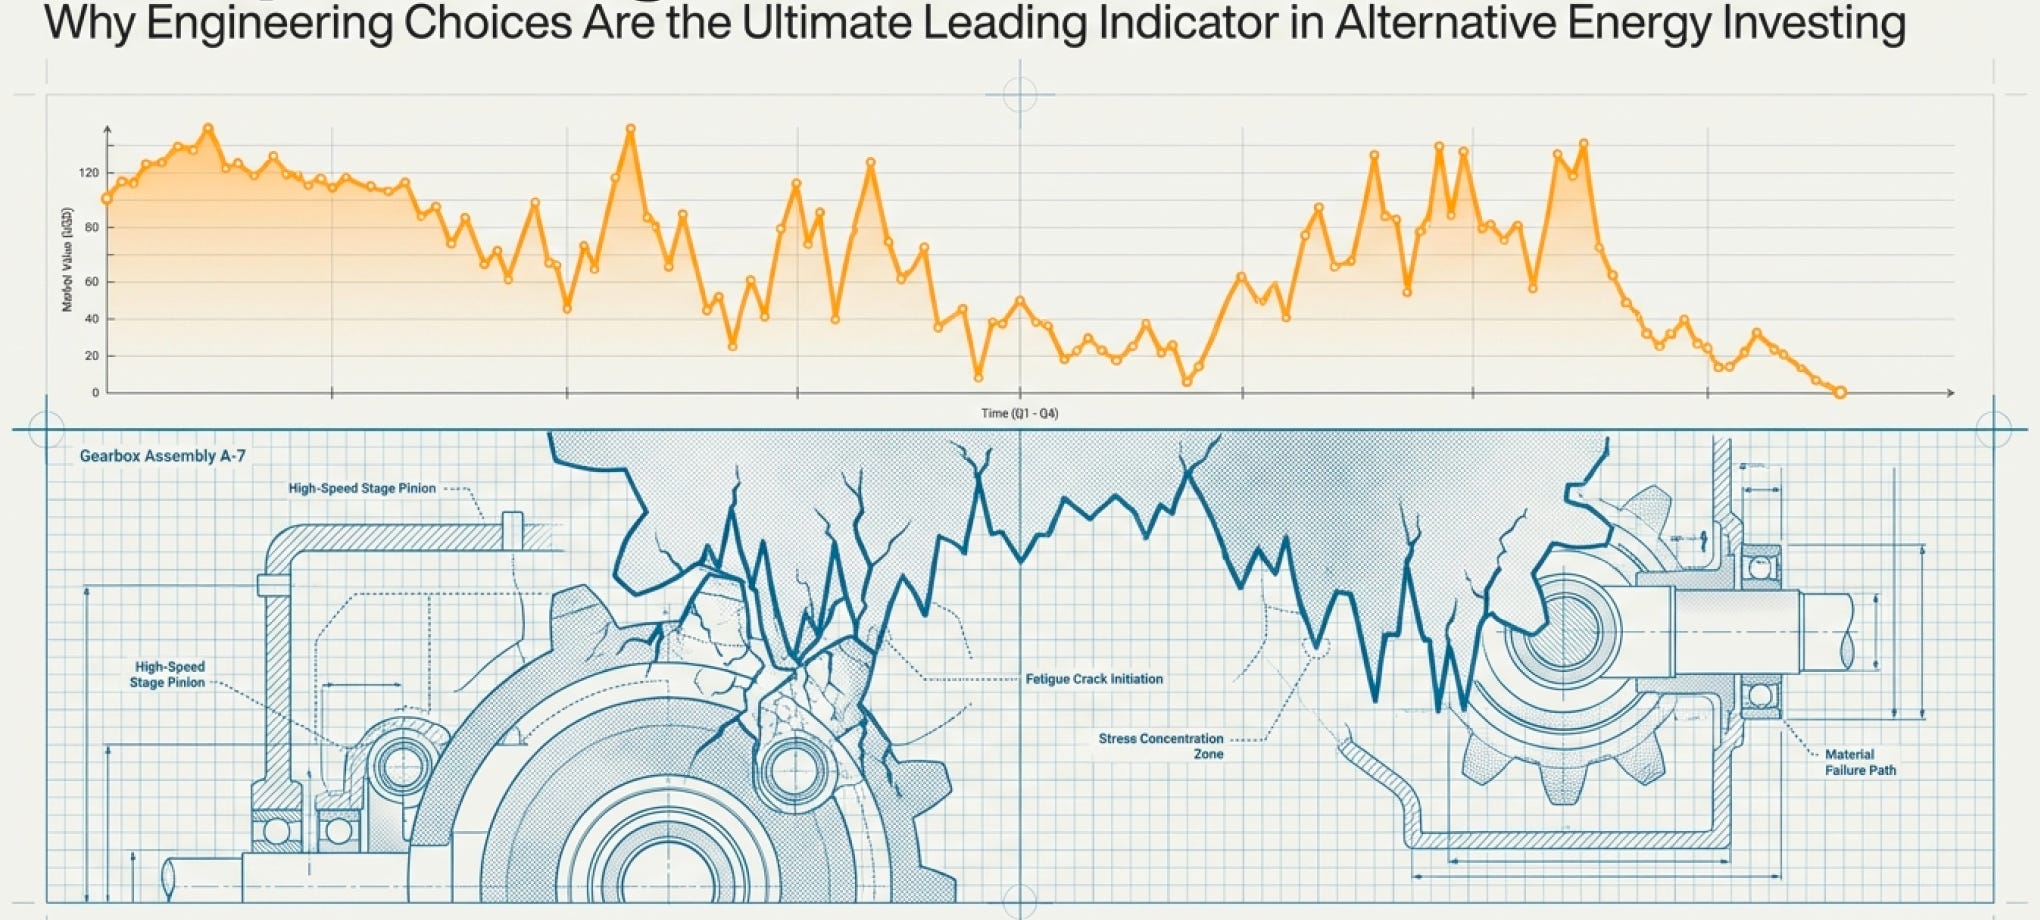
The €2.2 Billion Mistake That Revealed Everything
In 2023, Siemens Gamesa discovered something that should have terrified every infrastructure investor: their offshore wind turbines had a serial defect. Blades were cracking. Bearings were failing prematurely. The entire fleet needed inspection and repair.
The charges? €2.2 billion.
The parent company, Siemens Energy, faced losses approaching €5 billion. The CEO acknowledged that turbines were “not sufficiently tested.” The stock collapsed. Executives were fired. The company that had pioneered offshore wind technology was suddenly fighting for survival.
Now here’s what makes this interesting: The defect wasn’t in some exotic new technology. It was in the gearbox—a component that’s been in wind turbines since the 1980s. A three-stage planetary gearbox, the industry standard, the type of system that thousands of turbines had used successfully for decades.
Except when you scale from 3 MW turbines to 8-15 MW turbines, everything changes. The torque forces increase. The bearing loads multiply. The thermal stresses compound. What worked reliably at small scale became a ticking time bomb at large scale.
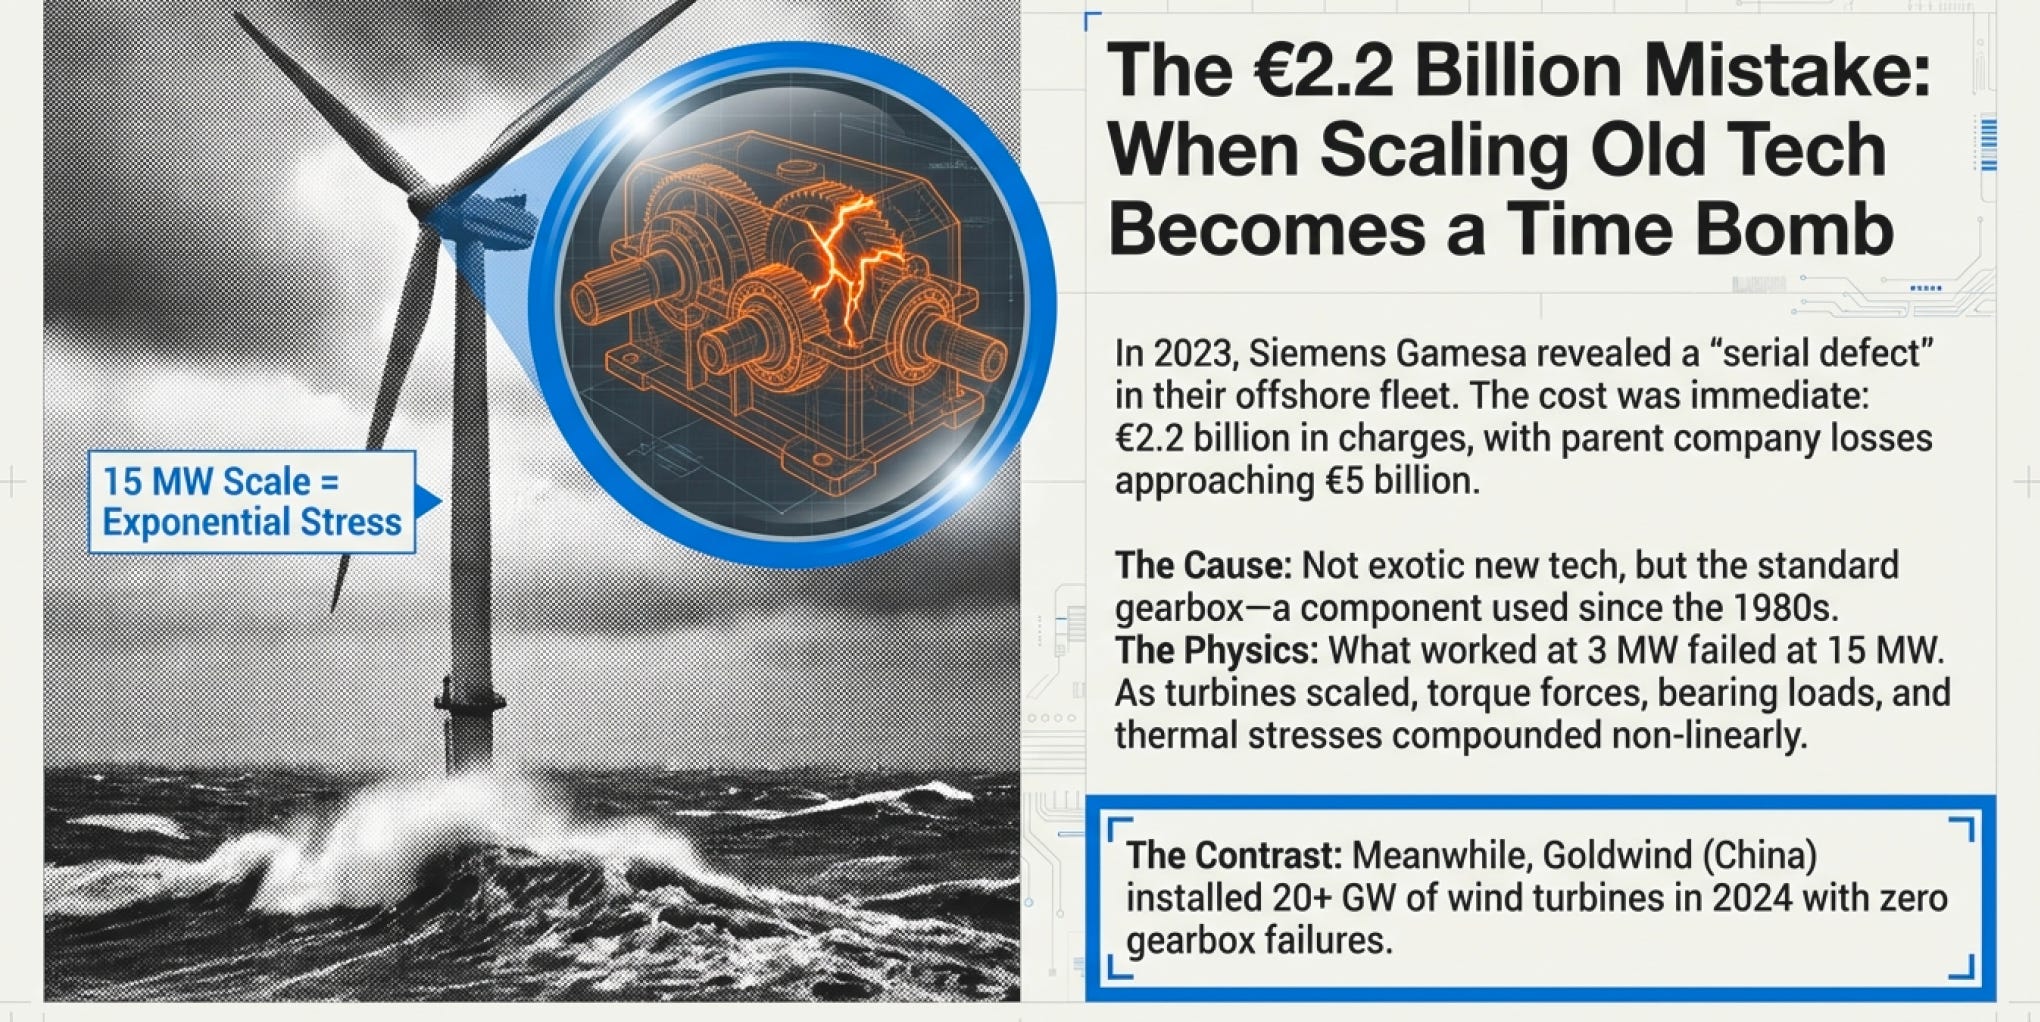
Meanwhile, 6,000 miles east in Xinjiang, Goldwind was installing their 20+ GW of wind turbines in 2024 with a completely different technology: permanent magnet direct-drive (PMDD). No gearbox at all. Just one main bearing connecting the blades directly to the generator.
Goldwind’s turbines didn’t have Siemens’s problem. Because they didn’t have gearboxes to fail.
This isn’t a story about one company making a mistake. This is a story about how technical choices made a decade ago determine who survives today—and how the engineering details that seem boring to most investors create the durable advantages that actually matter.
Let me show you why.
When German Engineering Met Chinese Manufacturing—And Changed Everything
Let’s rewind to 2008, because this is where the technical choices that dominate today’s wind market were made.
Vestas, Siemens, GE—all the Western manufacturers—had settled on a standard architecture: three-stage gearbox with doubly-fed induction generator (DFIG). The rotor spins at 10-20 RPM. The gearbox steps that up to 1,500-1,800 RPM. The generator converts the high-speed rotation into electricity.
This architecture had advantages: The generator could be relatively small and light because it operated at high speed. High-speed generators are much cheaper to manufacture than low-speed ones. The gearbox added cost, but the generator savings more than compensated.
One problem: Gearboxes are mechanical complexity incarnate.
A typical three-stage planetary gearbox contains roughly 1,000 moving parts. Gears meshing at high loads. Bearings under enormous stress. Seals trying to contain lubricants. Each component a potential failure point.
Research from offshore wind operators showed that gearbox failures caused the longest downtime of any major component—averaging 5-7 days per failure because you need a heavy-lift vessel, specialized technicians, and favorable weather. In the harsh offshore environment, gearboxes were failing at rates 2-3x higher than expected.
Wind turbulence creates enormous stress on gearbox internals. The torque isn’t constant—it varies with wind gusts, creating fatigue cycles that exceed design assumptions. As turbines scaled up, the problem compounded because torque scales with rotor diameter squared. A turbine with 2x the diameter has 4x the torque.
Enter German manufacturer Vensys with a radical alternative: permanent magnet direct-drive (PMDD).
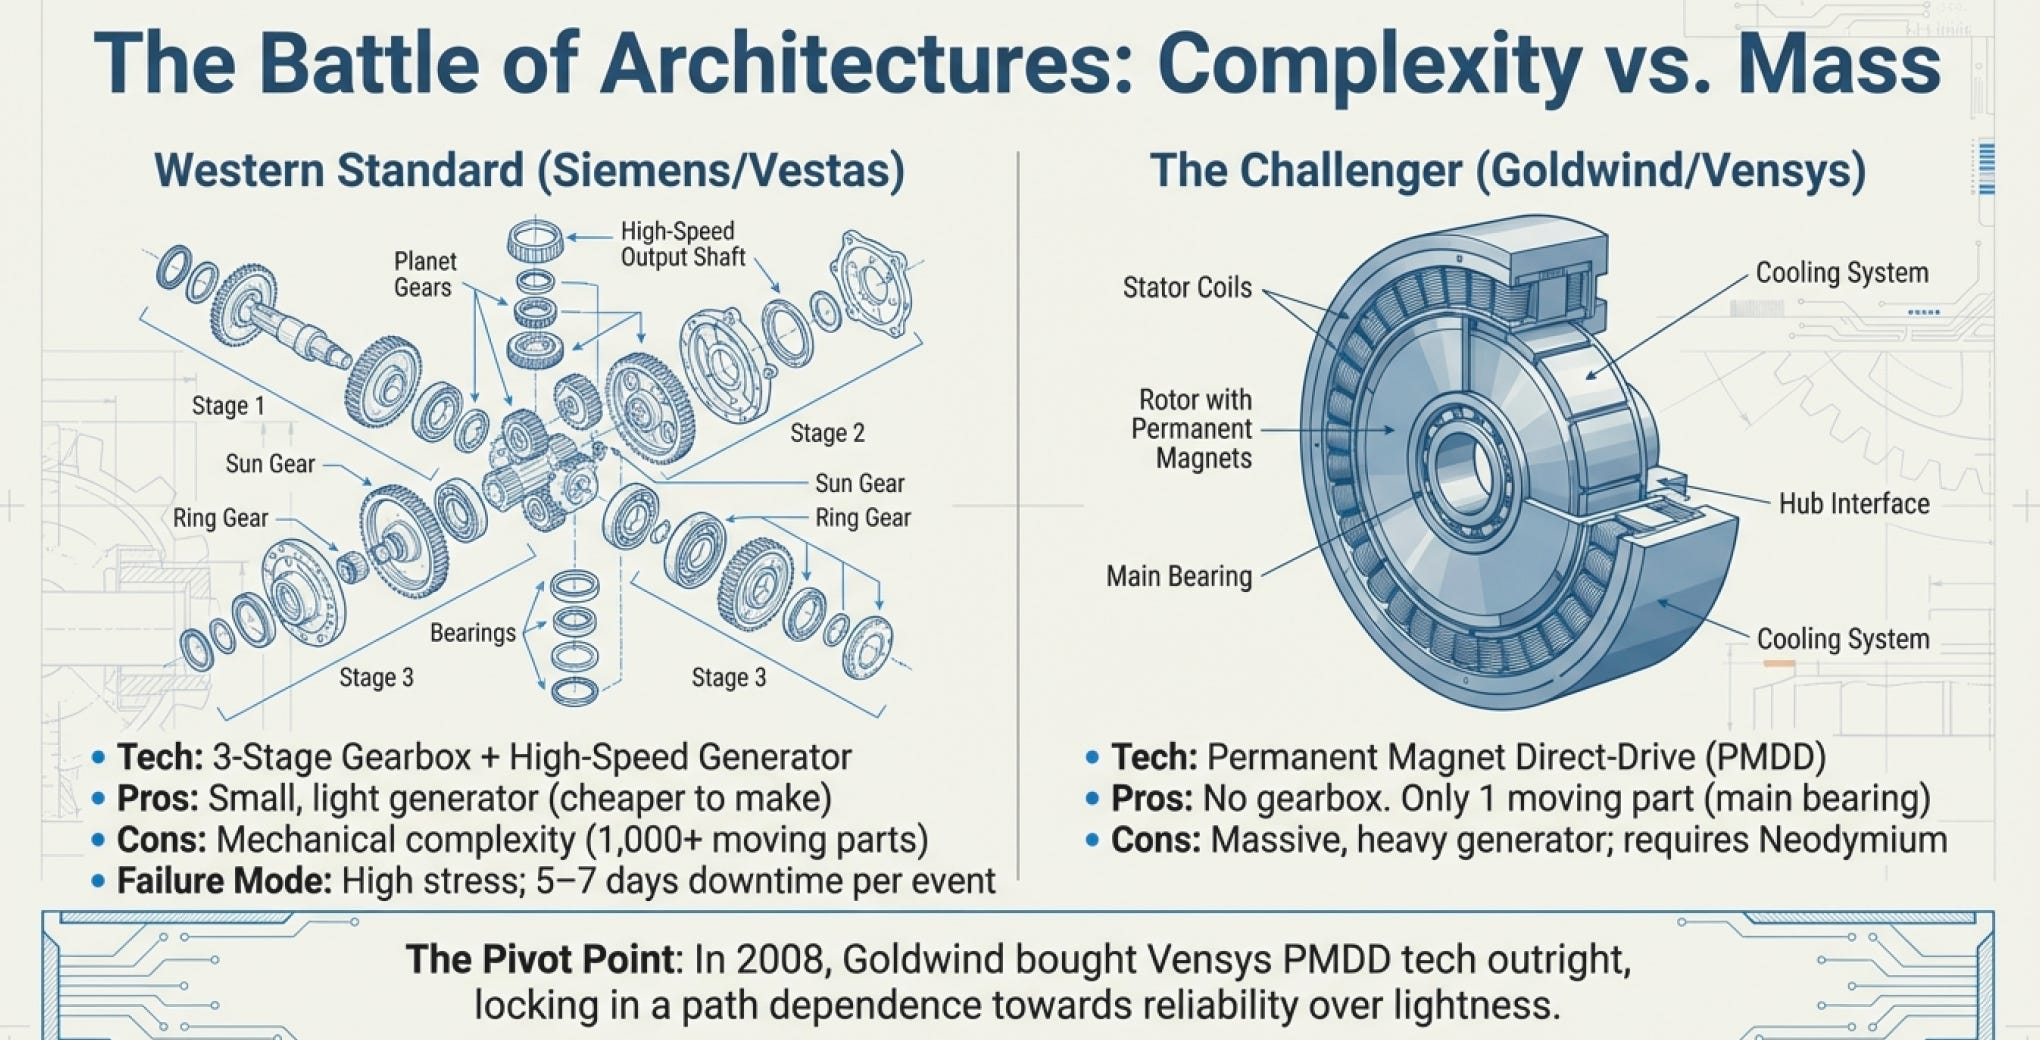
No gearbox. The rotor connects directly to the generator. The generator spins at the same slow 10-20 RPM as the rotor, so it needs to be much larger—picture a donut-shaped generator 10+ meters in diameter with hundreds of permanent magnets around the rim.
In 2008, Goldwind bought this technology outright from Vensys. Not licensed it. Bought it. Permanently.
Why did PMDD matter? Let me count the ways:
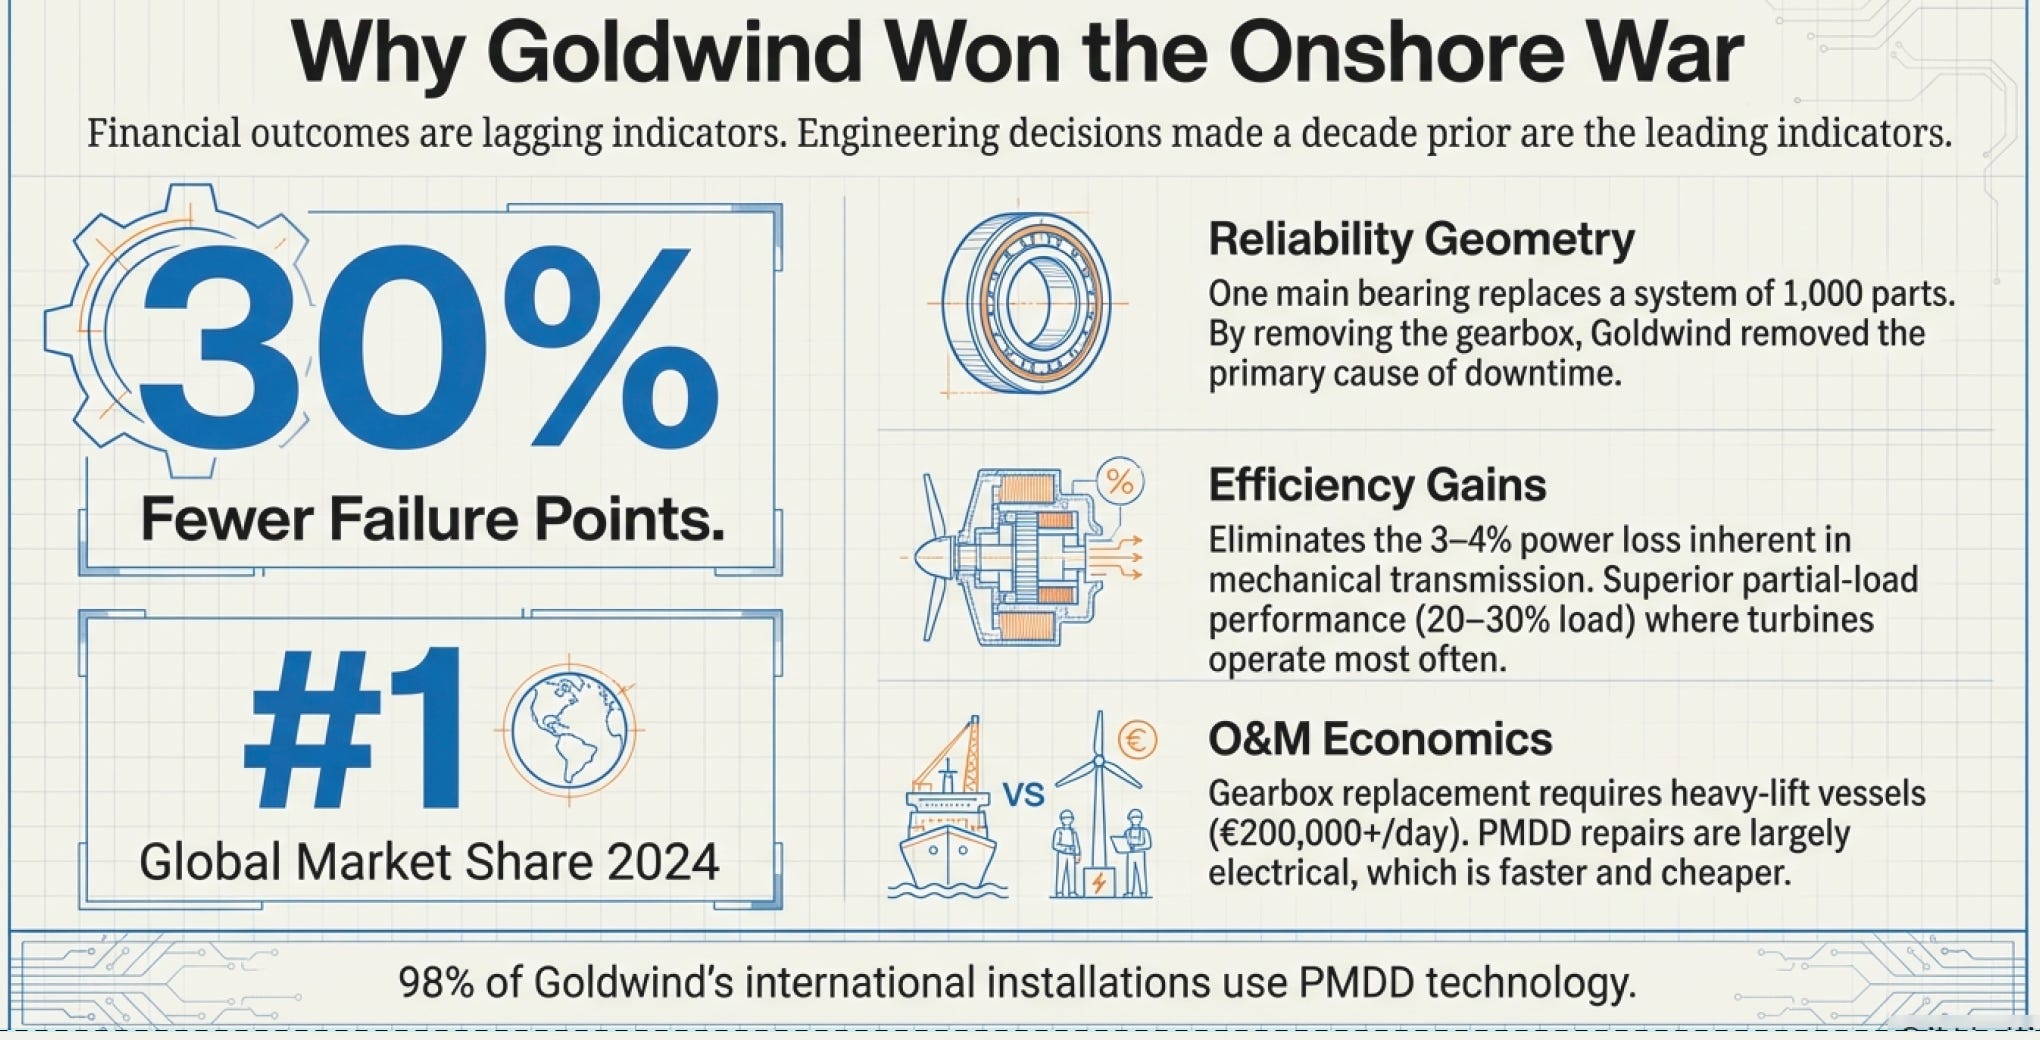
30% fewer failure points. One main bearing instead of gearbox with 1,000 moving parts. Offshore research showed direct-drive PMG configurations had the lowest O&M costs across all wind farm distances.
3-4% higher efficiency. Gearbox drives lose 3-4% of generated power in mechanical transmission. Direct drive eliminates this loss entirely.
Better partial-load performance. Wind turbines operate at partial load (less than rated capacity) most of the time due to wind variability. Permanent magnet generators maintain near-nominal efficiency even at 20-30% load. Gearbox-drive systems lose more efficiency at partial loads.
Lower maintenance. Gearbox replacement requires heavy-lift vessels costing €200,000+ per day. Direct-drive systems need power converter repairs (much cheaper and faster) when they fail.
Quieter operation. No gearbox meshing means significantly reduced mechanical noise—important for onshore turbines near residential areas.
The trade-offs? PMDD generators are much larger and heavier. They require significantly more rare earth materials (neodymium, dysprosium). They’re more expensive to manufacture. And when you scale to 7-10 MW and beyond, the generator becomes so massive that a single or two-stage gearbox actually becomes lighter and cheaper than pure direct-drive.
This created a fascinating split in the market:
Goldwind doubled down on PMDD for onshore turbines where weight is less critical and maintenance costs dominate economics. By 2024, they’re the world’s #1 turbine manufacturer with 20+ GW installed, and 98% of their international installations use PMDD technology.
Western manufacturers stuck with gearbox designs because their engineering infrastructure, supply chains, and expertise were built around that architecture. Siemens Gamesa, Vestas, GE Vernova—all use multi-stage gearboxes in most designs.
The hybrid approach emerged for offshore: MingYang, Goldwind, and others developed single or two-stage gearbox systems with permanent magnet generators—combining some weight savings from a lighter gearbox with some reliability benefits from fewer gear stages.
Now here’s the investment insight: Goldwind’s 2008 purchase of PMDD technology created a 20-year competitive advantage that’s still playing out today. Every turbine they install builds expertise in direct-drive systems. Every failure mode they encounter and solve makes their designs more robust. Every engineer they train in PMDD technology strengthens their moat.
Meanwhile, Siemens just took a €2.2 billion charge on gearbox failures.
Technical choices compound. Always.
The Chemistry Lesson That Explains Why Tesla Lost
Now let’s talk about batteries, because this is where chemistry determines economics in ways most people miss entirely.
In 2020, BYD unveiled their Blade Battery at a press conference. Wang Chuanfu—the former orphan turned CEO—said something provocative: “The Blade Battery has passed the most rigorous test in the battery industry—the nail penetration test.”
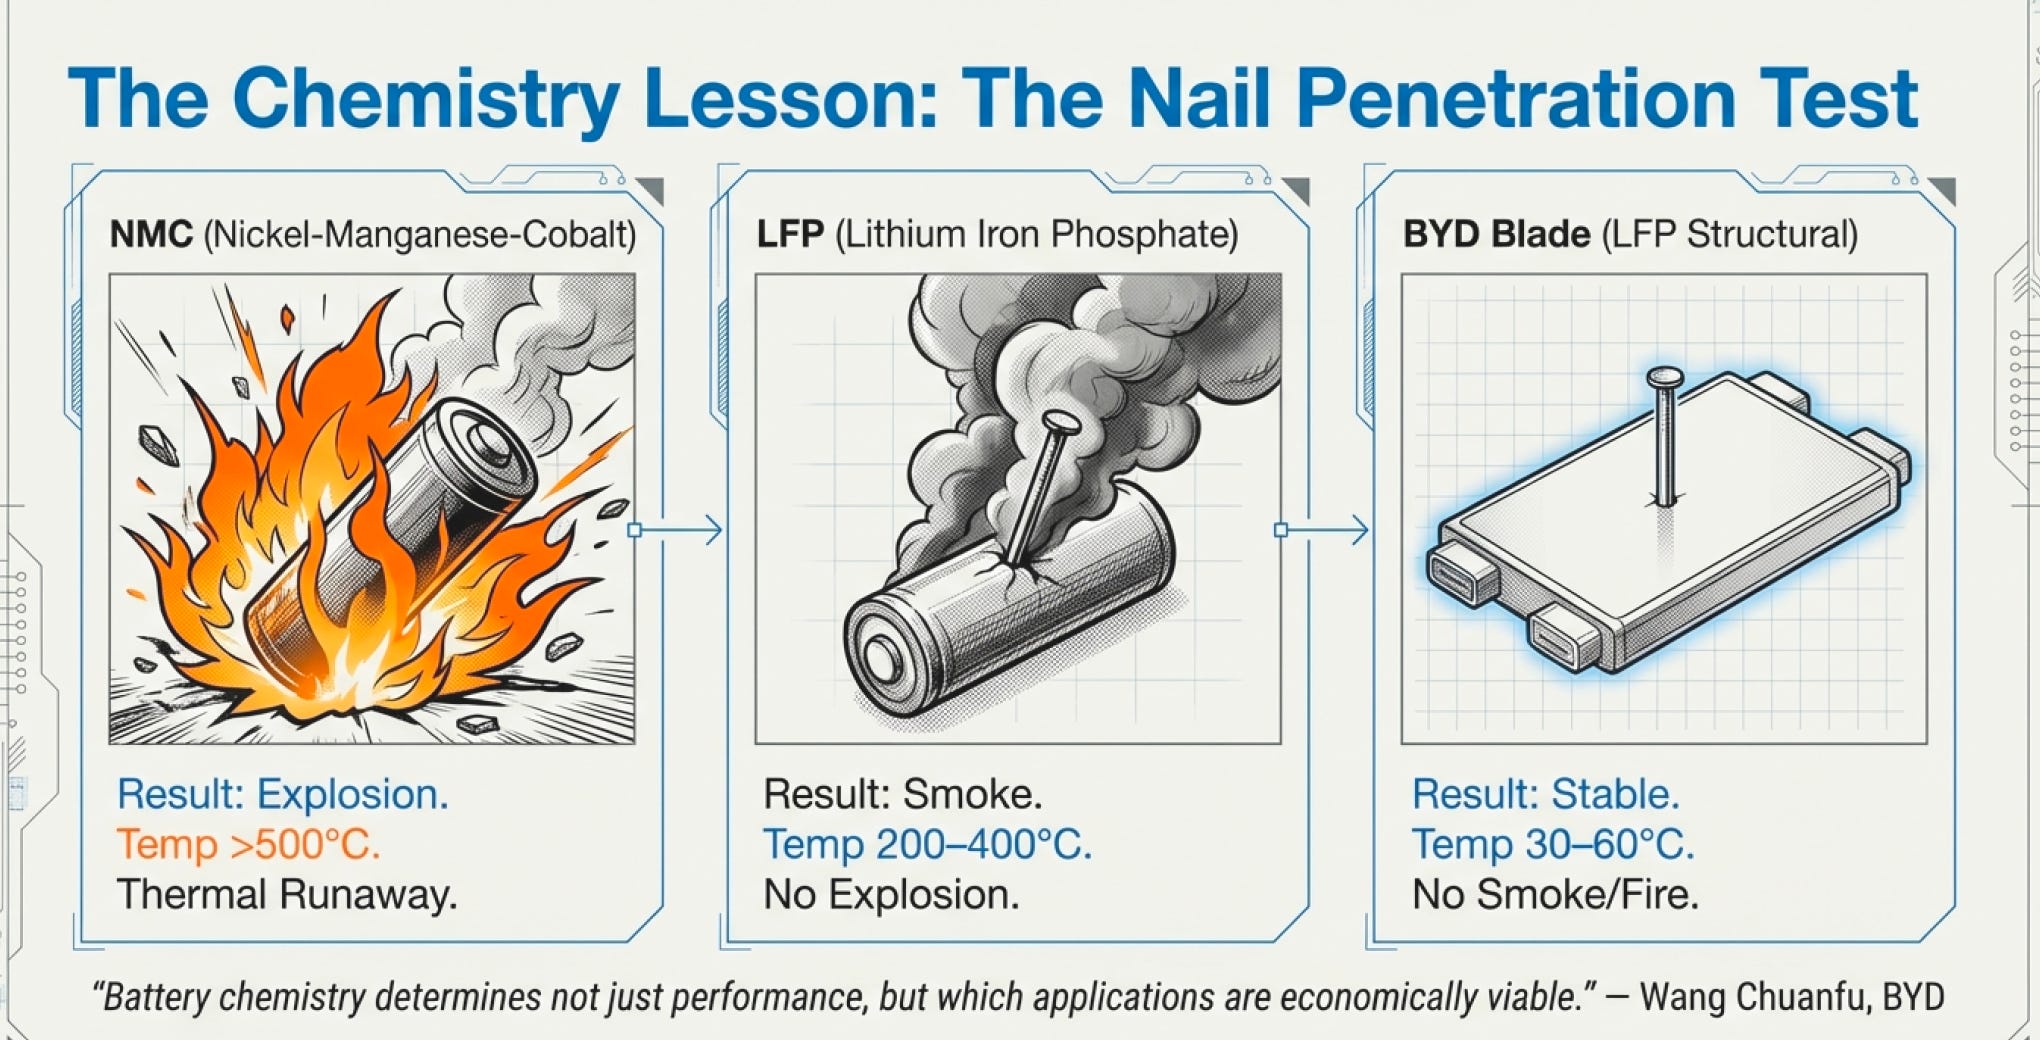
Then they showed a video.
Three battery packs: one nickel-manganese-cobalt (NMC), one traditional lithium iron phosphate (LFP), one BYD Blade Battery. All three get a steel nail driven through them, creating an internal short circuit.
The NMC battery explodes violently—flames shooting meters high, temperature exceeding 500°C.
The traditional LFP battery smokes heavily—no explosion, but surface temperature hits 200-400°C.
The Blade Battery? Surface temperature rises to 30-60°C. No smoke. No fire. No flames.
The video went viral. But here’s what it actually revealed: Battery chemistry determines not just performance, but which applications are economically viable.
Let me explain.
The Energy Density Trap
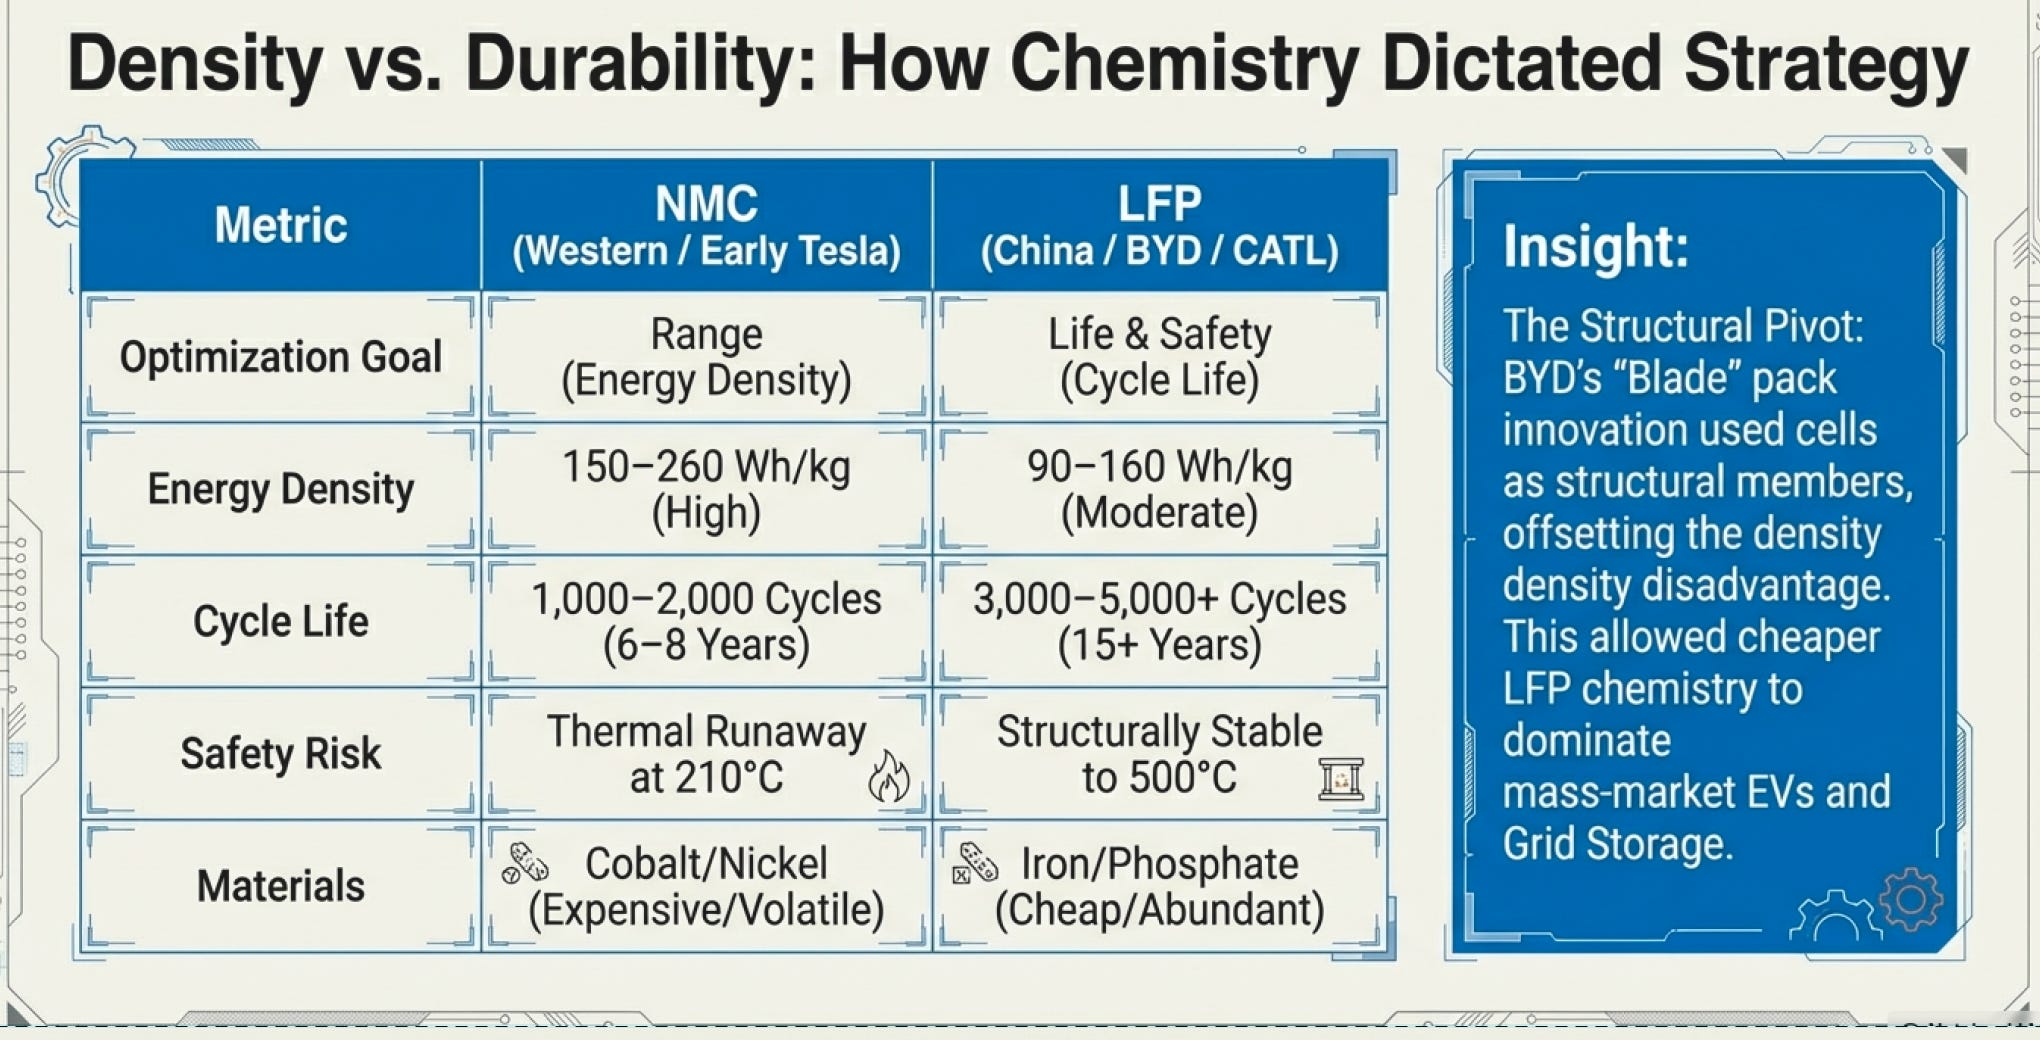
NMC batteries use nickel, manganese, and cobalt as cathode materials. The combination is brilliant: nickel provides high capacity (energy density), manganese adds structural stability, cobalt improves conductivity and cycle life.
The numbers: 150-260 Wh/kg energy density. Compare to LFP at 90-160 Wh/kg, and you see why NMC dominated early EVs. When battery packs cost $800-1,000/kWh in 2010, every kilogram mattered. Higher energy density meant less weight, more range, better performance.
Tesla built their entire early advantage on NMC batteries from Panasonic. The Model S used NMC 8-1-1 (80% nickel, 10% manganese, 10% cobalt)—absolutely maximizing energy density to achieve 400+ mile range.
But NMC has problems:
Thermal runaway at 200-210°C. When NMC batteries overheat, the cathode structure becomes unstable. Oxygen releases from the cathode material. That oxygen feeds the fire, creating a self-sustaining combustion that’s nearly impossible to extinguish.
Short cycle life: 1,000-2,000 full cycles before degradation to 80% capacity. For most consumer use (charging once every week or two), this translates to 6-8 years of lifespan. For high-usage applications like commercial fleets, it’s much shorter.
Cobalt dependency. Cobalt costs $30-40/kg and comes primarily from the Democratic Republic of Congo with well-documented ethical concerns. Supply is constrained. Prices are volatile.
Expensive: $100-150/kWh (2024 prices).
The LFP Revelation
LFP batteries use lithium iron phosphate (LiFePO₄) as the cathode. Much simpler chemistry. No cobalt. No nickel. Just iron and phosphate—abundant, cheap, environmentally benign.
The breakthrough: The iron-phosphate cathode is structurally stable even at extreme temperatures. The covalent bonds don’t break down until 400-500°C. Thermal runaway is ~80% less likely than NMC.
Cycle life: 3,000-5,000 full cycles (some manufacturers claim up to 9,000 in ideal conditions). That’s 12+ years for daily cycling applications. For grid storage or commercial vehicles, LFP is essentially required because you’re doing multiple cycles per day.
Cost: $70-100/kWh (2024 prices)—30-40% cheaper than NMC.
Safety. LFP can be charged to 100% daily without degradation concerns. NMC should ideally stay between 20-80% to maximize lifespan.
The trade-off? Lower energy density: 90-160 Wh/kg—about 40% less than NMC. For EVs requiring maximum range, this matters. For stationary storage where weight is irrelevant, it doesn’t matter at all.
And here’s where the chemistry determines the competitive landscape:
BYD chose LFP for everything. Their Blade Battery is LFP cells arranged in a structural pack (the cells themselves are structural members, eliminating separate framing). They gave up some energy density but gained:
Safety margins allowing tighter cell packing (offsetting some density loss)
Ability to charge to 100% without degradation
Lower costs enabling cheaper vehicles
Longer lifespan for commercial/fleet applications
By 2024, BYD delivers 2.6 million vehicles annually versus Tesla’s 985,000. BYD’s cost structure allows them to profitably sell $10,000-15,000 EVs that Tesla can’t match. The chemistry choice enabled the business model.
CATL offers both—but LFP dominates their growth. Their market position (37.9% of global EV batteries) comes from optimizing for different use cases:
NMC for premium EVs where range is paramount (Tesla Model S, BMW, Mercedes)
LFP for volume EVs and storage where cost and longevity matter more
Grid storage went 70%+ LFP by 2024 specifically because cycle life and safety matter more than energy density. When your battery installation costs $200-300/kWh including installation, you want it lasting 15+ years, not 8.
Now here’s the technical insight that determines competitive outcomes: Chemistry advantages compound through manufacturing scale.
China produces 95%+ of global LFP cathode materials. The entire supply chain—from lithium mining to cell manufacturing—is optimized for LFP. When CATL or BYD order LFP materials, they get better prices, faster delivery, and tighter quality control than Western manufacturers starting LFP programs.
Western manufacturers (LG Energy Solution, Samsung SDI, Panasonic) built their infrastructure around NMC. Switching to LFP requires:
New cathode material supply chains
Different cell manufacturing processes
Requalification testing for automotive applications
New battery management system software
It’s doable—but it takes 3-5 years and billions in investment. Meanwhile, Chinese manufacturers improve their LFP technology daily with 60% of the global EV market providing real-world testing data.
Technical lock-in isn’t about patents or secrets—it’s about 10,000 engineers working on LFP optimization versus 1,000 engineers starting from scratch.
Tesla’s response? They finally switched Model 3 Standard Range to LFP in 2021—batteries supplied by CATL. But by then, BYD had a 5-year head start vertically integrating LFP production.
When Physics Meets Economics: The Solar Panel Architecture Wars
Now let’s talk about solar, because this is where material science creates unexpected competitive moats.
Everyone knows Chinese manufacturers dominate solar panels—but why they dominate reveals which technical choices matter for infrastructure investing.
The Silicon Purity Problem
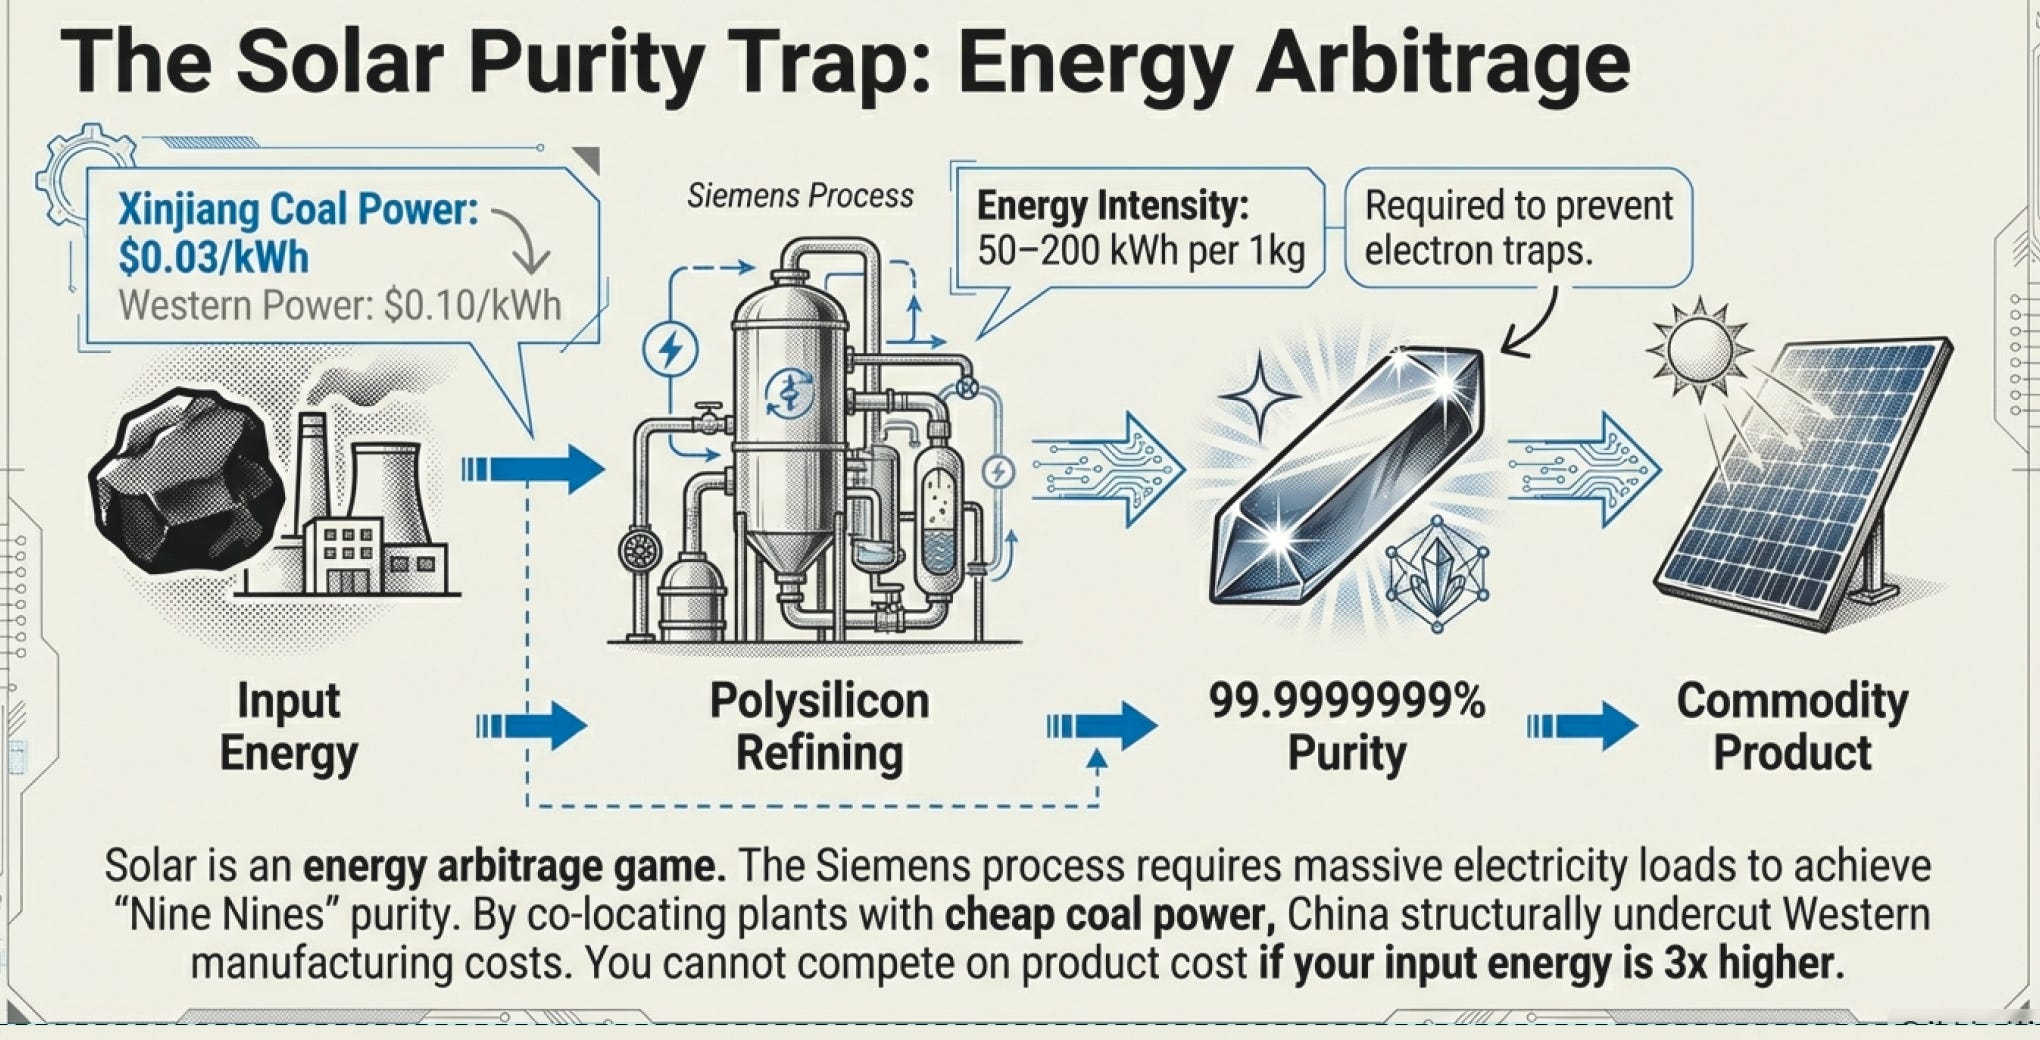
All silicon-based solar panels start the same way: purify silicon from sand (silicon dioxide). But the purity required is extraordinary: 99.9999999% pure—nine nines. That’s one impurity atom per billion silicon atoms.
Why such absurd purity? Because impurities create “traps” where electrons get stuck instead of flowing as electrical current. Every impurity atom reduces efficiency.
The Siemens process (chemical vapor deposition) can achieve this purity, but it’s incredibly energy-intensive: producing 1 kg of polysilicon requires 50-200 kWh of electricity. At scale, this becomes the dominant cost in solar manufacturing.
China’s advantage: They built polysilicon plants next to coal power plants where electricity costs $0.02-0.03/kWh versus $0.08-0.12/kWh in Europe or North America. Lower electricity cost translates directly to lower polysilicon cost.
Xinjiang province alone accounts for 40% of global polysilicon production precisely because they have cheap coal power and few environmental restrictions. You cannot compete with Chinese polysilicon costs without similar electricity pricing.
Monocrystalline vs. Polycrystalline: The Purity vs. Cost Trade-off
Monocrystalline cells are grown from a single crystal of silicon (Czochralski process). You melt ultra-pure polysilicon, dip a seed crystal in, then slowly pull it out while rotating. The silicon crystallizes around the seed in a uniform structure.
The result: perfect crystal lattice where electrons flow freely. Efficiency: 20-24% for commercial panels (47% achieved in labs with multi-junction cells).
Degradation rate: 0.3-0.5% per year. After 25 years, a monocrystalline panel still produces 88-92% of original output.
Problems: 1) Wasteful manufacturing—you grow cylindrical ingots but cut square cells, losing ~30% of material. 2) Energy-intensive growing process. 3) Expensive: ~30% more than polycrystalline.
Polycrystalline cells are made by melting multiple silicon fragments together, letting them cool into a block, then sawing into wafers. Much simpler. Less waste. Lower cost.
The trade-off: Multiple crystal boundaries where electrons scatter. The grain boundaries act like obstacles in an electron’s path. Efficiency: 15-17% (newer ones hit 20%).
Degradation rate: 0.5-0.8% per year. After 25 years, a polycrystalline panel produces 80-87% of original output.
For decades, the choice was: Pay more for monocrystalline to get higher efficiency and longer life, or save money with polycrystalline and accept lower performance.
Then manufacturing scale changed everything.
By 2020, Chinese manufacturers drove monocrystalline costs down to near-polycrystalline levels through sheer manufacturing volume. LONGi, Trina Solar, JinkoSolar—they installed such massive capacity that monocrystalline became the default choice.
The result: Polycrystalline panels are disappearing from the market. Why buy a 16% efficient panel that degrades faster when a 22% efficient panel costs nearly the same?
This is pure manufacturing economics overwhelming technical trade-offs. Western manufacturers couldn’t match Chinese scale, so they’re stuck in a shrinking polycrystalline market or paying penalties for smaller monocrystalline production runs.
Thin-Film: The Technology That Should Have Won (But Didn’t)
Now let’s talk about the most interesting failure in solar: thin-film technology.
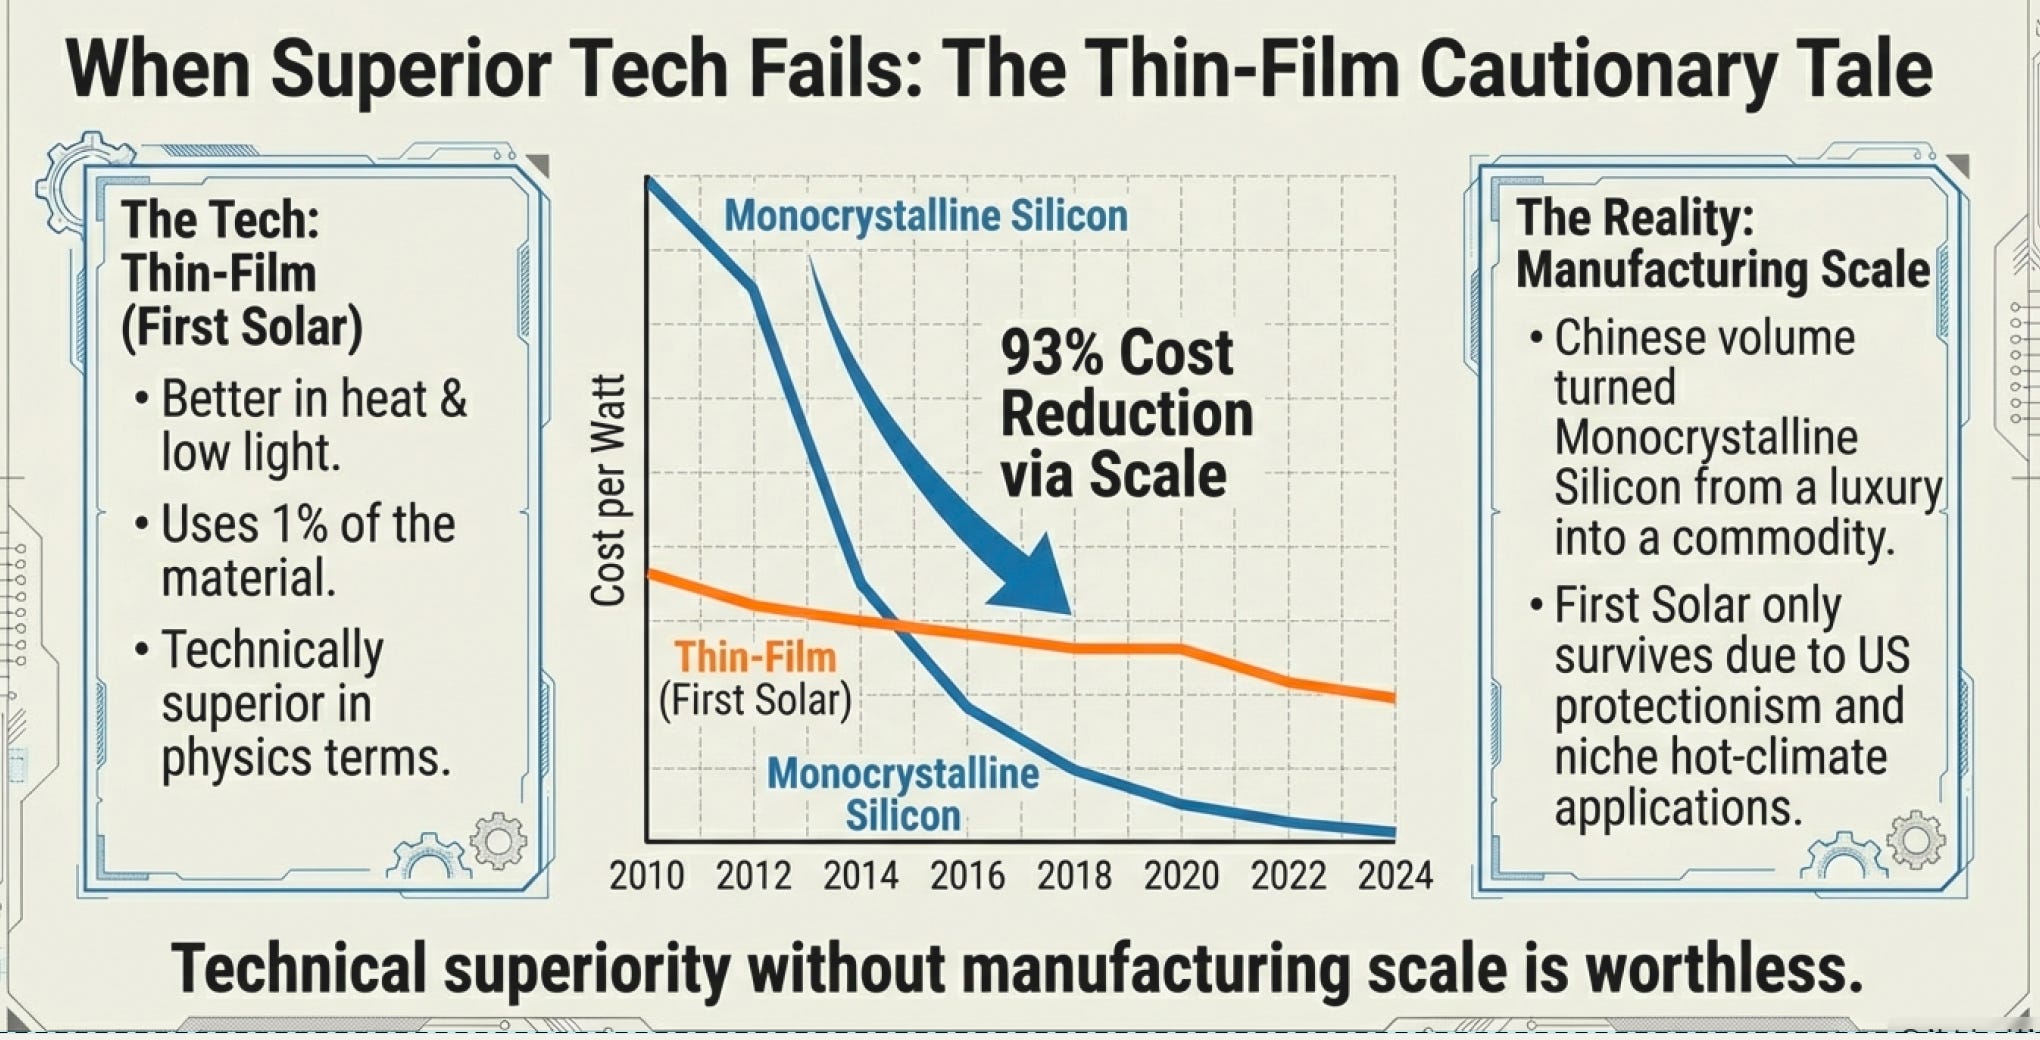
Thin-film panels (cadmium telluride, amorphous silicon, or CIGS) work differently. Instead of crystalline silicon wafers, you deposit a thin layer of photovoltaic material (often just a few micrometers) onto glass, metal, or plastic.
Advantages: Much less material required (1% of the silicon used in crystalline panels). Can be flexible depending on substrate. Better temperature coefficient (less efficiency loss in high heat). Better performance in diffuse/low light (cloudy days, morning/evening).
Cadmium telluride (CdTe) specifically performs better in hot climates because it loses less efficiency as temperature rises. In deserts where ambient temperature hits 45°C+, CdTe can outperform crystalline silicon in total annual energy production despite lower peak efficiency.
First Solar—the lone major Western manufacturer still profitable—specializes in CdTe thin-film. Their panels are only 17-19% efficient versus 22-24% for premium monocrystalline. But in the right conditions (hot climates, large utility-scale installations), they work better.
The problems: Faster degradation (thin-film typically degrades 0.8-1.5% per year). Lower energy density requires more land area for the same power output. Cadmium is toxic (though encapsulated safely in the panel).
Most critically: Manufacturing scale never materialized.
Chinese manufacturers went all-in on crystalline silicon. They built the supply chain (polysilicon, ingots, wafers, cells). They achieved scale economies. They drove costs down 93% from 2010 to 2024.
Thin-film manufacturing stayed relatively small-scale. First Solar is essentially the only major player left. They survive in a specific niche: utility-scale installations in hot climates where their technology performs better AND where US domestic content requirements give them regulatory protection.
Without that regulatory moat, First Solar wouldn’t exist. The technology is arguably superior for certain applications, but manufacturing economics killed it.
Technical superiority without manufacturing scale is worthless in infrastructure businesses.
The Offshore Wind Puzzle: Why Bigger Isn’t Always Better
Let’s close with the most capital-intensive, technically demanding alternative energy technology: offshore wind.
In 2024, the average offshore wind turbine size reached 9.8 MW—nearly double the 5.5 MW average for onshore. Some designs exceed 15 MW. The largest announced is 22 MW.
Bigger is better, right? More power per turbine, fewer turbines needed, lower installation costs per MW.
Except here’s what happens when you scale up:
The Cube-Square Problem
Power scales with rotor swept area (diameter squared). But weight and material requirements scale roughly with volume (diameter cubed). This creates increasingly unfavorable structural requirements as you scale up.
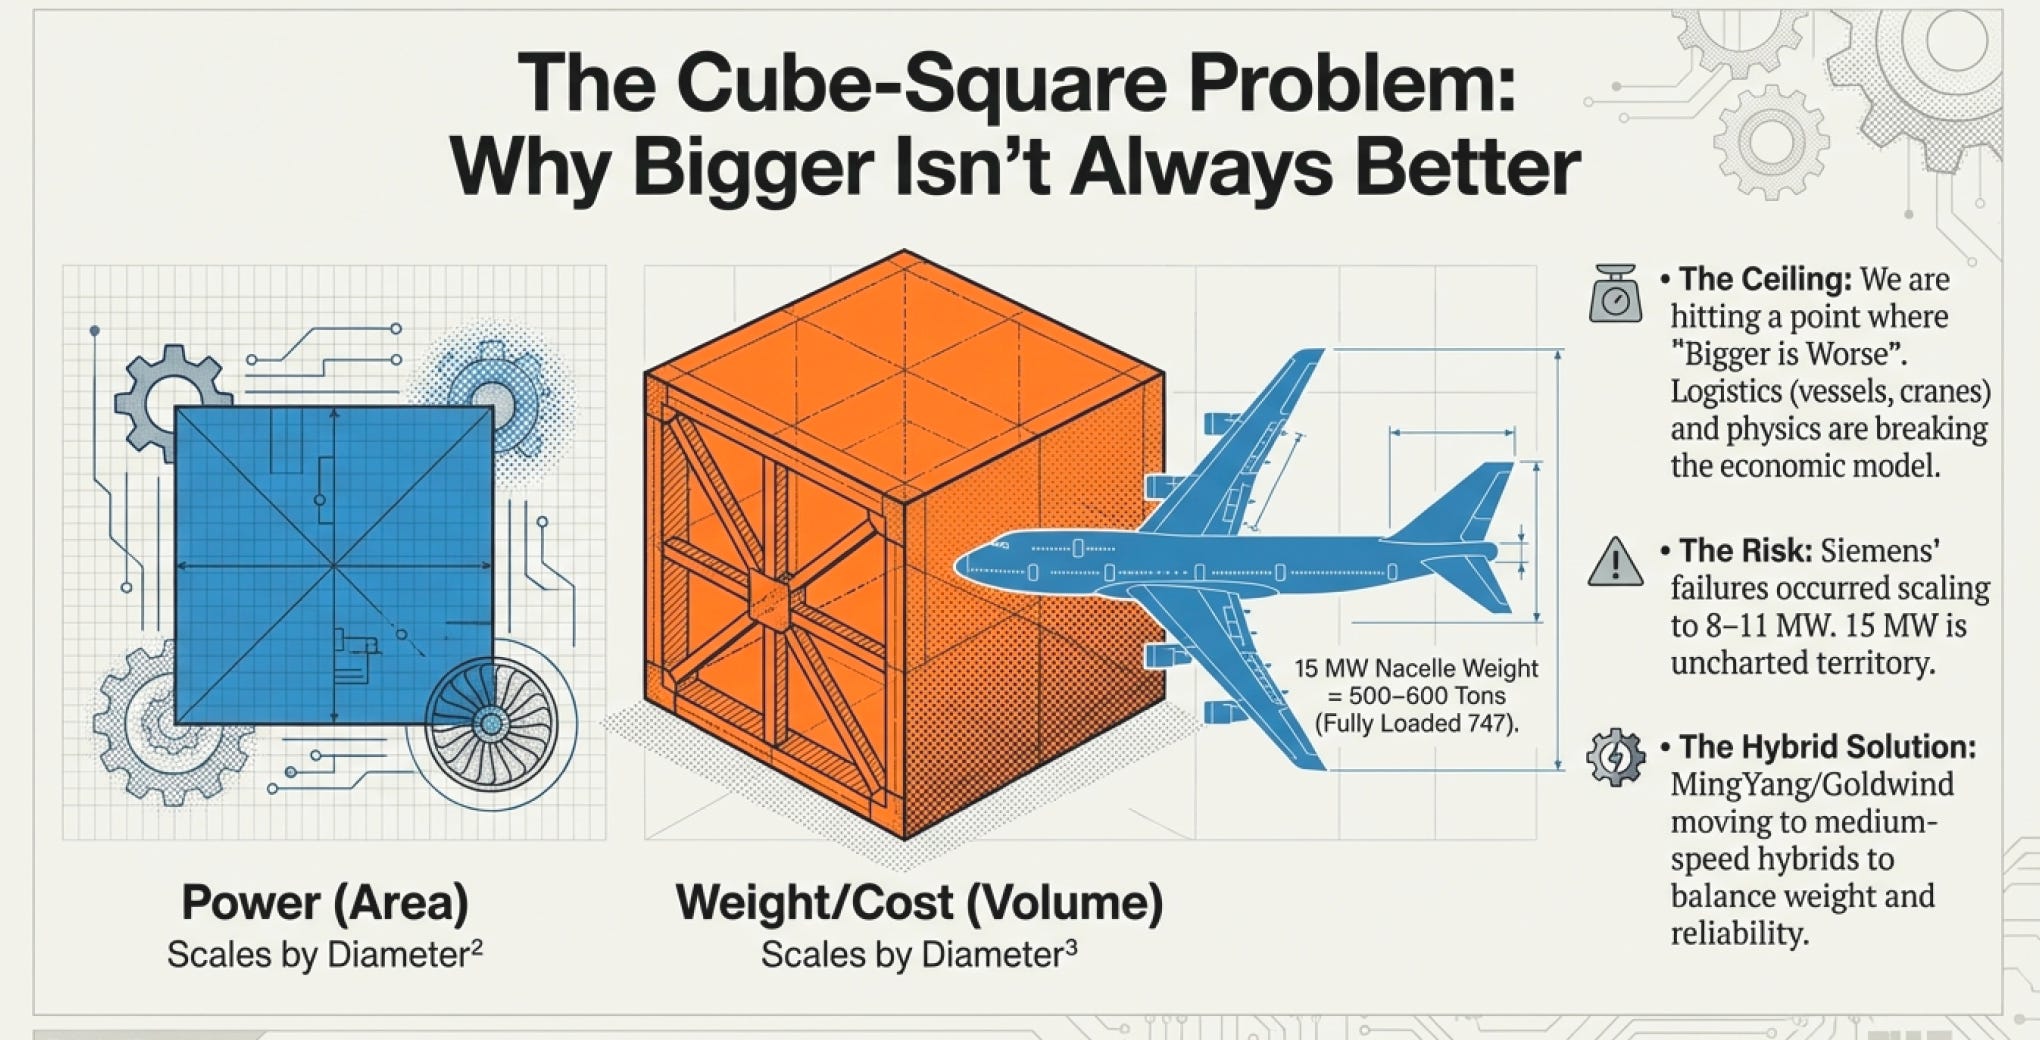
A 15 MW turbine with a 240-meter rotor diameter requires a nacelle (the box containing the generator) weighing 500-600 tons. That’s a fully loaded Boeing 747. Sitting on top of a tower 150-200 meters tall. In the middle of the ocean. Being buffeted by 30-meter waves and hurricane-force winds.
The engineering challenges compound:
Blade manufacturing: Carbon fiber blades 110+ meters long must be manufactured in single pieces (you can’t join them or they’ll fail at the joint). The manufacturing facilities for 110-meter blades don’t exist in most locations. Transportation of 110-meter blades is logistically nightmarish.
Installation vessels: You need specialized jack-up vessels that can lift 500+ ton nacelles in harsh offshore conditions. There are ~30 suitable vessels globally. Day rates: €300,000-500,000. They’re booked years in advance.
Foundation engineering: A 15 MW turbine generates enormous overturning moments (torque trying to tip the tower over). Offshore foundations—monopiles, jacket structures, or floating platforms—must resist these forces in 50+ meter water depths with corrosive saltwater, wave loads, and seafloor scour.
Maintenance: When something breaks 50 kilometers offshore in a 15 MW turbine, you need calm weather (wave heights <2 meters), specialized technicians, heavy-lift vessels, and replacement parts weighing tons. Downtime often exceeds a week. Lost revenue: €40,000-80,000 per day per turbine.
Electrical systems: 15 MW at 66kV means 227 amps—substantial current requiring thick cables, sophisticated switchgear, and robust electrical protection. Offshore substations cost €100-300 million and collect power from 50-100 turbines before transmitting to shore via high-voltage DC cables.
Here’s the crucial insight: The theoretical economics favor larger turbines—more power per turbine, lower cost per MW installed. But the practical engineering challenges create a ceiling where bigger becomes worse.
Siemens Gamesa’s serial defects in their SG 8.0-167 DD and SG 11.0-200 DD models? Those are 8-11 MW turbines. Specifically, the transition to larger sizes exposed design flaws that weren’t apparent at 3-4 MW scale.
MingYang and Goldwind are approaching offshore differently:
They’re developing two-stage gearbox + PMG hybrid designs for 10-16 MW turbines. Not pure direct-drive (too heavy at this scale), not three-stage gearbox (too complex, too many failure points), but a middle path: simplified gearbox with permanent magnet generator. And they are able to do this because of the PMDD technology they have purchased (PMG stands for Permanent Magnet Generator. It is the specific type of electrical generator that forms the core of the PMDD - Permanent Magnet Direct Drive system).
This architecture targets the “sweet spot”—large enough for good economics, not so large that engineering challenges overwhelm benefits.
Vestas and GE Vernova are sticking with three-stage gearbox architectures they’ve refined over decades, betting that their experience with gearbox reliability will overcome the Chinese hybrid approach.
Who’s right? We won’t know for another 5-10 years—which is exactly how long it takes for infrastructure technologies to prove themselves.
But here’s what we know today: Offshore wind installations outside China have serious execution problems. Projects are delayed 2-3 years beyond schedule. Costs exceed budgets by 30-50%. Supply chain bottlenecks (vessels, cables, foundations) create queues.
Meanwhile, China installed more offshore wind capacity in 2024 alone than the rest of the world combined. They have the specialized vessels, the manufacturing capacity, the installation expertise, and crucially, the domestic market that absorbs installations even when export markets pause.
What Technical Choices Actually Create Moats
After walking through wind turbine architectures, battery chemistry, solar cell manufacturing, and offshore engineering challenges, here’s what determines durable competitive advantages in our Alternative energy sector:
Scale Enables Learning That Others Cannot Replicate
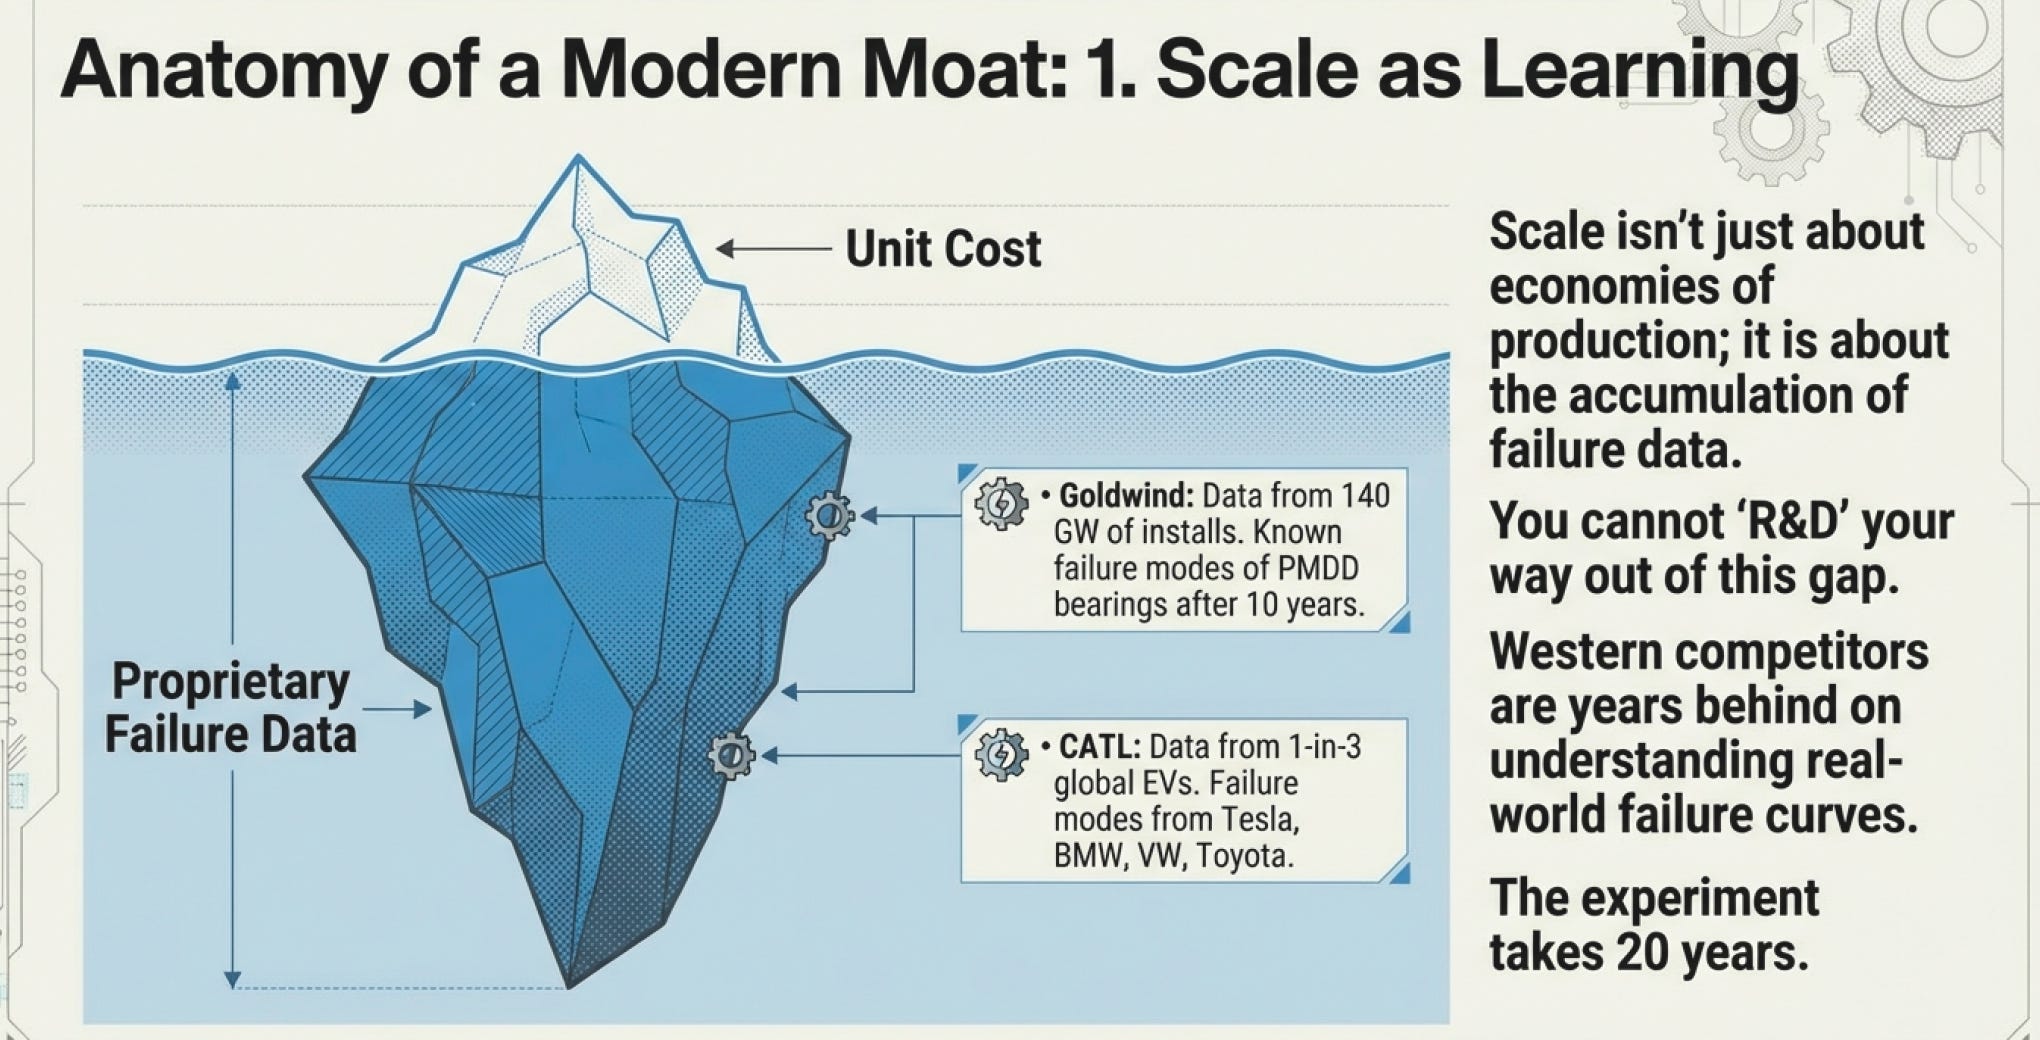
Goldwind’s 20+ GW of PMDD installations created failure databases that competitors cannot access. Every bearing that fails early, every generator fault, every thermal management issue—they see it first, solve it first, and incorporate the solution into the next design iteration.
When Vestas or GE try to adopt direct-drive designs, they’re starting from scratch with public literature and test data. Goldwind has proprietary data from 140 GW cumulative installations. That 10-year head start cannot be overcome by throwing money at R&D (especially when cost of switching and cost of searching is high due to engineers being trained to handle PMDD technologies).
CATL supplies one in three EVs globally—their failure mode database from Tesla, BMW, Volkswagen, Toyota, and dozens of other manufacturers is unmatched. When they develop new battery management algorithms or thermal systems, they test against edge cases competitors haven’t encountered yet.
Chinese solar manufacturers produce 95%+ of global polysilicon—they’ve optimized the Siemens process to energy efficiencies Western manufacturers gave up trying to match. That manufacturing learning curve is worth more than any patent. LONGi’s facilities produce cells with 0.001% defect rates. Western manufacturers still have 10x higher defect rates because they lack the cumulative production experience.
Chemistry Locks In Supply Chains
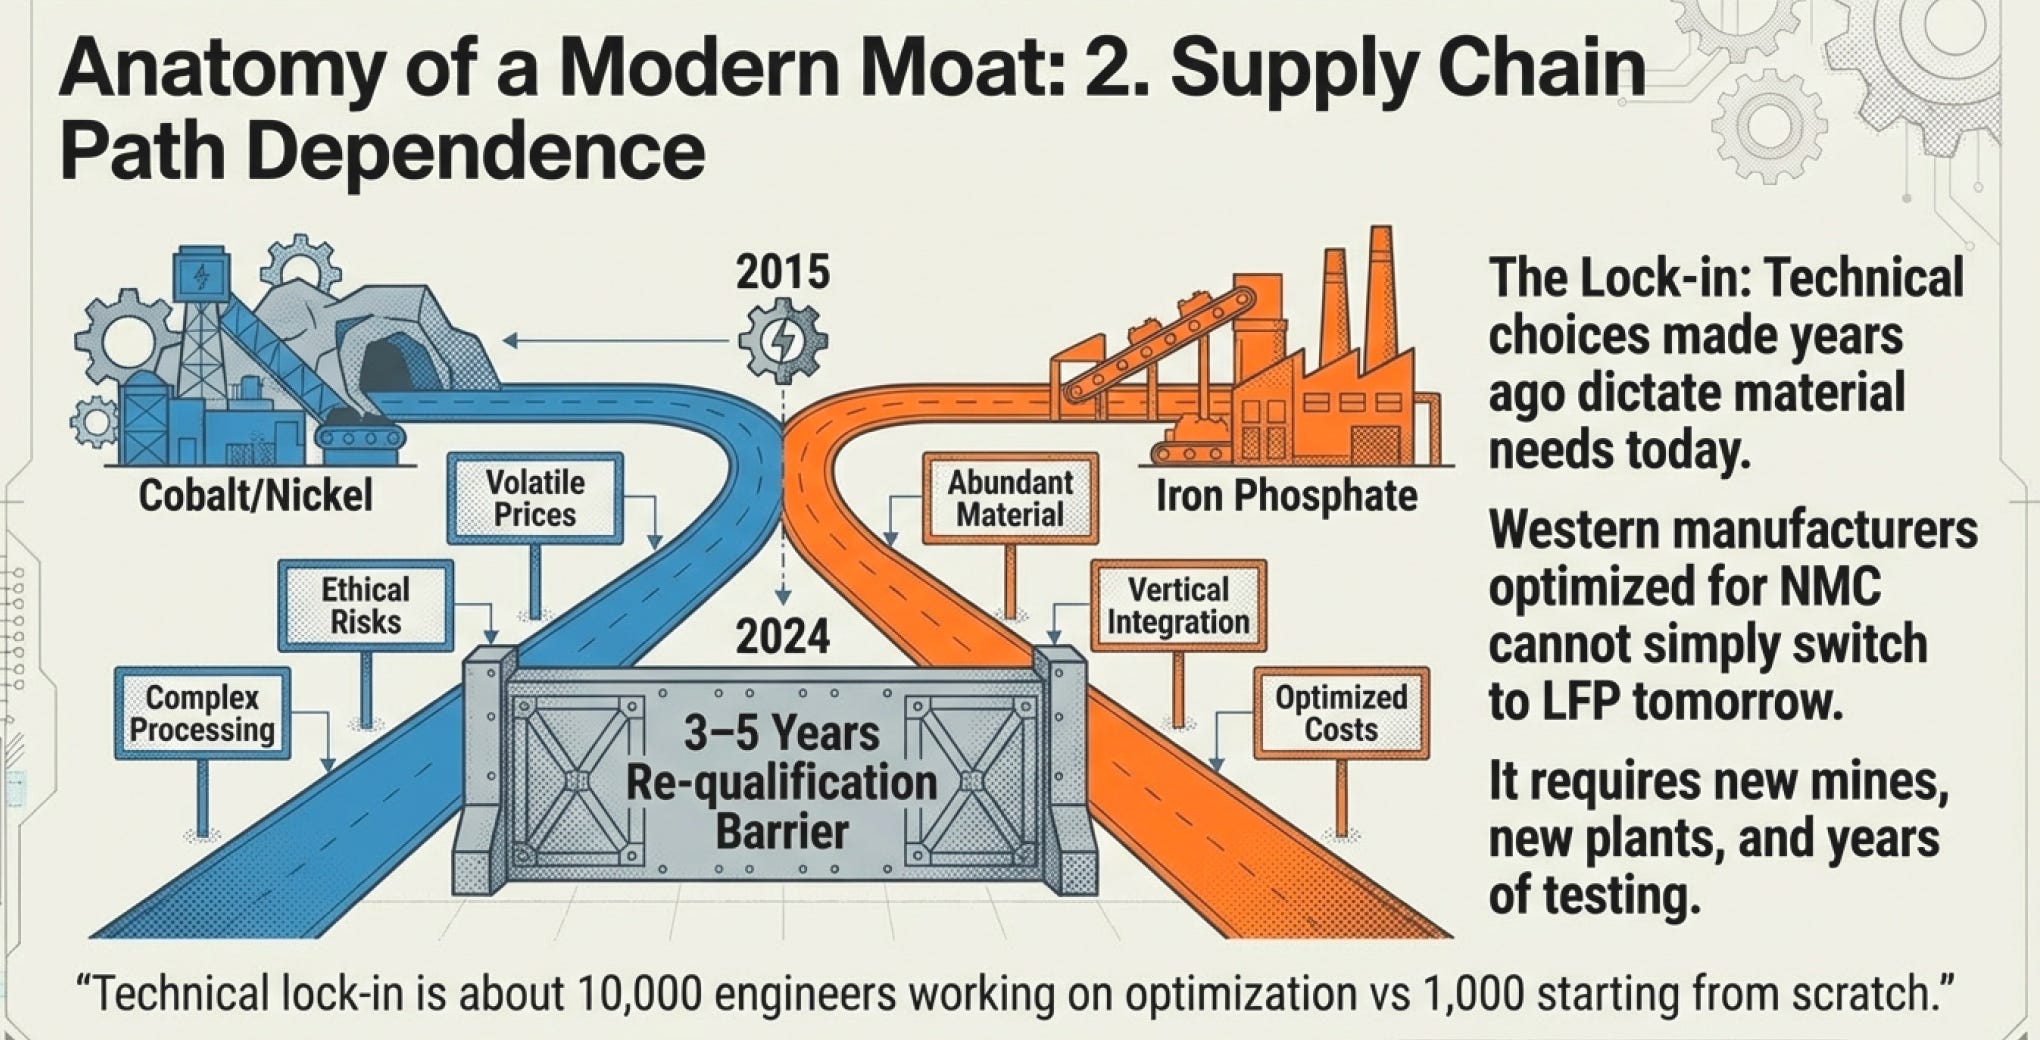
LFP requires iron phosphate cathode materials—China controls the supply chain from lithium mining to cathode production to cell manufacturing. Western manufacturers switching to LFP face 3-5 year qualification timelines just to establish supply chains.
NMC requires cobalt and nickel—geographically concentrated, politically volatile, ethically problematic. CATL and BYD secured supply agreements years ago. New entrants pay spot prices 20-30% higher.
Rare earth elements (neodymium, dysprosium) for permanent magnets—China processes 85% of global supply. Direct-drive wind turbines require significantly more rare earth materials than gearbox designs. Goldwind has guaranteed supply; Western manufacturers scramble.
Chemistry choices made 10 years ago determine material cost structures today. You cannot easily switch battery or turbine architecture when your supply chain is optimized for specific materials.
Failure Modes Take Years to Reveal
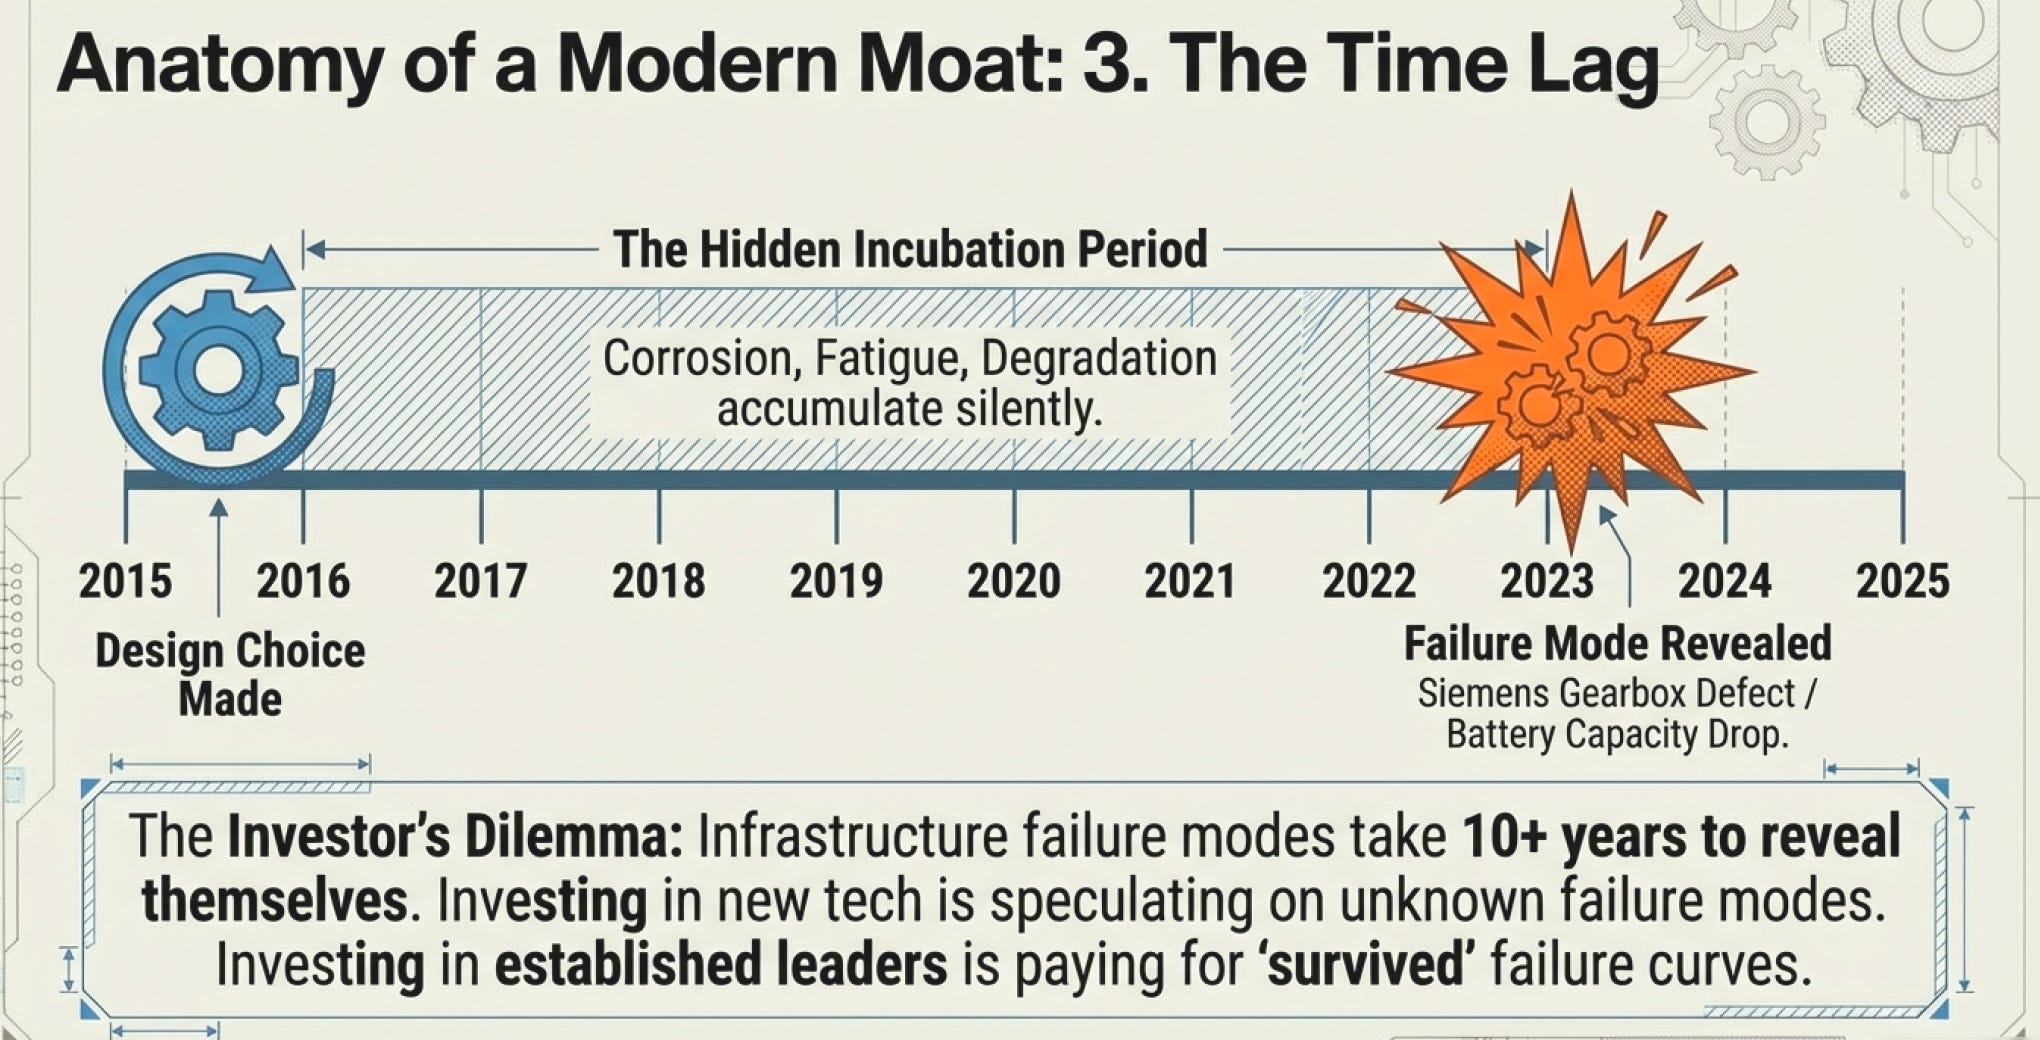
Wind turbines operate for 20-25 years—failure modes can take 10+ years to appear. Goldwind’s turbines installed in 2015 are now showing which components need life extension interventions. Competitors installing in 2024 won’t know their failure profiles until 2034.
Battery degradation is non-linear—LFP might show minimal degradation for 3,000 cycles then suddenly accelerate. NMC might degrade steadily at 0.5% per cycle. Only manufacturers with 10+ years of field data know the real-world degradation curves.
Solar panel degradation from soiling, corrosion, and UV exposure varies by climate—panels performing well in Germany might degrade faster in Saudi Arabia due to dust and heat. Manufacturers need installations in dozens of climates over 10+ years to understand true lifetime performance.
Infrastructure investors betting on new technologies are speculating on failure modes that won’t reveal themselves for a decade. Infrastructure investors backing established technologies are paying a premium for companies that already survived the failure mode learning curve.
The Technical Choices That Will Shape the Next Decade
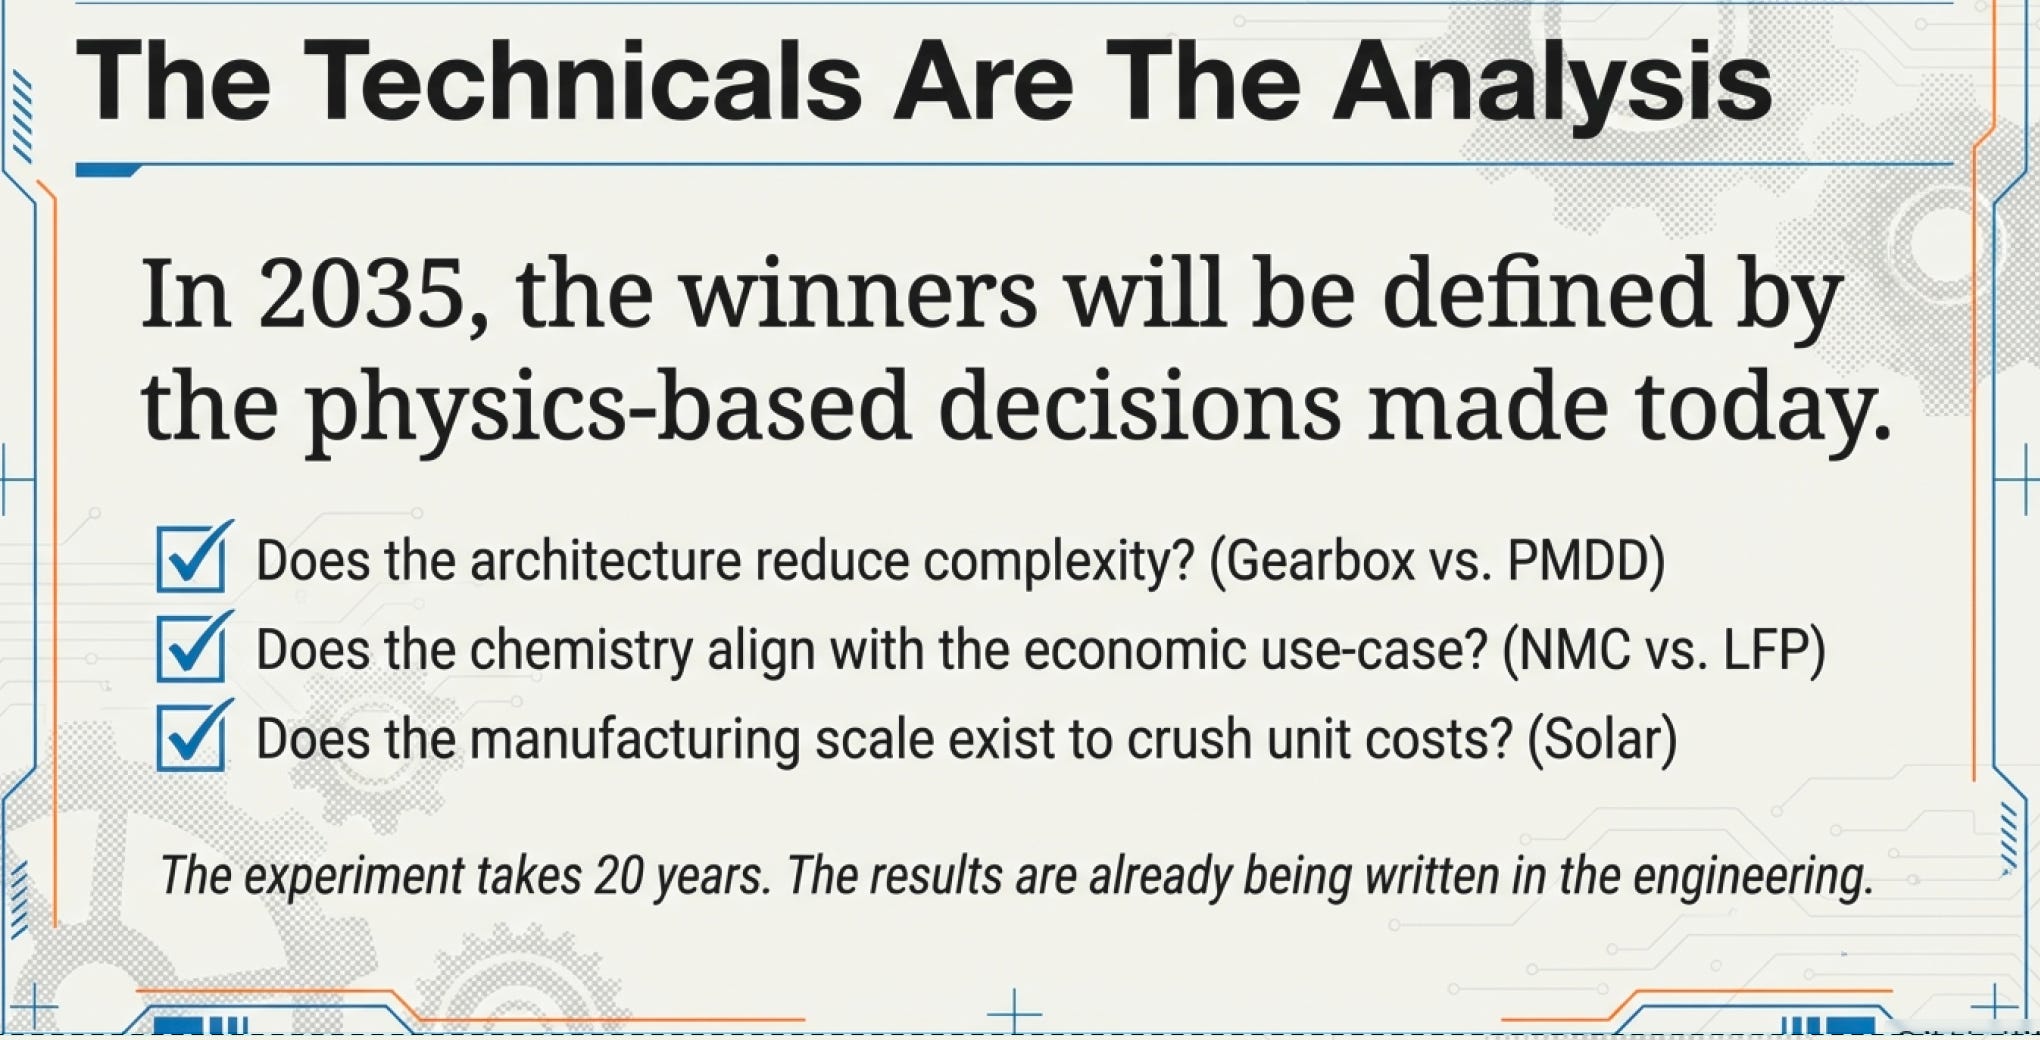
We’ve now examined the engineering details that actually determine competitive outcomes: wind turbine drivetrains, battery chemistry, solar cell manufacturing, and offshore scaling challenges.
Here’s what this reveals about the industry:
Technical lock-in which creates a competitive edge isn’t about patents—it’s about converting technical choices into economic advantages be it through scale or specialization. Goldwind’s direct-drive expertise, CATL’s LFP supply chain, Chinese solar manufacturers’ polysilicon costs—these advantages compound annually.
Chemistry choices made a decade ago determine today’s supply chain advantages. You cannot easily switch from NMC to LFP, from gearbox to direct-drive, or from crystalline to thin-film when your infrastructure is optimized for specific materials and processes.
Failure modes take 10-20 years to reveal—by which time the winners have already been decided. Siemens’s €2.2 billion gearbox failure, thin-film’s market collapse, NMC’s thermal runaway risks—all became apparent years after the technical decisions were locked in.
Money cannot buy real advantages. CATL’s 37.9% market share isn’t just sales—it’s data from one in three EVs globally. That failure mode database is worth more than any R&D budget.
In infrastructure, the “experiment” takes 20 years. The companies running the largest experiments today—Goldwind, CATL, BYD, LONGi, Trina—will have answers competitors won’t discover for another decade.
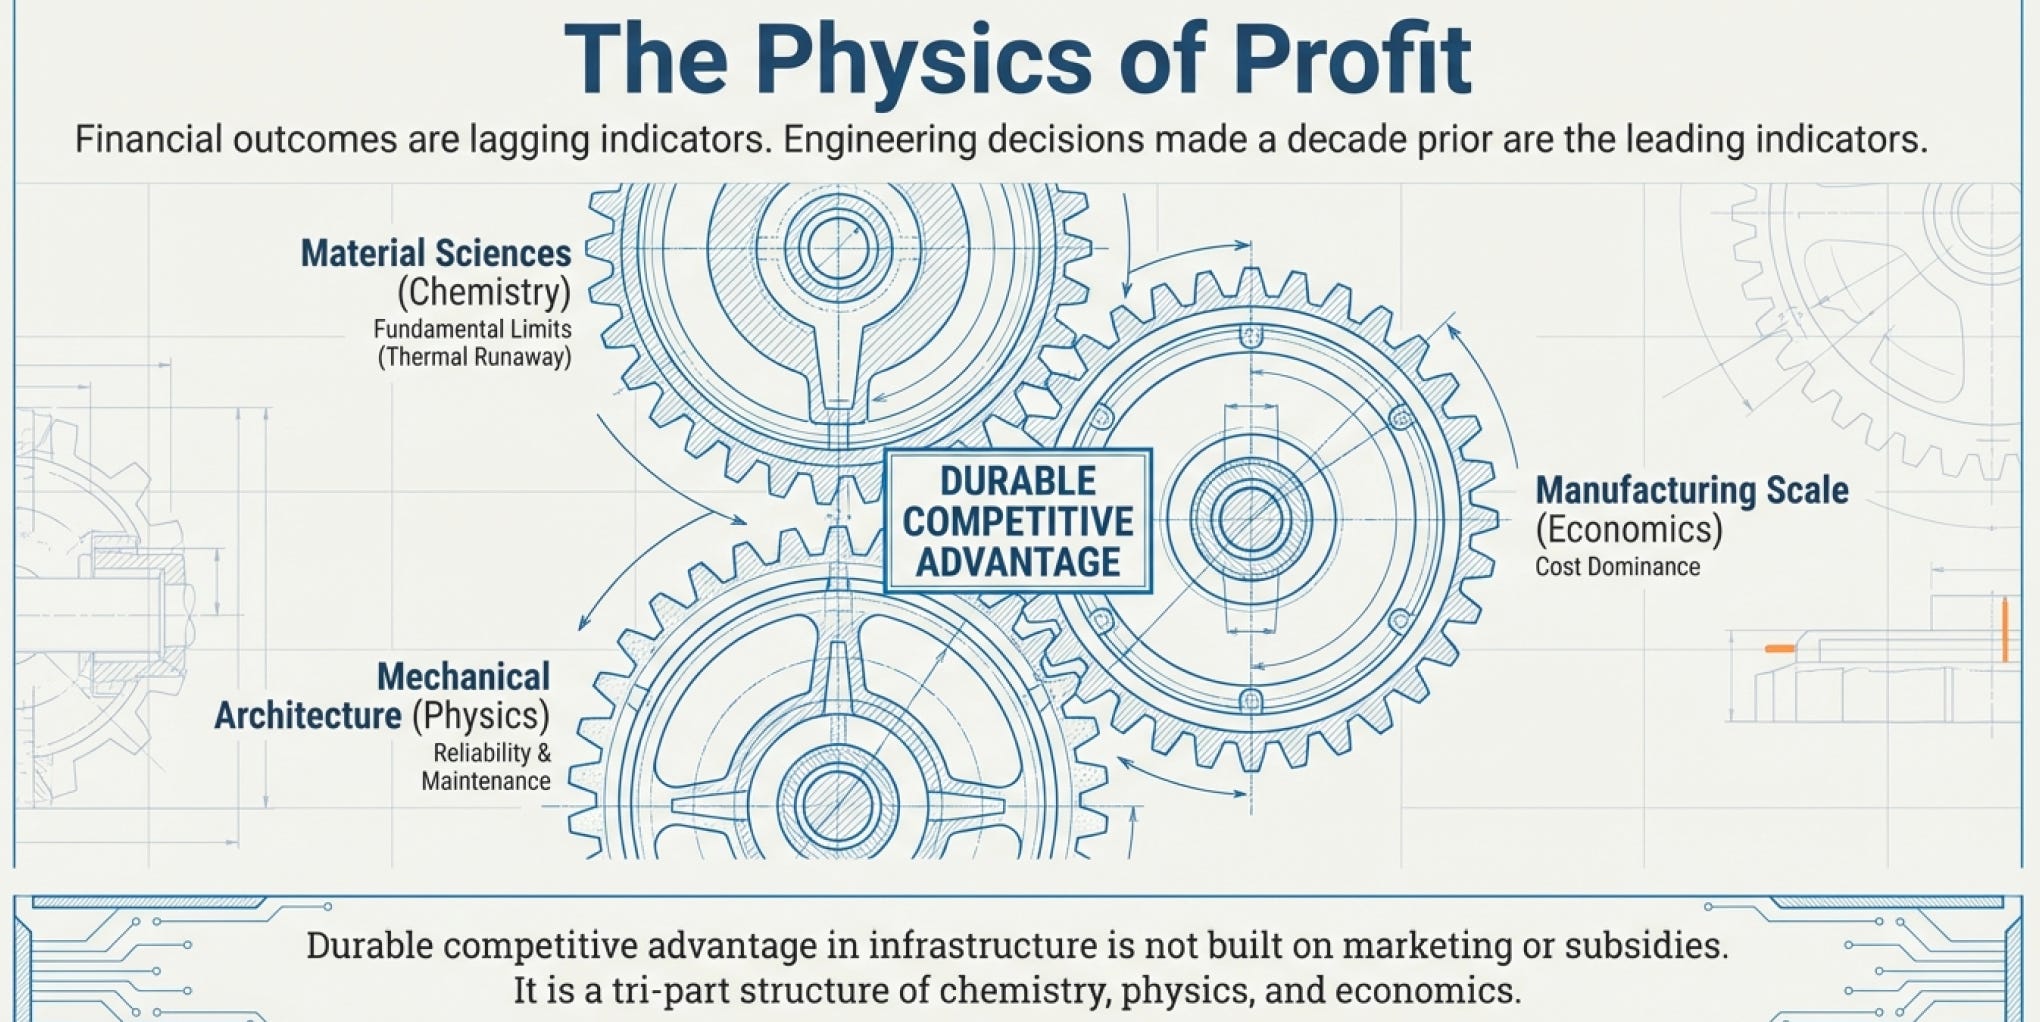
And that’s why technical details matter more than market sentiment, more than subsidy policies, more than political promises, more than forecasting. And equally as important as what the financials tell us about a business. Because in 2035, when we look back at who survived and who didn’t, it won’t be the companies with the best marketing—it’ll be the companies whose technical choices aligned with the physics, the chemistry, and the manufacturing economics.
The engineering details aren’t a distraction from the business analysis. They are the business analysis.
What remains isn’t forecasting the future. It’s understanding which technical decisions made 5-10 years ago created advantages that persist for the next 20.
That’s what separates real infrastructure investing from institutional speculation.
And that’s why the €2.2 billion mistake Siemens made wasn’t really about one defect—it was about the compounding consequences of technical choices made in 2015 revealing themselves in 2023.
The technicals aren’t details. The technicals are everything.
For part 1 - Industry Fundamentals: click here
For part 2 - Business & Competitive Landscape: click here
For part 3 - Industry and Sector Technicals: click here
References
Variable-speed wind turbine concepts and generator configurations
https://en.wikipedia.org/wiki/Variable_speed_wind_turbineDoubly-fed induction generator (DFIG) operating principles
https://en.wikipedia.org/wiki/Doubly_fed_electric_machineWind turbine drivetrain configurations and comparisons (gearbox, DFIG, PMSG, direct drive)
https://stax.strath.ac.uk/concern/theses/mg74qm83zDesign and reliability comparison of direct-drive and geared wind turbines
https://www.sciencedirect.com/science/article/pii/S0959652614009779Wind turbine gearbox reliability and failure modes
https://www.nrel.gov/docs/fy15osti/63482.pdfGenerator speed requirements and mechanical-to-electrical energy conversion in wind turbines
https://www.energy.gov/eere/wind/how-do-wind-turbines-workHybrid medium-speed (two-stage gearbox) wind turbine drivetrain designs
https://www.sciencedirect.com/science/article/pii/S1364032119308381Offshore wind turbine drivetrain evolution for 10–16 MW turbines
https://www.ore.catapult.org.uk/app/uploads/2021/10/ORE-Catapult-Drivetrain-Report.pdfRare earth usage in permanent magnet wind turbine generators
https://unu-merit.nl/publications/wppdf/2014/wp2014-043.pdfMaterial intensity of direct-drive vs geared wind turbines
https://www.iea.org/reports/the-role-of-critical-minerals-in-clean-energy-transitionsPermanent magnet generator design and advantages
https://www.sciencedirect.com/science/article/pii/S1364032118303302Lithium-ion battery chemistries overview (NMC, LFP, NCA)
https://www.energy.gov/eere/vehicles/articles/lithium-ion-battery-chemistryComparison of LFP and NMC battery energy density and cycle life
https://www.ufinebattery.com/blog/lfp-vs-nmc-battery-what-is-the-difference/Safety characteristics of lithium iron phosphate batteries
https://www.electronicsweekly.com/blogs/electro-ramblings/lfp-battery-safety-2022-04/Thermal runaway risks in lithium-ion batteries
https://www.sciencedirect.com/science/article/pii/S0378775318307937Battery degradation mechanisms and lifecycle comparisons
https://www.nature.com/articles/s41560-019-0405-1Industrial adoption trends for LFP batteries in EVs and grid storage
https://about.bnef.com/blog/lithium-iron-phosphate-batteries-are-taking-over-the-world/Crystalline silicon solar cell fundamentals
https://www.pveducation.org/pvcdromMonocrystalline vs polycrystalline solar panel efficiency differences
https://www.energy.gov/eere/solar/types-solar-panelsGrain boundaries and recombination losses in polycrystalline silicon
https://www.sciencedirect.com/science/article/pii/S0038110116300686Czochralski process for single-crystal silicon growth
https://en.wikipedia.org/wiki/Czochralski_processSilicon ingot production for photovoltaic applications
https://www.pveducation.org/pvcdrom/manufacturing/ingot-growthEnergy intensity of polysilicon manufacturing
https://www.iea.org/reports/solar-pvThin-film solar cell technologies overview
https://www.nrel.gov/pv/thin-film.htmlCadmium telluride (CdTe) solar cell technology
https://www.firstsolar.com/en/TechnologiesAmorphous silicon (a-Si) thin-film photovoltaics
https://www.pveducation.org/pvcdrom/thin-film-solar-cells/amorphous-siliconCIGS (Copper Indium Gallium Selenide) solar technology
https://www.nrel.gov/pv/cigs.htmlEfficiency and temperature coefficient advantages of thin-film PV
https://www.sciencedirect.com/science/article/pii/S1364032117309881Material usage comparison between thin-film and crystalline silicon PV
https://www.iea-pvps.org/research-tasks/task-12-life-cycle-assessment/Lifecycle assessment of photovoltaic technologies
https://www.nrel.gov/docs/fy21osti/78099.pdfPower electronics and converters in wind turbine systems
https://www.sciencedirect.com/science/article/pii/S0378779618304026Grid integration of variable renewable energy sources
https://www.iea.org/reports/grid-integration-of-variable-renewablesScaling challenges in next-generation offshore wind turbines
https://www.renewableuk.com/resource/scaling-offshore-wind/Wind turbine nacelle design and mass distribution challenges
https://www.nrel.gov/docs/fy20osti/76201.pdfComparative cost and reliability analysis of wind turbine drivetrains
https://www.sciencedirect.com/science/article/pii/S0960148120302307