
The Paradox That Breaks Every Prediction
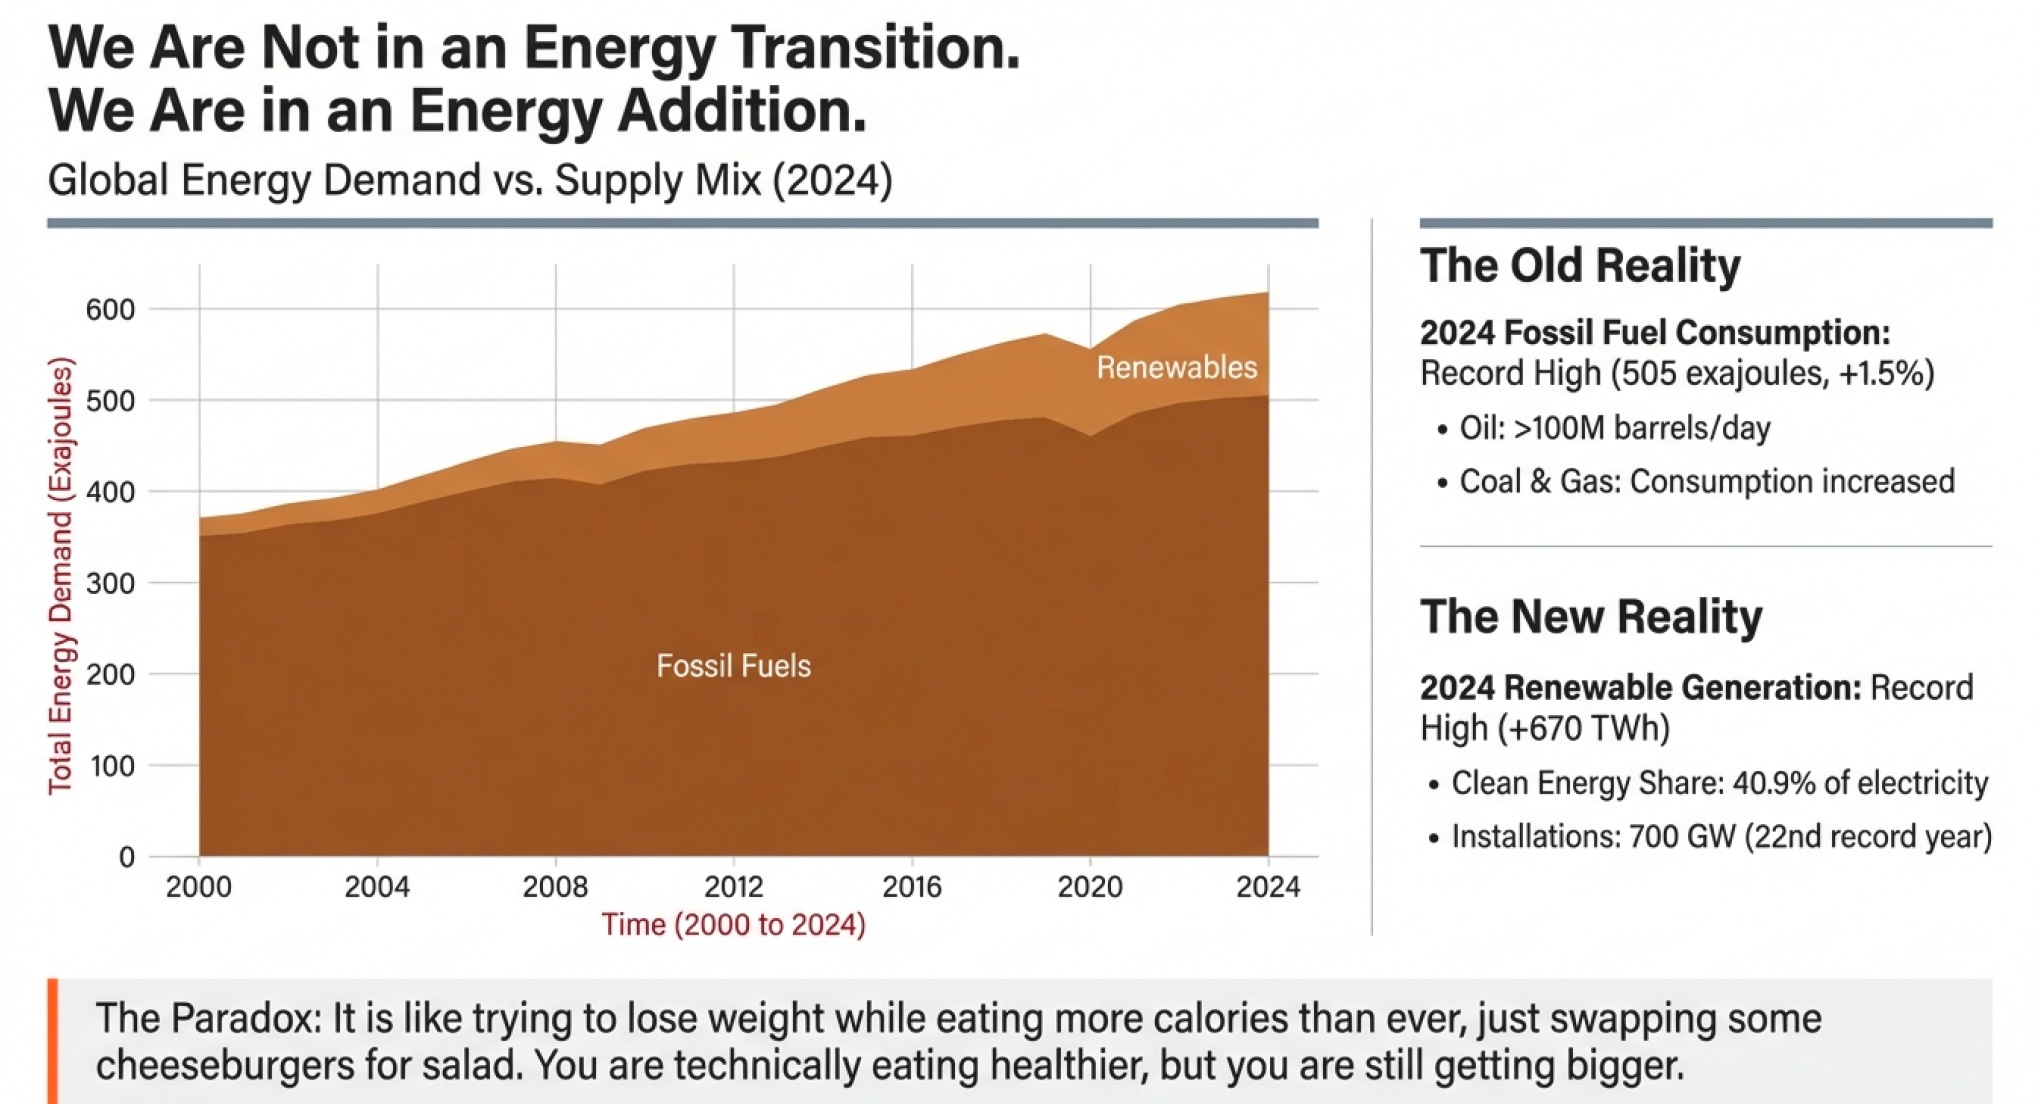
Here’s something that should make you uncomfortable: In 2024, global fossil fuel consumption hit an all-time record—505 exajoules, up 1.5% from the previous year. Coal consumption increased. Oil consumption surpassed 100 million barrels per day for the first time ever. Natural gas saw the strongest demand growth among all fossil fuels.
At the exact same time, renewable energy also hit all-time records. Solar and wind generation surged by 670 TWh. Total renewable capacity installations reached 700 GW for the 22nd consecutive record year. Clean energy sources (renewables plus nuclear) provided 40.9% of global electricity generation for the first time since the 1940s—when the global electricity system was 50 times smaller.
Both things are true. Simultaneously. And that’s the paradox nobody wants to talk about.
We’re not in an energy transition—we’re in an energy addition. We’re building massive amounts of renewable capacity on top of growing fossil fuel consumption, not instead of it. It’s like trying to lose weight while eating more calories than ever, just swapping some of the cheeseburgers for salad. You’re technically eating healthier, but you’re still getting bigger.
In 2024, global energy demand grew 2.2%—nearly twice the average rate over the past decade. Electricity demand alone surged 4.3%, well above the 3.2% growth in global GDP. Record temperatures drove cooling demand. Electrification of transport increased consumption. AI data centers pulled enormous power. Manufacturing in China and India expanded. Emerging and developing economies accounted for over 80% of the energy demand increase.
And here’s the kicker: oil’s share of total energy demand fell below 30% for the first time ever in 2024—50 years after peaking at 46% in 1974. Sounds fantastic, right? Except oil demand still grew by 0.8% in absolute terms. The pie got bigger faster than oil’s slice shrank.
This is the central conflict of our story: the world needs vastly more energy to support 8 billion people (heading to 10 billion), most of whom want modern living standards. Renewables are growing explosively. And it’s still not nearly enough to even slow the growth of fossil fuels, let alone replace them.
If you want to understand the alternative energy business—really understand it, not just the promotional version—you need to start here. With the uncomfortable math. Because the math determines everything that follows: which technologies can actually scale, which business models survive, and who captures the economic value.
Let’s dig into why this is so hard.
What We’re Really Buying When We Buy Energy
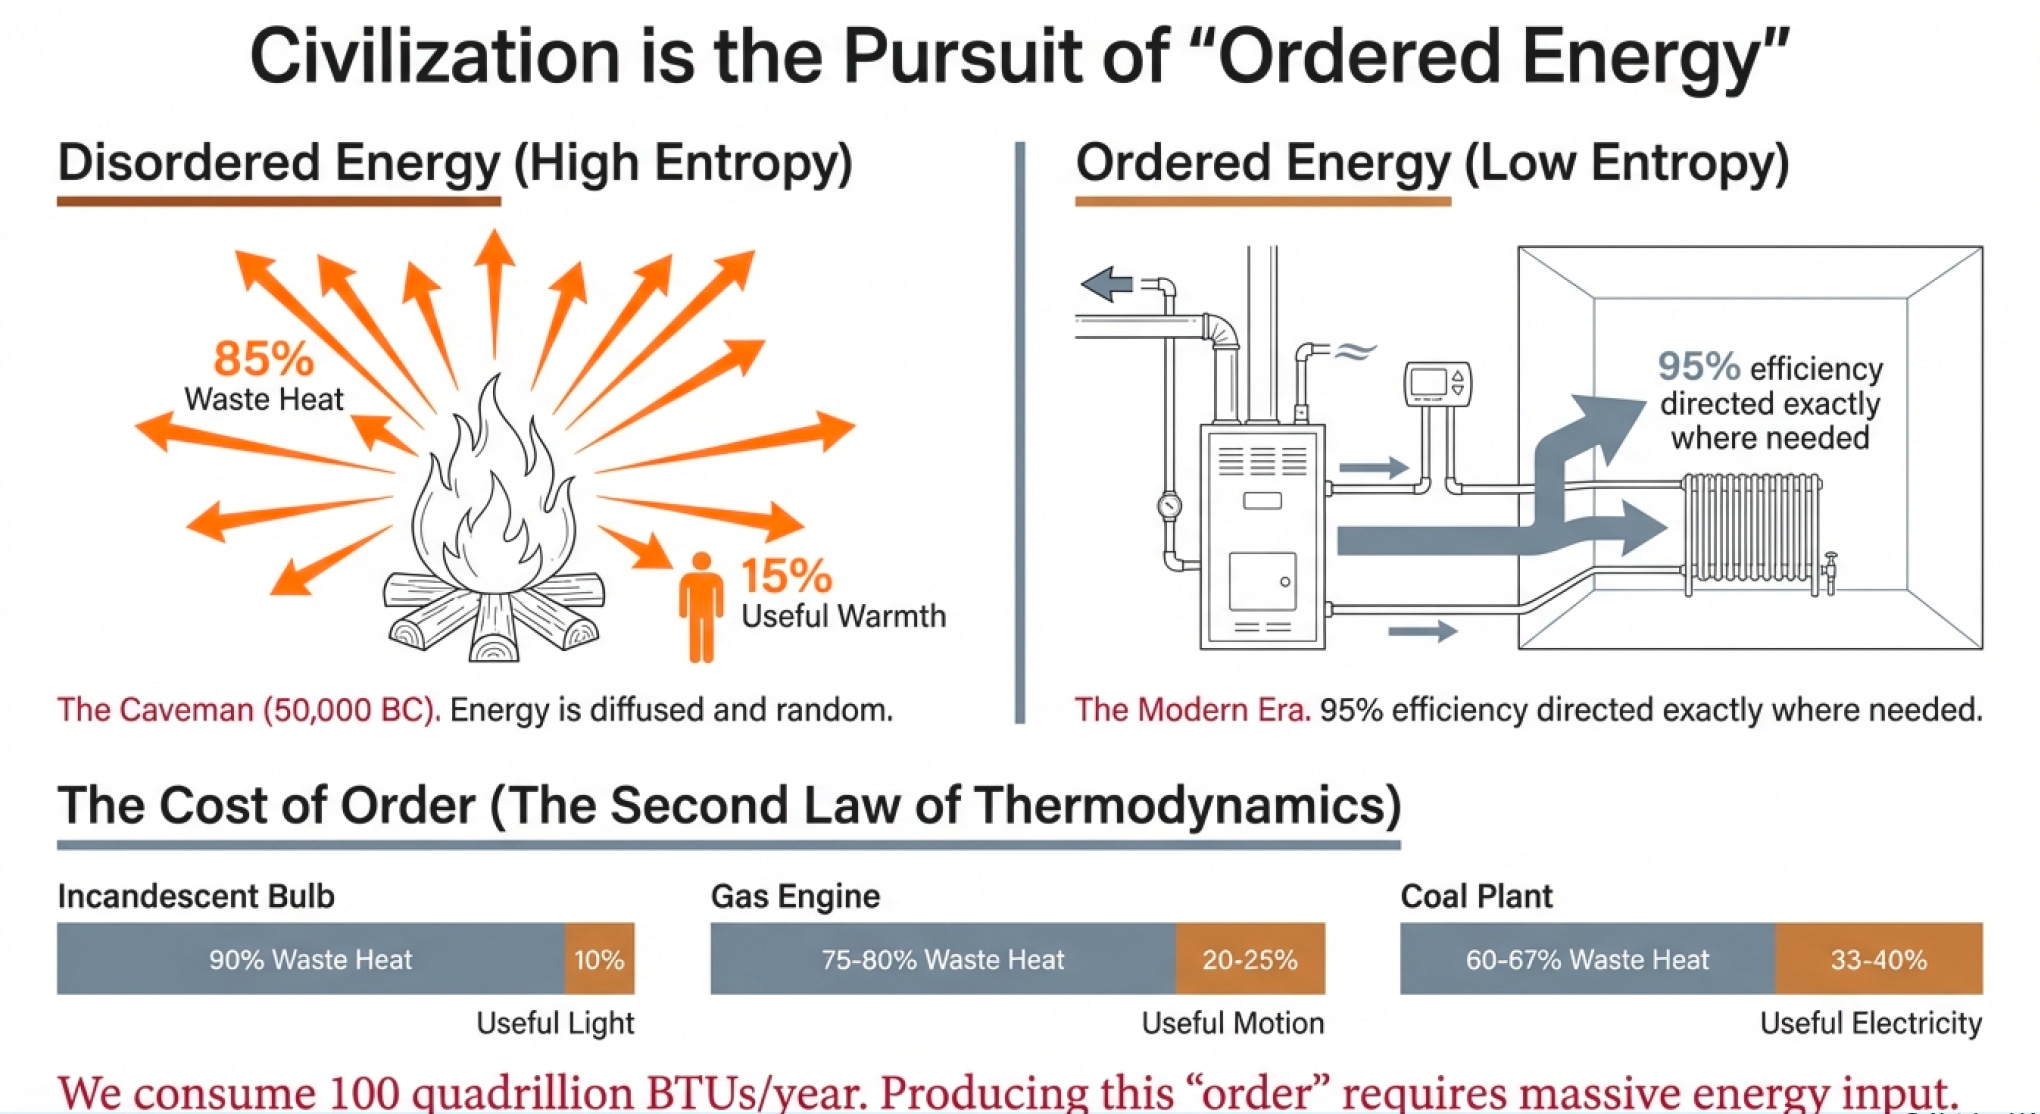
Picture a caveman in 50,000 BC, cold and hungry. He gathers dry wood, strikes flint on stone, creates a spark, and lights a fire. Most of the heat energy from that fire radiates out into the night sky, warming nothing but air molecules. Maybe 10-15% of the heat actually warms the caveman’s skin.
This is a spectacularly inefficient process. But it worked well enough that humans did it for 50,000 years.
Now picture yourself today. You get cold, and you turn a dial on your wall. A furnace ignites, heats water or air, and pumps it through pipes to radiators or vents. The system might be 85-95% efficient at converting fuel to useful heat directed exactly where you want it.
The difference between these two scenarios isn’t just technology—it’s the concept of “ordered energy.”
Here’s what Richard Feynman would say if you asked him to explain energy: “Energy is neither created nor destroyed—it only changes form. But not all forms of energy are equally useful. High-quality energy is concentrated and can do specific work. Low-quality energy is diffused and essentially useless for doing work.”
This is called “ordered energy” versus “disordered energy,” and it’s the single most important concept for understanding infrastructure businesses:
Ordered energy = concentrated, directed, capable of doing specific work (electricity, gasoline, natural gas flowing through a pipe)
Disordered energy = diffused, random, essentially useless (waste heat dissipating into the environment, warm air rising from a campfire)
The entire history of human civilization is the story of getting better at creating and using ordered energy. From wood fires to coal-fired steam engines to internal combustion engines to electrical grids to precision semiconductor manufacturing—each step requires more sophisticated ordering of energy, which enables more complex civilization, which requires even more ordered energy.
Today, Americans consume about 100 quadrillion BTUs of energy per year. That’s 15 large horses working 24/7 for every single person—except we don’t notice because the “horses” are gasoline in car engines, electricity from power plants, and natural gas heating our homes.
Breaking it down:
40% goes to electricity (computers, lights, appliances, factories, data centers)
30% goes to transportation (cars, trucks, ships, planes)
30% goes to heating and cooling (furnaces, air conditioners, industrial heat processes)
But here’s where it gets interesting: producing ordered energy wastes enormous amounts of energy as disorder.
An incandescent light bulb converts only 10% of electrical energy into light—the rest becomes waste heat. Solar panels convert 15-22% of sunlight into electricity. Coal power plants convert roughly 33-40% of coal’s chemical energy into electrical energy. Even modern gasoline engines are only 20-25% efficient at converting fuel into motion.
The rest? Lost to entropy. Dissipated as low-grade heat. Gone forever in terms of useful work.
This is the cruel reality of the Second Law of Thermodynamics: Every energy conversion creates disorder. Always. No exceptions. Ever.
Feynman put it perfectly: “The first law of thermodynamics says you can’t win. The second law says you can’t break even. And the third law says you can’t quit the game.”
The One Gallon Problem
Let me give you the single number that explains why electric vehicles took so long to become viable: One gallon of gasoline contains the energy equivalent of 300 pounds of batteries.
Three. Hundred. Pounds.
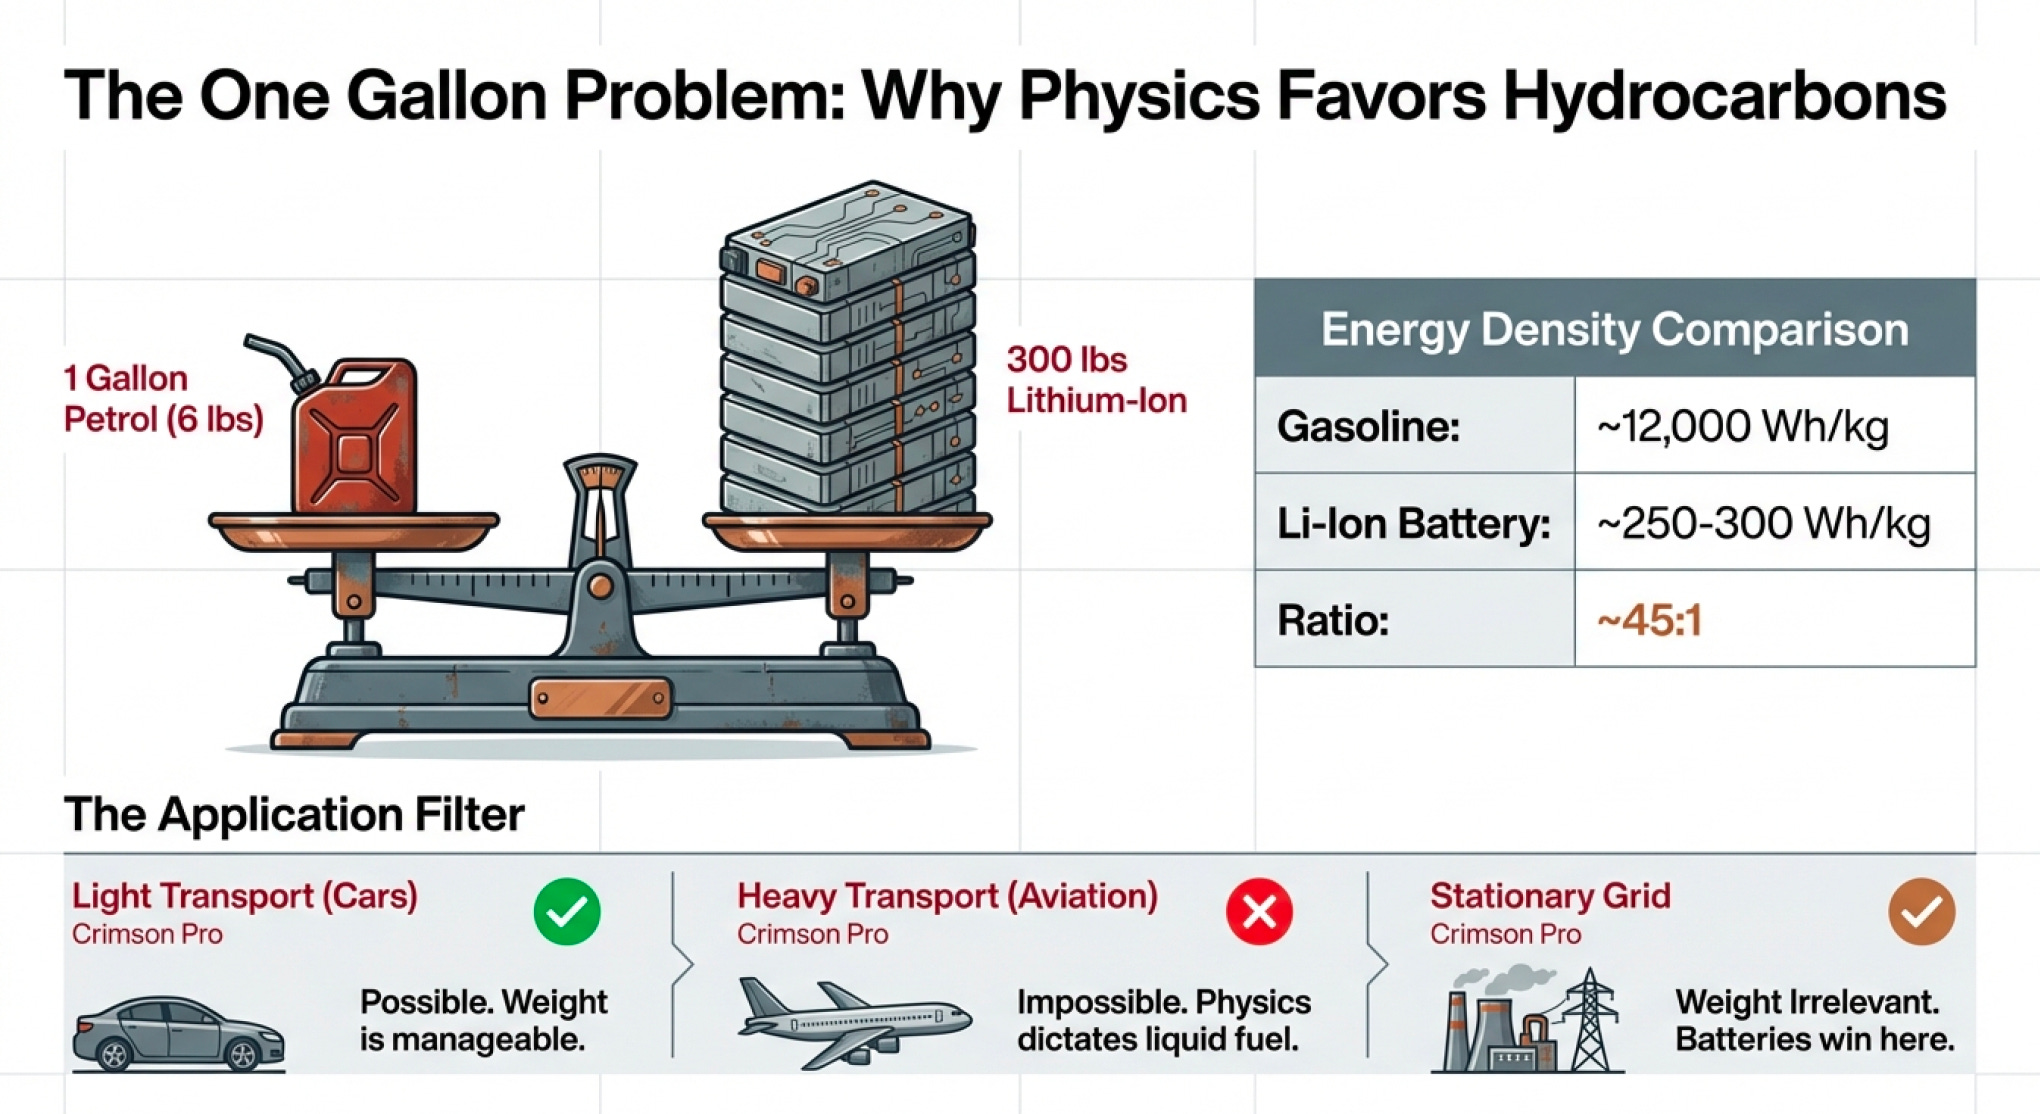
A typical gas tank holds 15 gallons. That’s 4,500 pounds of battery equivalent. Good luck driving that around—you’d need a semi-truck just to carry the batteries, and then you’d need batteries to move the truck carrying the batteries.
Gasoline is incredibly energy-dense: 33.7 kilowatt-hours per gallon. Today’s best lithium-ion battery packs achieve about 0.25-0.3 kWh per kilogram (0.11-0.14 kWh per pound). Do the math: 33.7 kWh / 0.11 kWh per pound ≈ 306 pounds of batteries per gallon-equivalent of gasoline.
This is why the history of alternative energy is littered with failed companies and broken promises. The physics is brutal. You’re fighting against energy density that nature spent millions of years concentrating into hydrocarbon molecules.
But—and this is the crucial insight—you only need to carry those 300 pounds of batteries if you’re using them for transportation. For stationary applications like grid storage, weight doesn’t matter. Suddenly batteries become economically viable at $70-115/kWh instead of needing to be an order of magnitude cheaper.
This is why stationary battery storage deployment exploded 73% in 2024 while EV adoption is growing but still facing headwinds. Different applications, different physics constraints, different economics.
The Physics That Won’t Negotiate
Now let’s talk about the laws that determine what’s actually possible—because in infrastructure investing, understanding physical limits matters more than understanding market sentiment.
Carnot’s Law: The Efficiency Ceiling Nobody Can Break
In 1824, a young French engineer named Nicolas Léonard Sadi Carnot asked a deceptively simple question: “What’s the maximum possible efficiency of a heat engine?”
He was watching steam engines power the Industrial Revolution, noticing that they wasted enormous amounts of energy, and wondering whether perfect engineering could make them 100% efficient.
The answer he discovered is both beautiful and cruel: No heat engine can be 100% efficient. Ever. And there’s a mathematical ceiling on how efficient it can be based solely on temperature differences.
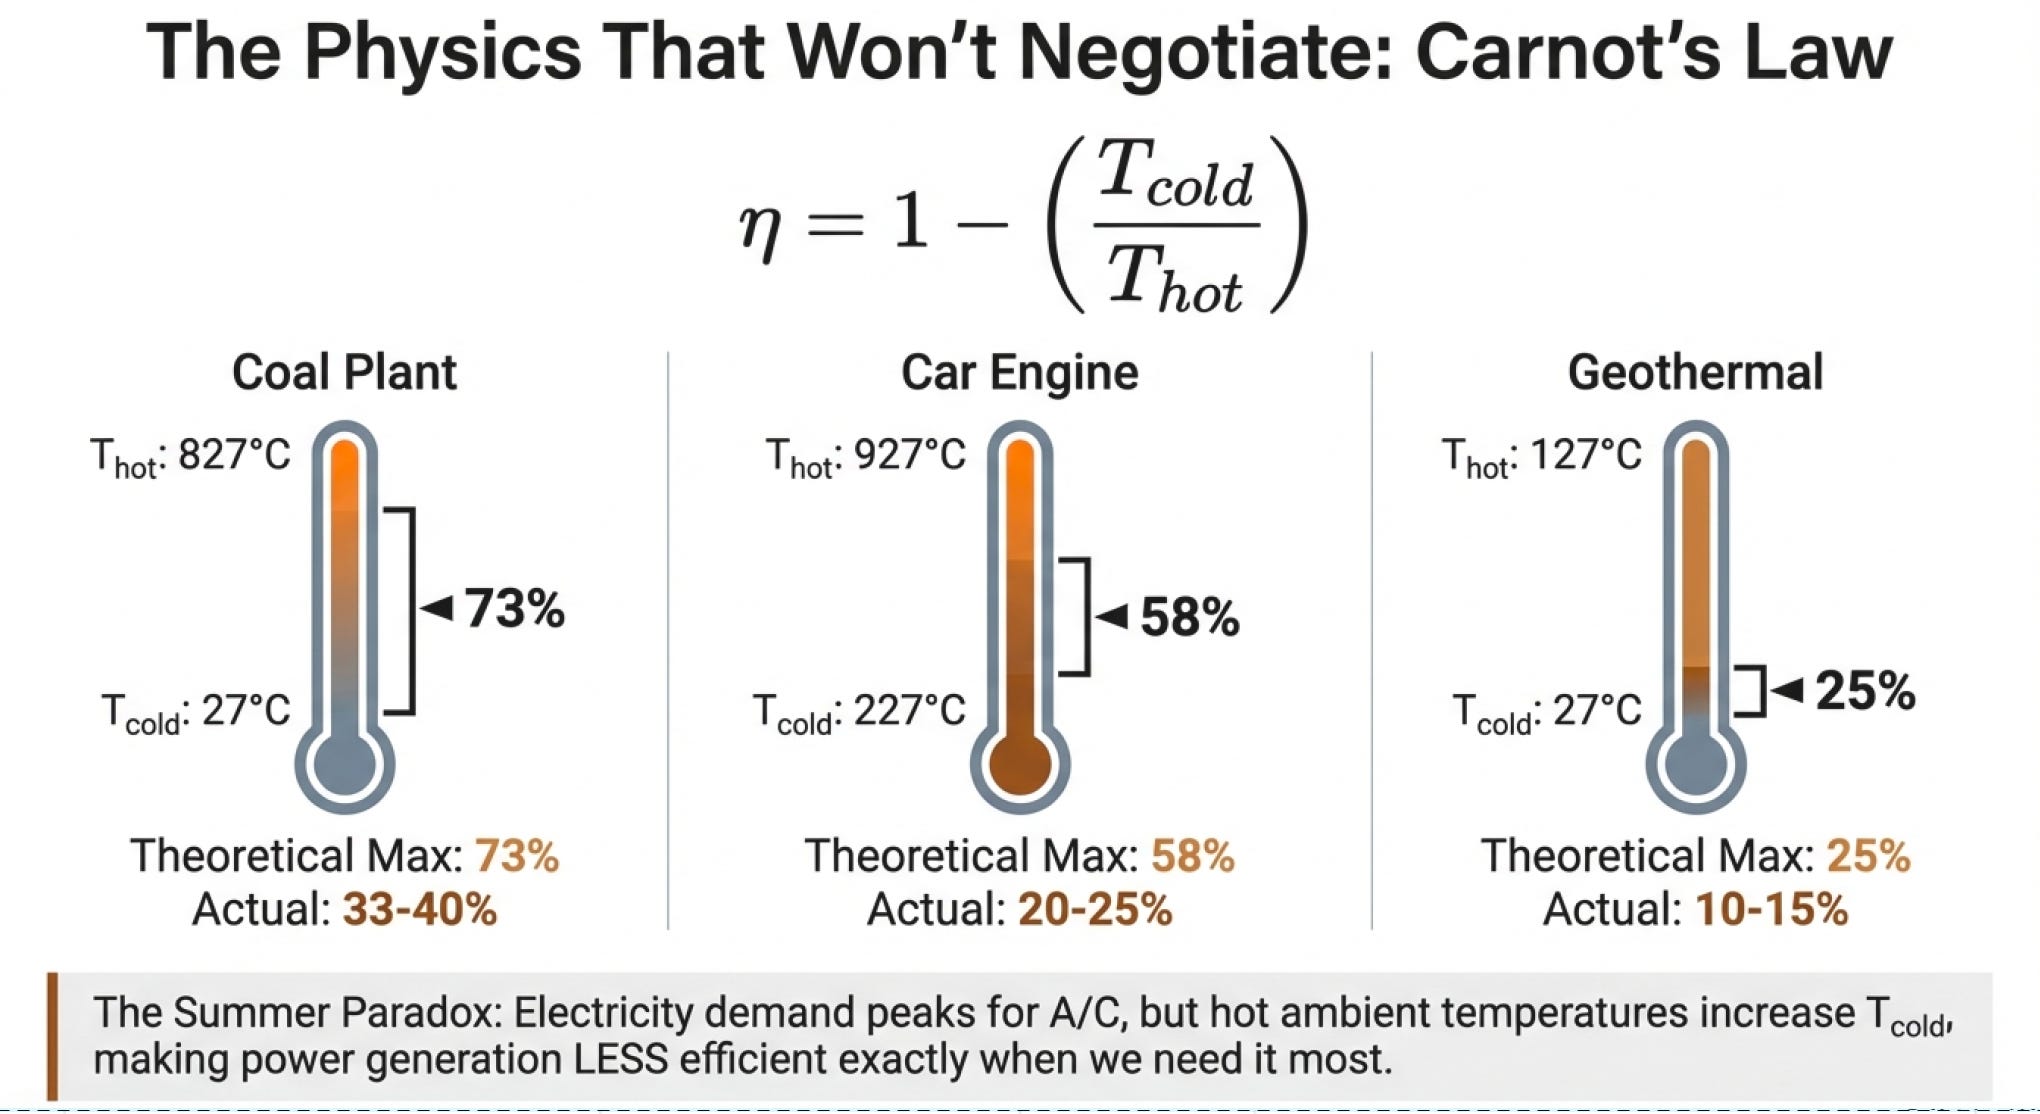
The Carnot efficiency formula is: η = 1 - (T_cold / T_hot)
Where temperatures are in Kelvin (absolute temperature scale).
Let me show you why this matters with real numbers:
Modern coal power plant:
Combustion chamber: ~1,100 K (827°C)
Exhaust/cooling: ~300 K (27°C)
Maximum theoretical efficiency: 1 - (300/1100) = 72.7%
Actual efficiency achieved: 33-40%
Car engine:
Combustion: ~1,200 K (927°C)
Exhaust: ~500 K (227°C)
Maximum theoretical efficiency: 1 - (500/1200) = 58.3%
Actual efficiency achieved: 20-25%
Geothermal power plant:
Heat source: ~400 K (127°C)
Cooling: ~300 K (27°C)
Maximum theoretical efficiency: 1 - (300/400) = 25%
Actual efficiency achieved: 10-15%
See the pattern? The hotter your heat source and the colder your cooling, the more efficient you can theoretically be. But even with perfect engineering (zero friction, perfect insulation, ideal conditions), you’re still bounded by Carnot’s Law.
This is why nuclear power plants push steam temperatures as high as materials can withstand. It’s why concentrated solar power systems use mirrors to create extremely high temperatures. It’s why cryogenic cooling is so appealing theoretically—if you could cool to near absolute zero, efficiency would approach 100%.
But here’s the practical reality: Every real-world heat engine operates at 50-70% of its Carnot limit due to friction, heat loss, imperfect combustion, and material constraints.
And here’s the cruel joke: Summer is when electricity demand peaks (air conditioning), but hot ambient temperatures reduce the efficiency of generating that electricity. Your exhaust temperature (the cold sink in Carnot’s formula) is higher, so maximum possible efficiency drops. You need more power precisely when generating it becomes less efficient.
Utilities solve this by charging 2-3x more during peak times (time-of-use metering), which reduces demand but makes energy more expensive exactly when people need it most.
Why Fuel Cells Are Different—and Why That Matters
Now here’s something fascinating: fuel cells don’t operate on the Carnot cycle.
Carnot’s Law applies to heat engines—devices that convert thermal energy to work. But fuel cells convert chemical energy directly to electrical energy through electrochemical reactions, not combustion. They never create high-temperature heat as an intermediate step.
This is why fuel cells can theoretically be much more efficient than combustion engines—they’re not limited by Carnot efficiency. A hydrogen fuel cell can achieve 50-60% efficiency converting hydrogen’s chemical energy directly to electricity.
The catch? You still need to produce the hydrogen, which typically involves either:
Steam reforming natural gas (creates CO2, ~70-80% efficient)
Electrolysis of water (requires electricity, ~70-80% efficient)
So while the fuel cell itself is efficient, the full chain from primary energy to useful work often isn’t dramatically better than advanced combustion systems. But—and this is crucial—fuel cells provide flexibility in where and when you do the energy conversion. That optionality has value in certain applications even if raw efficiency isn’t revolutionary.
This pattern repeats constantly in alternative energy: a technology that seems revolutionary in isolation often faces constraints when you analyze the full system. Fuel cells are great. Hydrogen production is hard and energy-intensive. Both things are true.
Seven Problems That Make Everyone’s Life Difficult
Now let’s walk through the obstacles that make alternative energy infrastructure so challenging to build at scale. These aren’t political problems or regulatory problems—these are fundamental physics and engineering constraints that money alone can’t solve.
Problem 1: Global Warming—The Externality That Became Everybody’s Problem
In 2024, energy-related CO2 emissions exceeded 40 gigatons for the first time ever. China alone accounted for 39% of total emissions (5,491 million tons), followed by the US at 11% (1,570 million tons).
The Earth’s atmosphere contains greenhouse gases (CO2, methane, nitrogen oxides) that act like an invisible blanket, trapping heat. We’ve known since the 1960s that increasing concentrations would warm the planet. What we underestimated was the pace and consequences.
Catastrophic weather events in the US have increased fivefold since 1970. In 2024, intense heatwaves in China and India contributed more than 90% of the total annual increase in global coal consumption—because people turned on air conditioning en masse.
This creates a vicious cycle: Heat → increased cooling demand → more electricity needed → more fossil fuel combustion → more heat. And the faster you need to build energy capacity, the more you default to whatever’s cheapest and fastest to deploy—which remains fossil fuels in most markets.
But here’s what makes this interesting as an infrastructure investment problem: The cost of doing nothing is now becoming visible in real-time.
Insurance companies are withdrawing from coastal markets. Agricultural yields are becoming more volatile. Supply chains are getting disrupted by extreme weather. These are measurable economic costs, not distant hypotheticals.
From an investor’s perspective, this creates both risk and opportunity. Risk: any long-lived infrastructure asset (power plants, transmission lines, coastal facilities) faces climate-related impairment. Opportunity: any technology that genuinely reduces emissions at competitive cost will find enormous demand.
The catch is that last phrase: “at competitive cost.” Because...
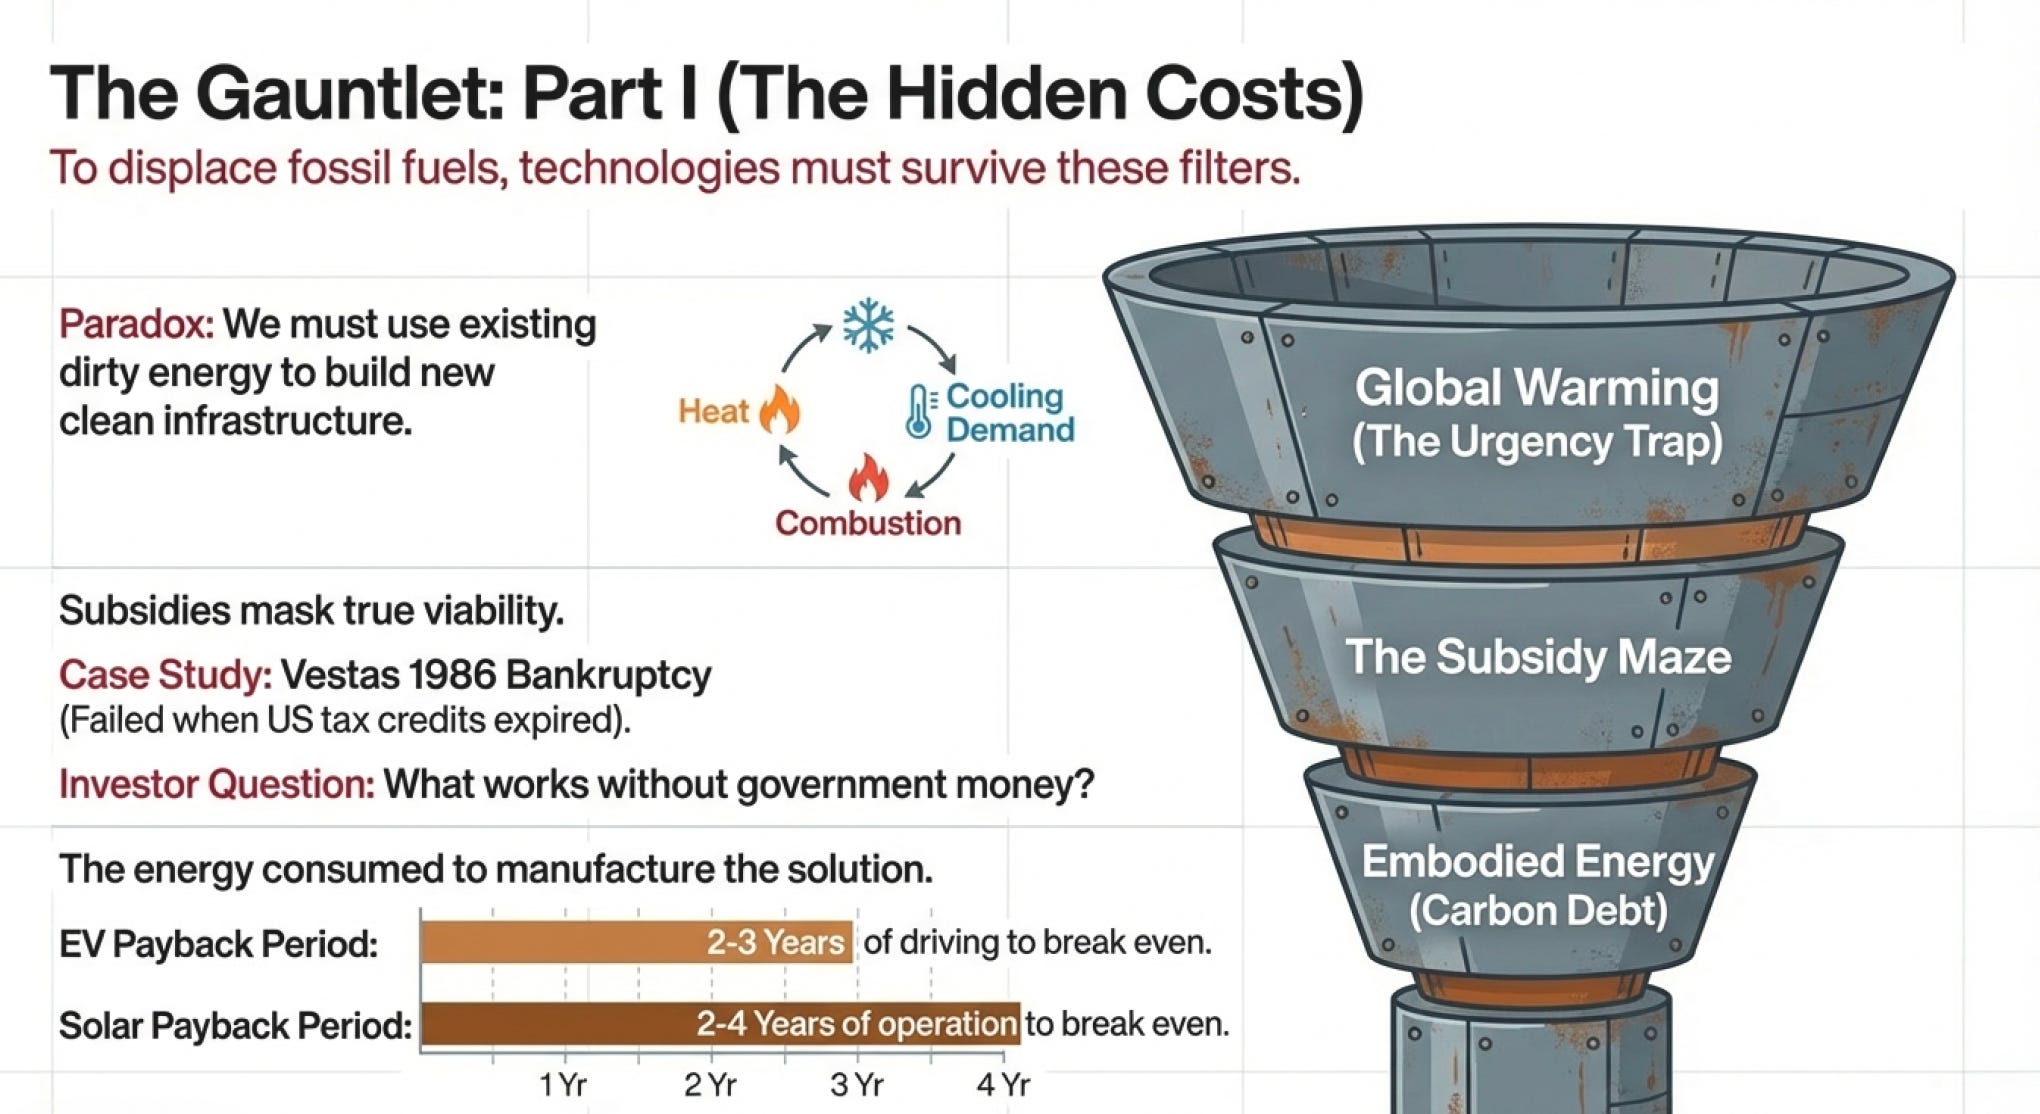
Problem 2: The Subsidy Maze—When Government Support Makes Economics Weird
The US Investment Tax Credit for solar is estimated to cost taxpayers $131.44 billion. Wind production tax credits cost billions more. EV purchase subsidies range from $7,500 to $12,500 per vehicle depending on requirements.
These subsidies make renewable energy artificially cheaper for consumers while masking the true economics for investors trying to evaluate what works without government support.
Here’s a thought experiment: If solar panels cost $0.043/kWh unsubsidized and coal power costs $0.05-0.06/kWh, solar wins on pure economics. But if solar costs $0.08/kWh without subsidies and gets to $0.043/kWh only with tax credits, what happens when political winds shift and subsidies disappear?
Answer: You get the 1986 Vestas bankruptcy. US tax credits for wind expired, overnight making turbines economically unviable, killing the company that had pioneered the industry.
Smart infrastructure investors need to understand: What works with subsidies? What works without? And what’s the probability subsidies persist for 20+ years?
Solar and wind now genuinely work without subsidies in many markets—91% of newly commissioned utility-scale renewable projects in 2024 produced electricity cheaper than fossil fuel alternatives. But in other markets, subsidies remain essential. Knowing the difference matters enormously for 20-30 year infrastructure investments.
Problem 3: Embodied Energy—The Carbon Cost Hidden in Manufacturing
Here’s where everyone’s favorite example—electric vehicles—gets complicated.
An EV produces zero emissions while driving. Fantastic! But manufacturing the battery requires enormous energy. A typical 75 kWh EV battery pack requires roughly 15-20 MWh of energy to manufacture (depending on assumptions). If that energy comes from coal-fired power plants (as it does for much Chinese battery manufacturing), the EV starts life with a carbon debt of ~10-15 tons of CO2.
A gasoline car produces about 5 tons of CO2 per year with typical driving. So the EV needs 2-3 years just to “break even” on its manufacturing carbon debt, assuming its electricity comes from clean sources. If the electricity comes from coal power, break-even takes longer.
This is called “invested energy” or “grey energy”—the total energy consumed in manufacturing, not just operation.
Solar panels face the same issue. Manufacturing photovoltaic cells requires high temperatures, precise chemical processes, and energy-intensive purification of silicon. Most of that energy currently comes from fossil fuels. A solar panel needs to operate for 2-4 years just to generate the equivalent of the energy that went into making it.
None of this means EVs or solar panels are bad ideas—they work extremely well over their full lifecycle. But it does mean: The transition to alternative energy itself requires massive amounts of energy, most of which initially comes from fossil fuels.
This is why global fossil fuel consumption can hit records even as renewable deployment explodes. We’re using fossil fuels to build the infrastructure that will eventually replace fossil fuels. It’s thermodynamically unavoidable in the short term.
Problem 4: Intermittency—When the Wind Stops and the Sun Sets
In 2024, wind capacity additions remained high globally, but generation growth was constrained by lower wind speeds in some regions—especially China and the EU. You can build all the turbines you want, but if the wind doesn’t blow, you get no power.
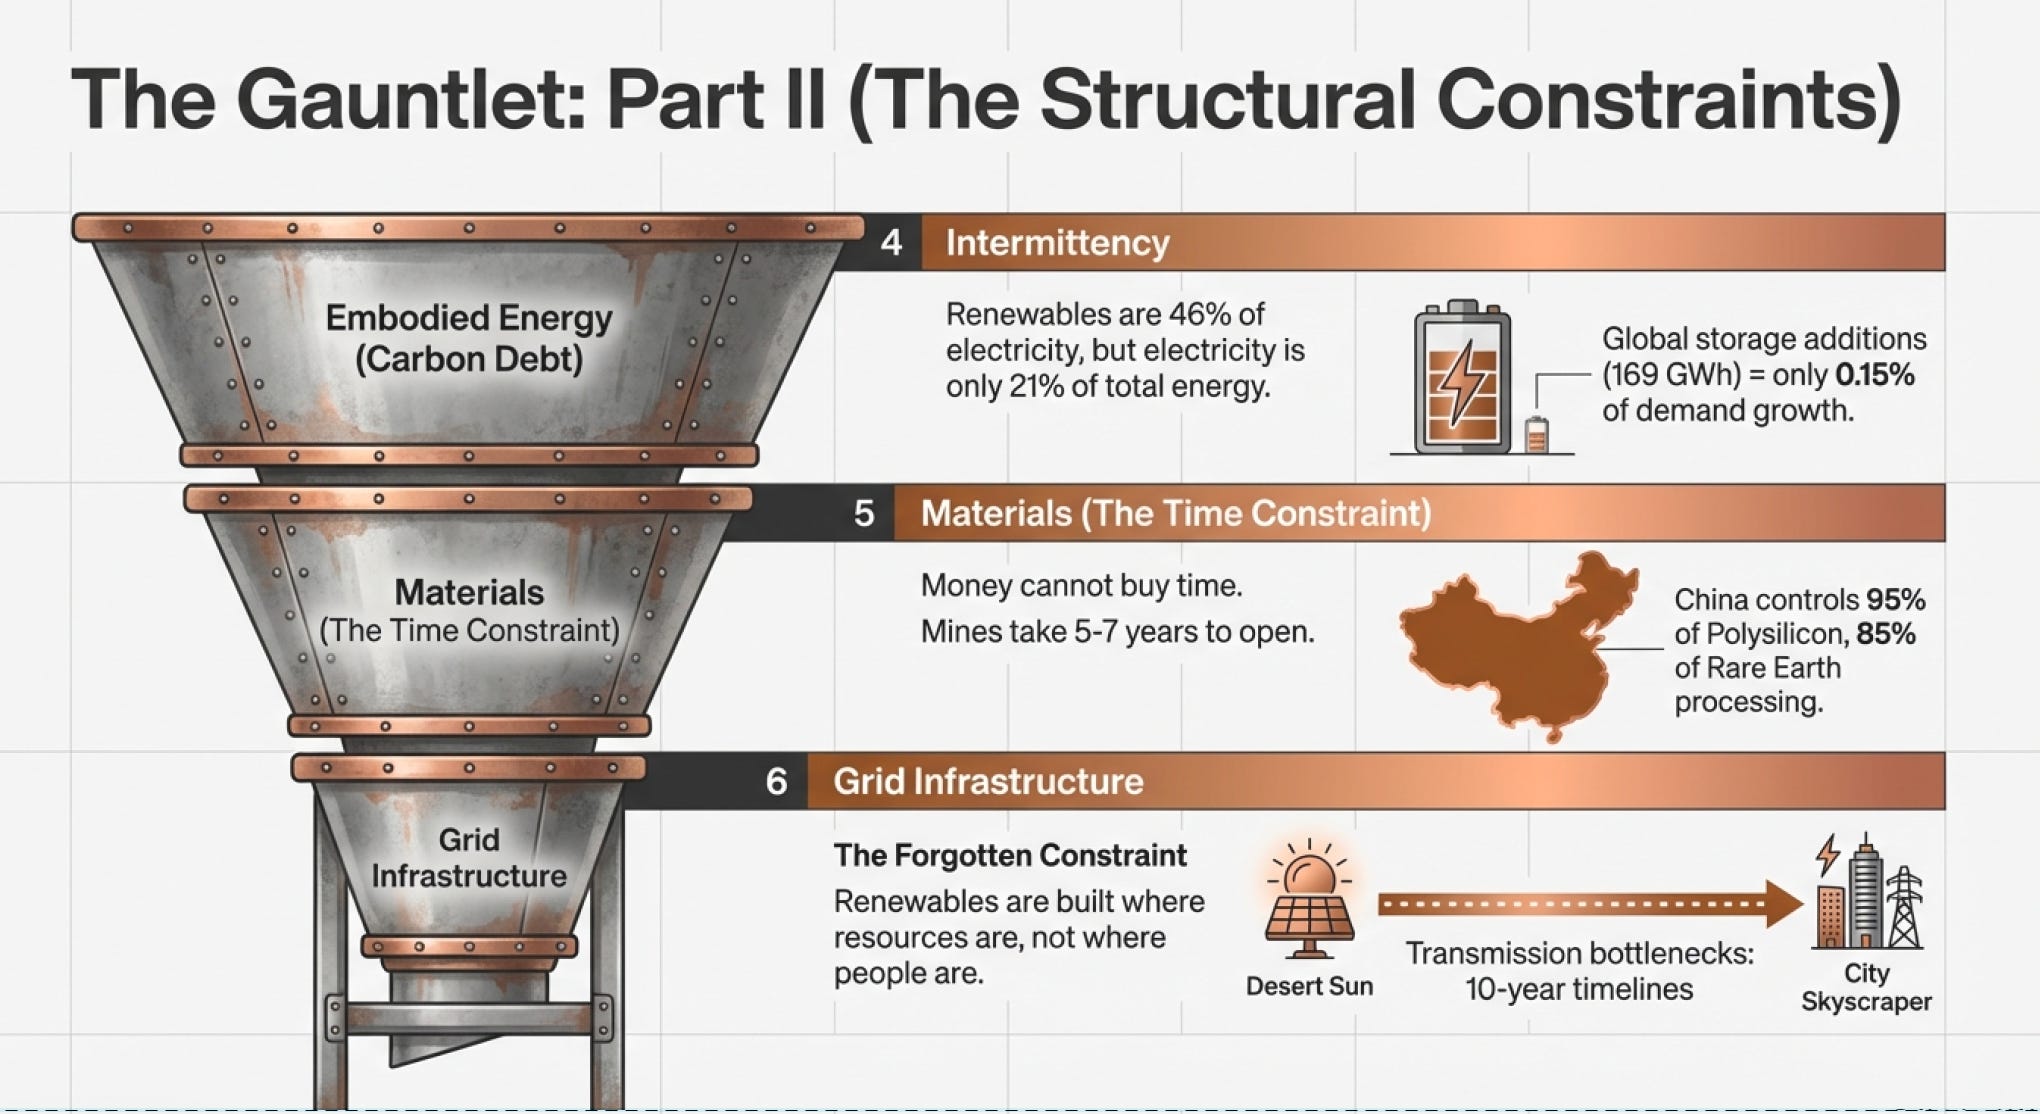
Solar and wind now provide 46% of global electricity generation, but electricity is only 21% of final energy consumption. Do the math: renewables are roughly 10% of total global energy. They’re growing fast but from a small base.
And every megawatt of solar or wind capacity needs backup for when nature doesn’t cooperate. That backup typically comes from:
Natural gas peaker plants (fast-starting, flexible, but fossil fuel-based)
Battery storage (expensive, limited duration, but improving rapidly)
Hydropower (geographically limited, often at capacity)
Interconnection (share power across regions, requires massive transmission investment)
In 2024, utility-scale battery storage deployment grew 73% year-over-year globally, adding 69 GW / 169 GWh. That sounds impressive until you realize global electricity demand increased by 1,100 TWh. We added storage capacity equal to about 0.15% of annual electricity demand growth.
Ember research in 2025 found that storing 50% of a day’s solar generation (with the help of batteries) adds just $33/MWh to the total cost of solar PV. At an average solar price of $43/MWh, this means dispatchable solar power (solar + storage) delivers electricity on demand for about $76/MWh—competitive with fossil fuels.
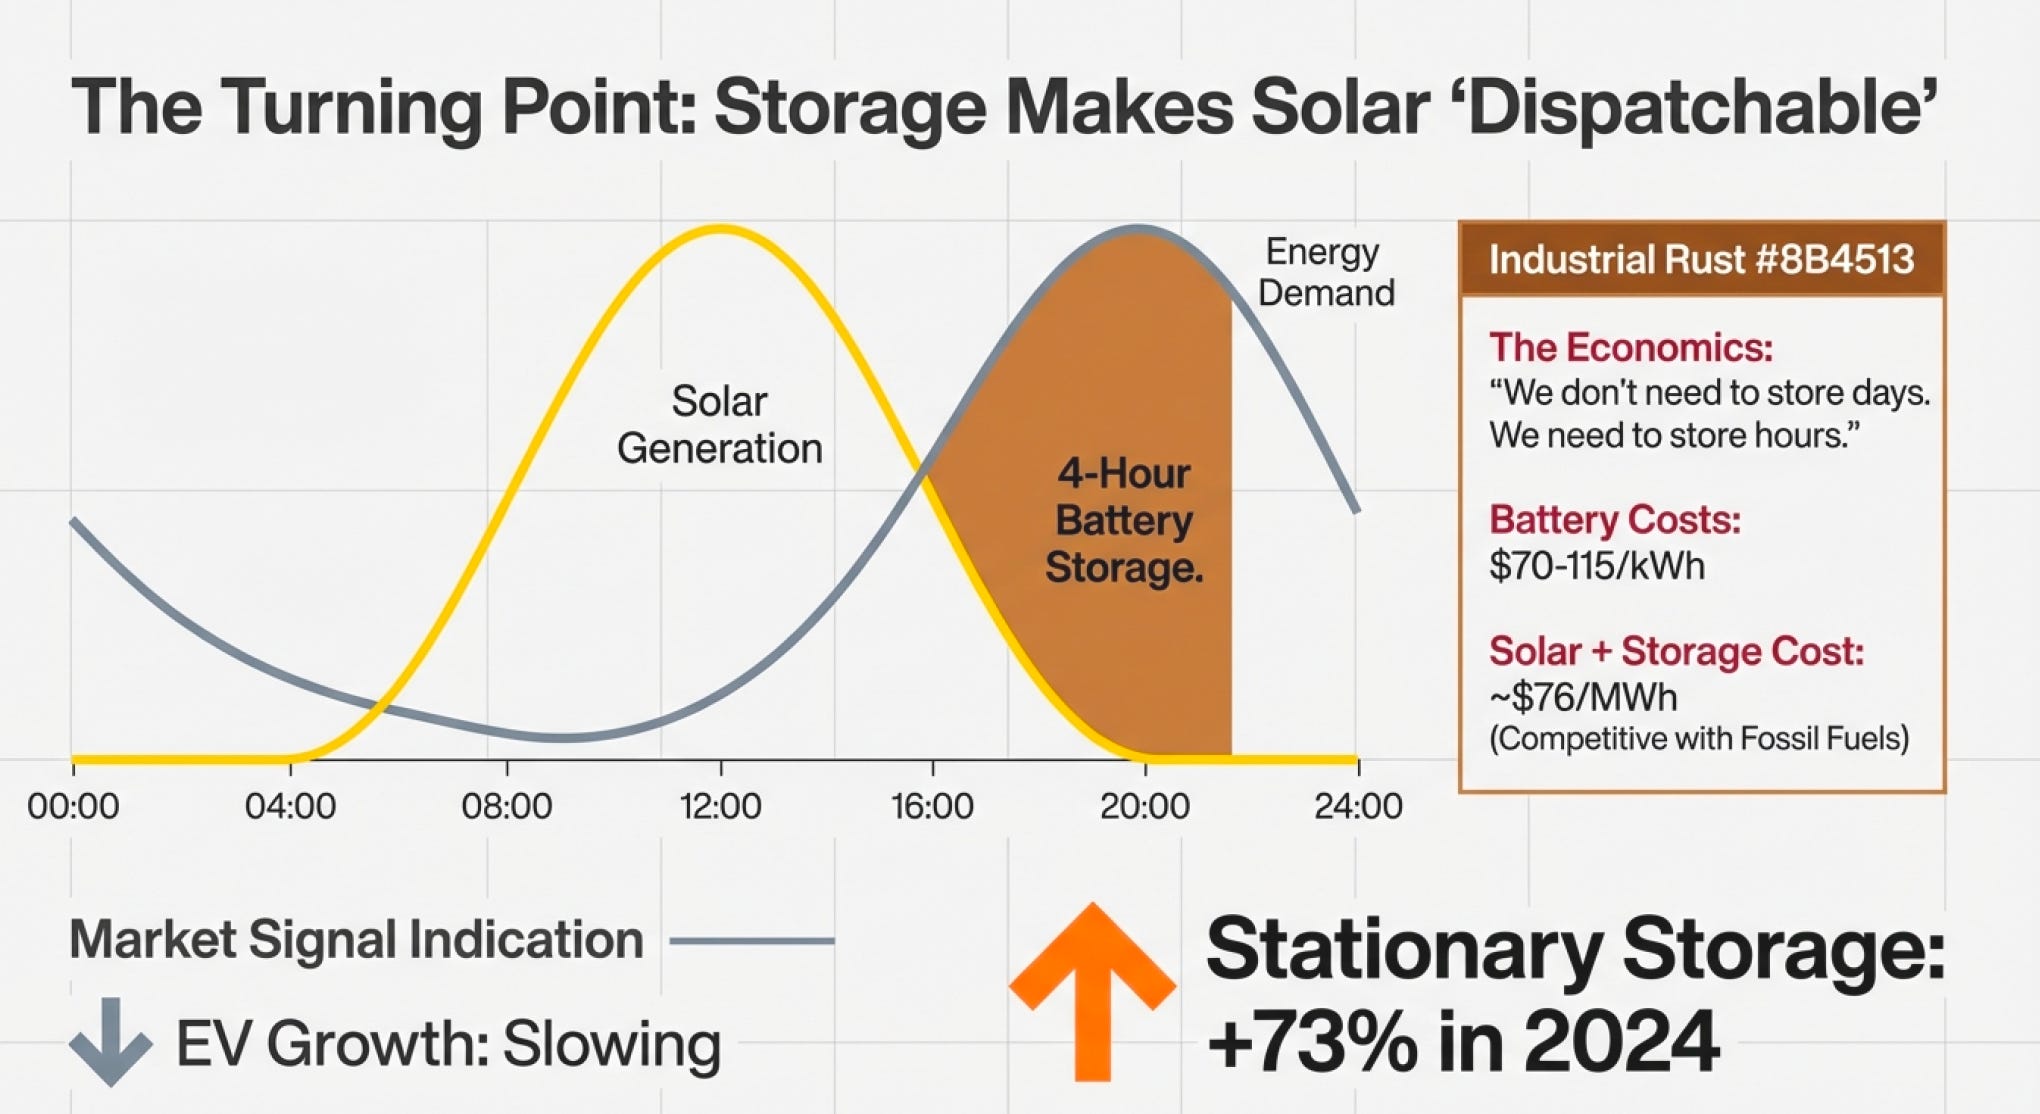
This is the inflection point. Storage is now cheap enough that intermittency becomes manageable rather than disqualifying. But we need to scale storage deployment by 10-100x, which requires enormous capital, manufacturing capacity, and raw materials.
Problem 5: Energy Density—Physics Sets the Payload
Remember the 300 pounds of batteries per gallon of gasoline equivalent? That’s energy density, and it determines what’s possible in transportation.
Energy density by fuel:
Gasoline: 12,000 Wh/kg
Diesel: 13,500 Wh/kg
Natural gas: 13,900 Wh/kg
Hydrogen (compressed at 700 bar): 33,600 Wh/kg (but low volumetric density)
Lithium-ion batteries: 250-300 Wh/kg
Fossil fuels have 40-50x the energy density of batteries by weight.
This is why:
Light-duty vehicles (cars, SUVs) can go electric—carrying 500-1,000 kg of batteries is manageable
Heavy trucks struggle—you’d need so many batteries that payload capacity suffers
Aviation can’t go battery-electric at all—weight is absolutely critical, and batteries are too heavy
Shipping faces similar constraints—range and payload make batteries impractical for most routes
Hydrogen looks attractive on paper (very high energy density by weight), but it’s a nightmare by volume. Even compressed to 700 bar, hydrogen has low volumetric energy density—you need large tanks, which partially offsets the weight advantage.
This is why different energy carriers will likely dominate different applications:
Batteries for light vehicles and stationary storage
Liquid fuels (gasoline, diesel, or synthetic e-fuels) for aviation and long-haul shipping
Possibly hydrogen for some industrial processes and heavy transport
Grid electricity for everything else that can be electrified
Anyone promising one technology will replace fossil fuels across all applications is either ignorant of the physics or lying.
Problem 6: Materials and Manufacturing—The Supply Chain That Doesn’t Exist Yet
To meet climate goals, the world would need roughly 9 TW of wind and solar capacity by 2030. Currently, announced projects total 4.5 TW—and most won’t be built on time.
Even hitting 4.5 TW requires:
Polysilicon: China already produces ~95% of global supply
Rare earth elements (neodymium, dysprosium for wind turbines): China processes ~85% of global supply
Lithium, cobalt, nickel (for batteries): Geographically concentrated supply, often in politically unstable regions
Copper (for wiring, motors, transformers): Already facing supply constraints
BloombergNEF estimates that to support projected EV and battery storage growth, lithium supply needs to increase 8-fold by 2030, cobalt 3-fold, and nickel 4-fold. Current investment in mining capacity isn’t on track to meet this.
The constraint isn’t money or technology—it’s time. Opening a new lithium mine takes 5-7 years from discovery to production. Scaling polysilicon production takes years. Training workers takes years. Building supply chains takes years.
This is why China’s dominance is so durable. They’ve been building this supply chain for 20+ years. You can’t replicate that in 5 years by throwing money at the problem.
Problem 7: Grid Infrastructure—The Transmission Nobody Wants to Fund
In 2024, power grid investment grew to $359 billion globally—up 14%, but barely adequate for the required expansion.
Here’s the problem: Renewable energy is often generated far from where people live, requiring massive transmission infrastructure.
Solar farms in deserts need transmission lines to cities. Offshore wind farms need undersea and underground cables to shore. And unlike power plants (which can be built near load centers), you build renewables where the resources are, not where the demand is.
Installing transmission lines requires:
Land acquisition and rights-of-way
Environmental reviews (often taking 5-10 years)
Local opposition (NIMBY—”not in my backyard”)
Coordination across jurisdictions
Enormous upfront capital before any revenue
It’s the infrastructure that everyone needs and nobody wants to fund because returns are regulated, timelines are uncertain, and political risk is high.
Germany built massive offshore wind capacity only to discover they hadn’t built adequate transmission to get the power onshore. Texas’s power grid failed in 2021 partly because renewables-heavy generation lacked adequate backup and interconnection. California curtails (wastes) huge amounts of solar generation because transmission can’t move it to where it’s needed.
Grid infrastructure is the forgotten constraint. You can build all the solar and wind you want, but without transmission and storage, it remains stranded capacity that can’t serve actual demand.
What Actually Works—and Why Most People Get This Wrong
After walking through all those obstacles, here’s what actually makes sense from an infrastructure investment perspective—not what politicians promise, not what startups claim, but what the physics and economics support:
Solar PV: The Unexpected Winner
Nobody in 2000 thought solar would be the dominant renewable by 2025. Wind seemed more promising—larger installations, better capacity factors, established technology.
Then something remarkable happened: Solar panel prices fell 93% from 2010 to 2024 (from $2,571/kWh to $115/kWh for battery packs, and similar trajectories for solar modules). This wasn’t one breakthrough—it was compounding improvements in manufacturing, materials, and scale.
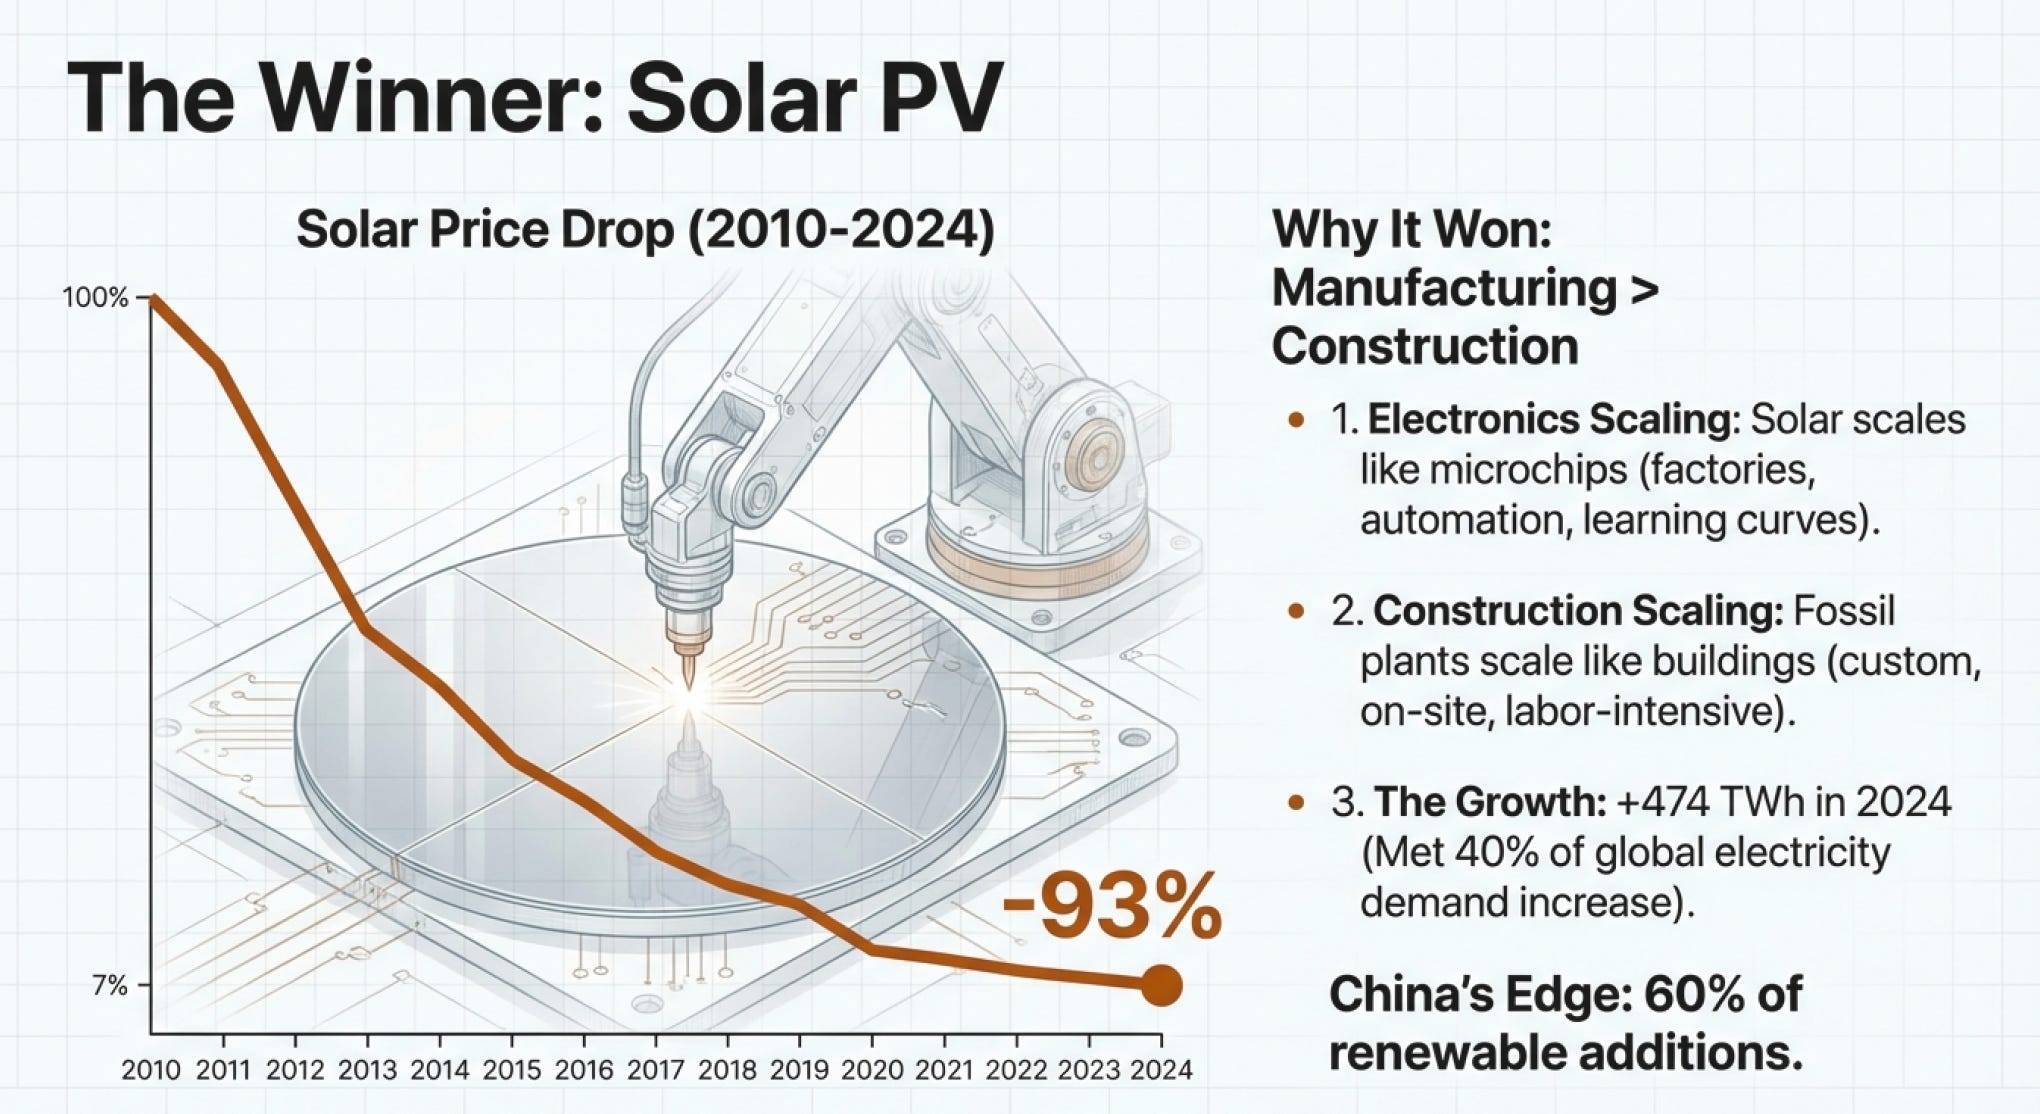
In 2024, solar generation increased by 474 TWh (+29%)—the largest annual growth ever recorded in absolute terms. Solar met 40% of the global increase in electricity demand. One technology. Forty percent of global growth.
Why did solar win?
Manufacturing scales better than installation scales. Solar panels are manufactured in factories with automated processes. Once you optimize the factory, each additional unit costs nearly the same. Wind turbines require on-site installation of massive components—harder to scale.
Distributed deployment is possible. You can put solar on rooftops, parking lots, brownfield sites—anywhere sun hits. Wind requires specific geography and large projects. Solar democratizes deployment.
Learning curves compound. The more panels you manufacture, the better you get at manufacturing. China’s 60% share of renewable power additions in 2024 gave them unmatched learning curve advantages.
Maintenance is minimal. Solar panels sit there. They don’t have moving parts (except tracking systems, which are optional). Wind turbines have complex gearboxes, bearing, blades subject to fatigue. Lower maintenance = lower operating costs.
The result: Solar is now the cheapest electricity source in most markets ($0.043/kWh global average), even cheaper than existing fossil fuel plants.
Wind: The Steady Partner
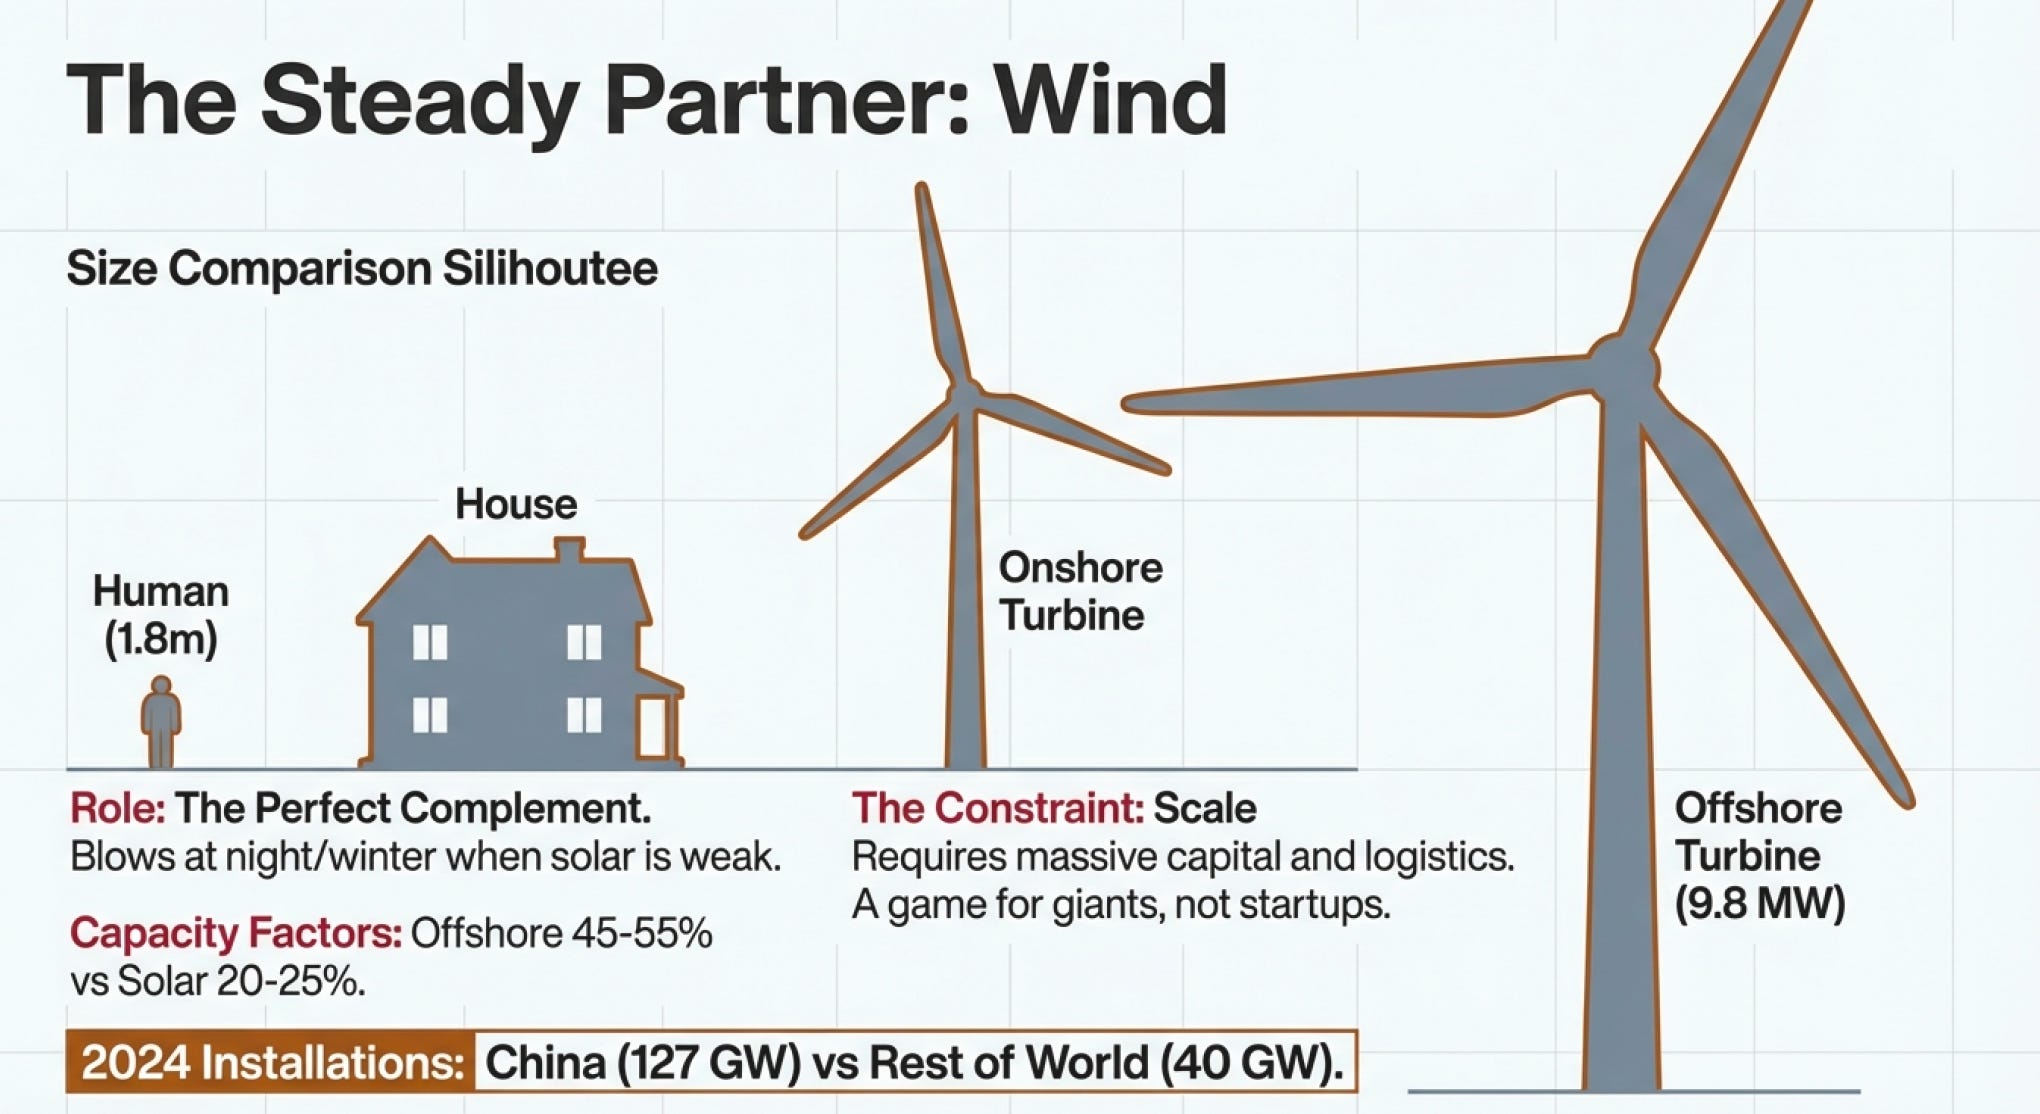
Wind installed 127 GW in China alone in 2024 (versus 40 GW for the entire rest of the world). Global wind capacity is approaching 1,000 GW cumulative.
Wind works because:
Capacity factors are higher than solar. Modern onshore turbines operate at 35-45% capacity factor, offshore 45-55%. Solar is typically 20-25%. This means less installed capacity needed for the same energy output.
Offshore wind is just getting started. Average offshore turbine size reached 9.8 MW in 2024, nearly 2x onshore. As turbines get larger, offshore wind economics improve dramatically.
Wind complements solar. Wind often blows more at night and during winter when solar is weakest. Geographic diversification of both creates more reliable combined output.
The constraint: Wind needs scale to be economic. Individual turbines cost millions. Projects require hundreds of megawatts to justify development costs. This favors large utilities and developers, not distributed deployment.
Batteries: The Enabler
At $70-115/kWh, batteries crossed the threshold where grid-scale storage becomes economically viable without subsidies in many applications.
Batteries solve the intermittency problem—not completely, but enough. Ember research showed that solar + 4-hour battery storage delivers electricity for $76/MWh, competitive with fossil fuels. As batteries get cheaper, dispatchable renewable power becomes the default choice.
The inflection point everyone missed: Batteries don’t need to store days of electricity. They need to store hours. Most electricity demand variation is diurnal (daily cycle). Four to eight hours of storage smooths out most problems. Longer-duration storage can be handled by other technologies (hydrogen, pumped hydro, interconnection).
China accounted for 49% of global battery investment in 2024. CATL and BYD control 55% of global EV battery market. The learning curves and scale advantages are already established.
Nuclear: The Reliable Baseload Nobody Wants to Build
In 2024, nuclear capacity additions reached a five-decade high at 7+ GW. Nuclear generation increased 69 TWh (+2.5%), driven largely by higher utilization in France.
Nuclear provides:
Baseload power (runs 24/7 regardless of weather)
Zero carbon emissions during operation
Compact footprint (small land area per energy output)
Decades-long lifespan (40-80 years with refurbishment)
The problems:
Extremely high upfront costs ($6-10 billion per GW of capacity)
Long construction timelines (10-15 years in most Western markets)
Political opposition despite excellent safety records
Nuclear waste storage (technically solvable, politically difficult)
France generates 75% of electricity from nuclear. They store decades of waste beneath one room’s floor in La Hague, Normandy. The technical problem is solved. The political problem persists.
Small modular reactors (SMRs) promise lower costs and faster deployment, but haven’t yet proven economics at scale. They might be the future—or another decade of overpromising and underdelivering.
What Doesn’t Work (Yet)
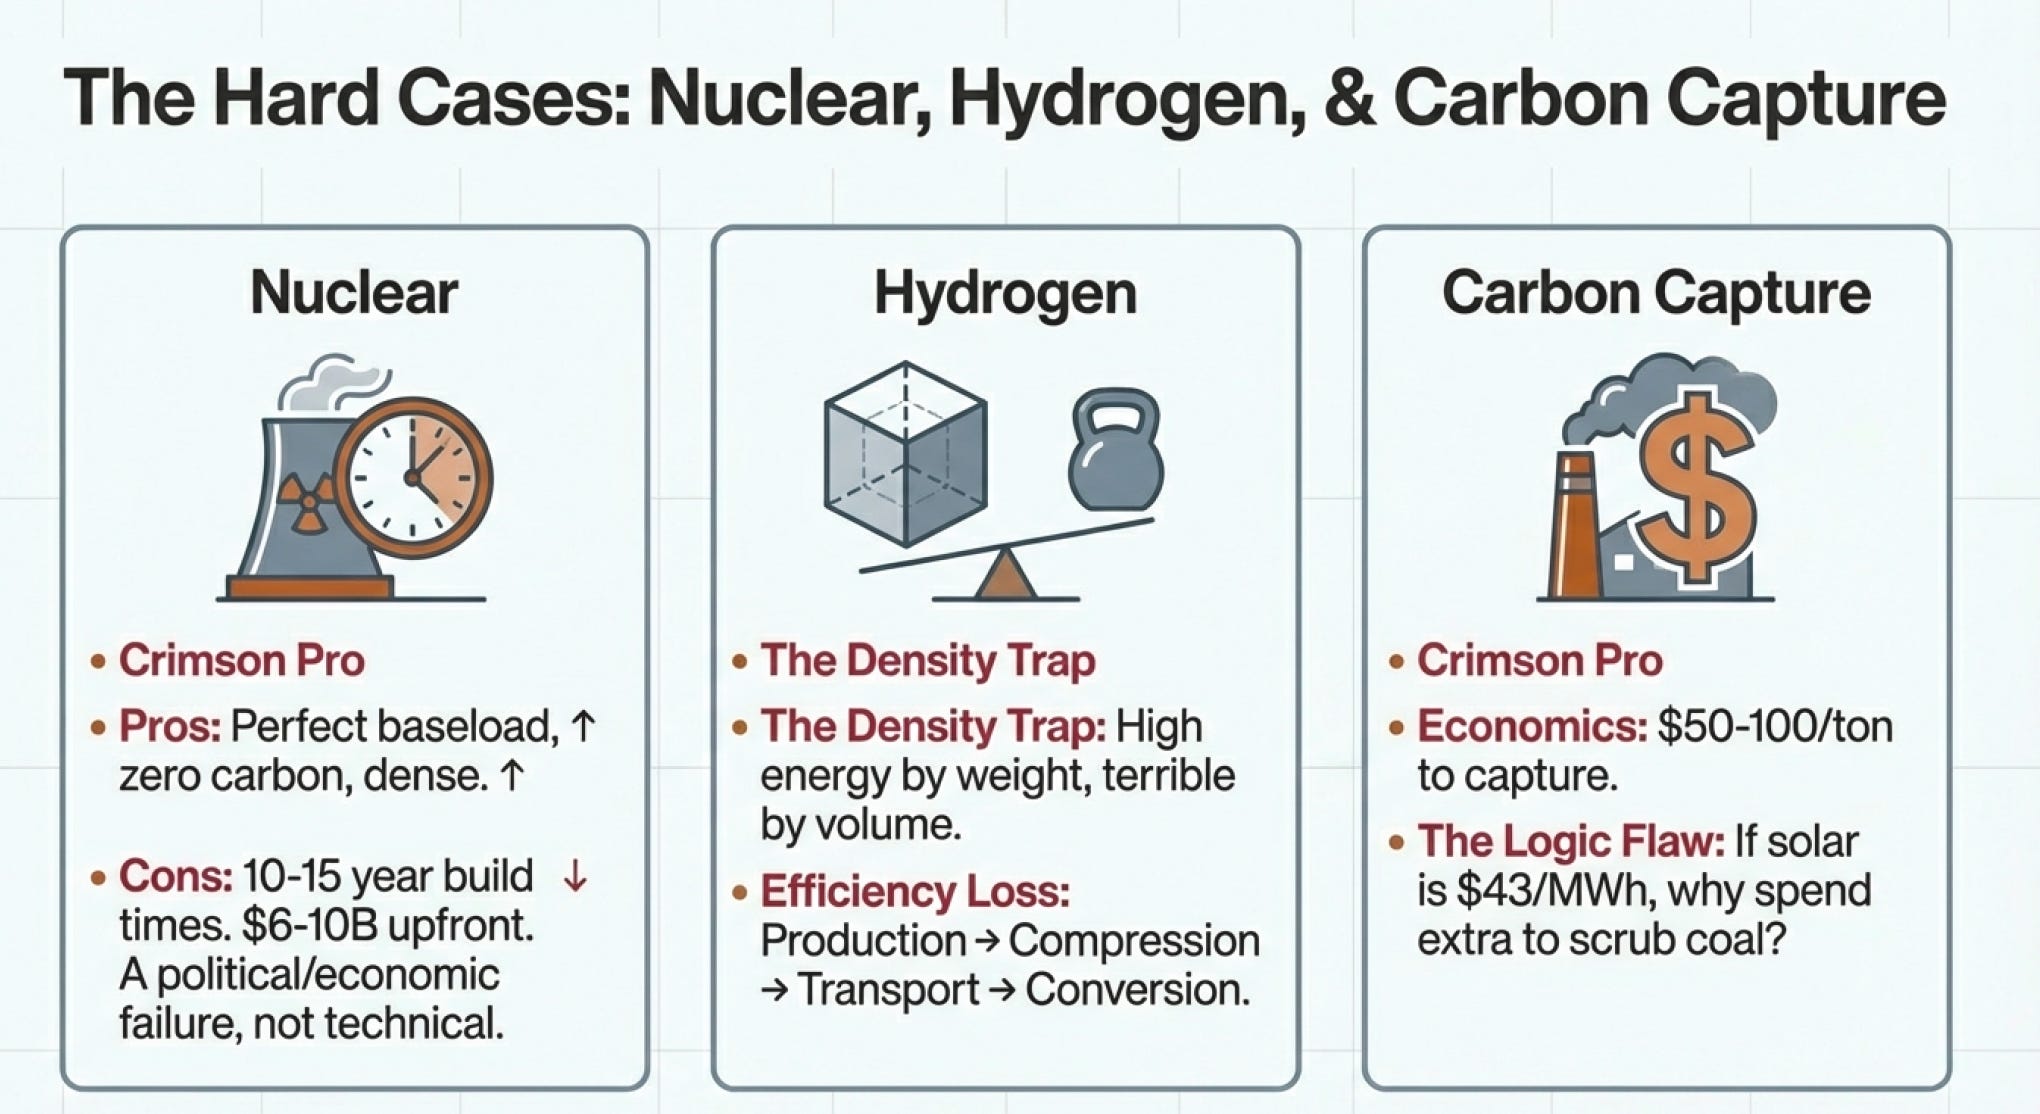
Hydrogen economy: Needs to produce hydrogen, compress or liquefy it, transport it, store it, and convert it back to useful energy. Each step has efficiency losses. Current technology makes hydrogen expensive compared to alternatives in most applications.
Biofuels at scale: Energy crops can provide 6x the energy required to produce them, but land use requirements are enormous. You can’t replace global oil consumption with biofuels without converting vast agricultural areas to energy crop production. While biofuels offer lower tailpipe emissions than gasoline, they aren’t inherently “green” due to significant environmental costs, including deforestation for crops, competition with food supplies, heavy water/land use, and pollution from intensive farming and processing, meaning some biofuels can emit more greenhouse gases (GHGs) over their lifecycle than fossil fuels, with sustainable options requiring careful lifecycle analysis and stricter regulations.
Carbon capture: Technically feasible but economically questionable. Costs typically $50-100+ per ton of CO2 captured. Most companies pursuing this want subsidies to make economics work. If you can generate solar electricity for $43/MWh, why spend money capturing carbon from fossil combustion?
These might improve. But from an infrastructure investor’s perspective, betting on technologies that need breakthrough economics or dramatic cost improvements is speculation, not investment.
The Infrastructure That Must Be Built
Now we arrive at the bridge to our next section on Business & Competitive Landscape.
We’ve established what the physics allows, what the economics support, and what the constraints are. Now the question becomes: Who’s actually building this infrastructure? And why are some companies succeeding while others fail?
The answers aren’t intuitive:
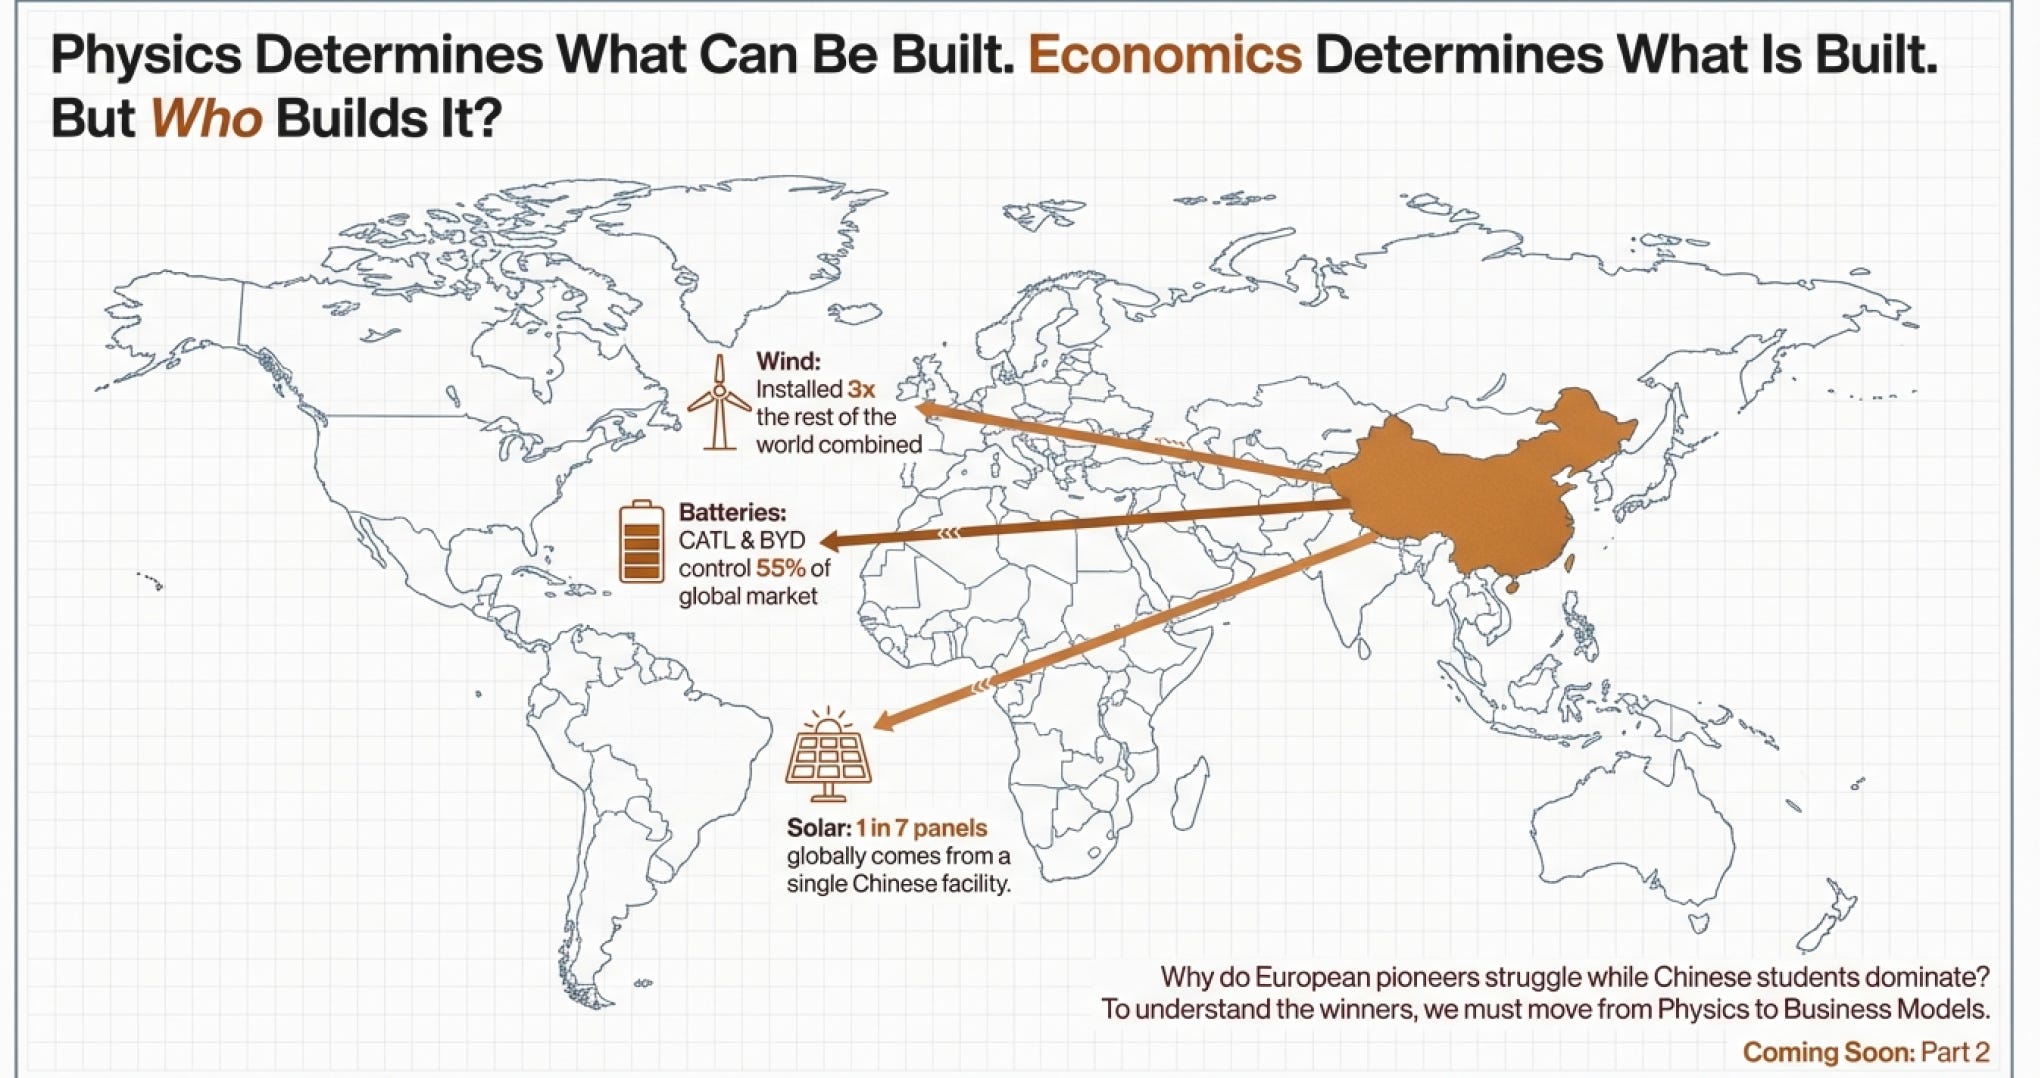
China installed 127 GW of wind in 2024—more than 3x the rest of the world combined. Chinese manufacturers (Goldwind, Envision, Mingyang) captured the top four positions in global wind turbine installations for the first time ever. Yet in Europe, European manufacturers still hold 92% market share.
CATL and BYD control 55% of the global battery market. Yet LG Energy Solution, Samsung SDI, and Panasonic maintain strong positions in premium automotive applications and earn better margins.
Solar manufacturing is 80%+ Chinese, with one Chinese facility producing one out of every seven panels globally. Yet First Solar survives by specializing in thin-film technology that works better in specific conditions.
BYD delivered 2.6 million EVs in 2024 versus Tesla’s 985,000—but Tesla maintains 38% US market share while BYD has minimal presence outside Asia.
What explains these patterns?
The infrastructure fundamentals we’ve covered tell us what can be built at what cost with what performance. But who actually builds it—and who captures the economics—depends on competitive dynamics we haven’t explored yet:
Why did a Danish company that invented modern wind turbines fall to fifth place globally while Chinese companies that learned from them came to dominate?
Why did two orphans from rural Chinese provinces—one named Wang Chuanfu, one named Zeng Yuqun—come to control the majority of the world’s battery supply?
Why do Western companies still hold strong positions in their home markets despite Chinese manufacturers having overwhelming cost advantages?
Why are some infrastructure investments generating attractive returns while others are losing money despite growing revenues?
These questions can’t be answered by physics or economics alone. They require understanding the business models, competitive strategies, and geographic advantages that determine who wins in infrastructure buildouts.
That’s what we’ll explore in the next section: Business & Competitive Landscape.
Because knowing what needs to be built is one thing. Understanding who builds it—and who profits—is entirely another.
As Buffett likes to say: “When a management with a reputation for brilliance tackles a business with a reputation for bad economics, it’s the reputation of the business that remains intact.”
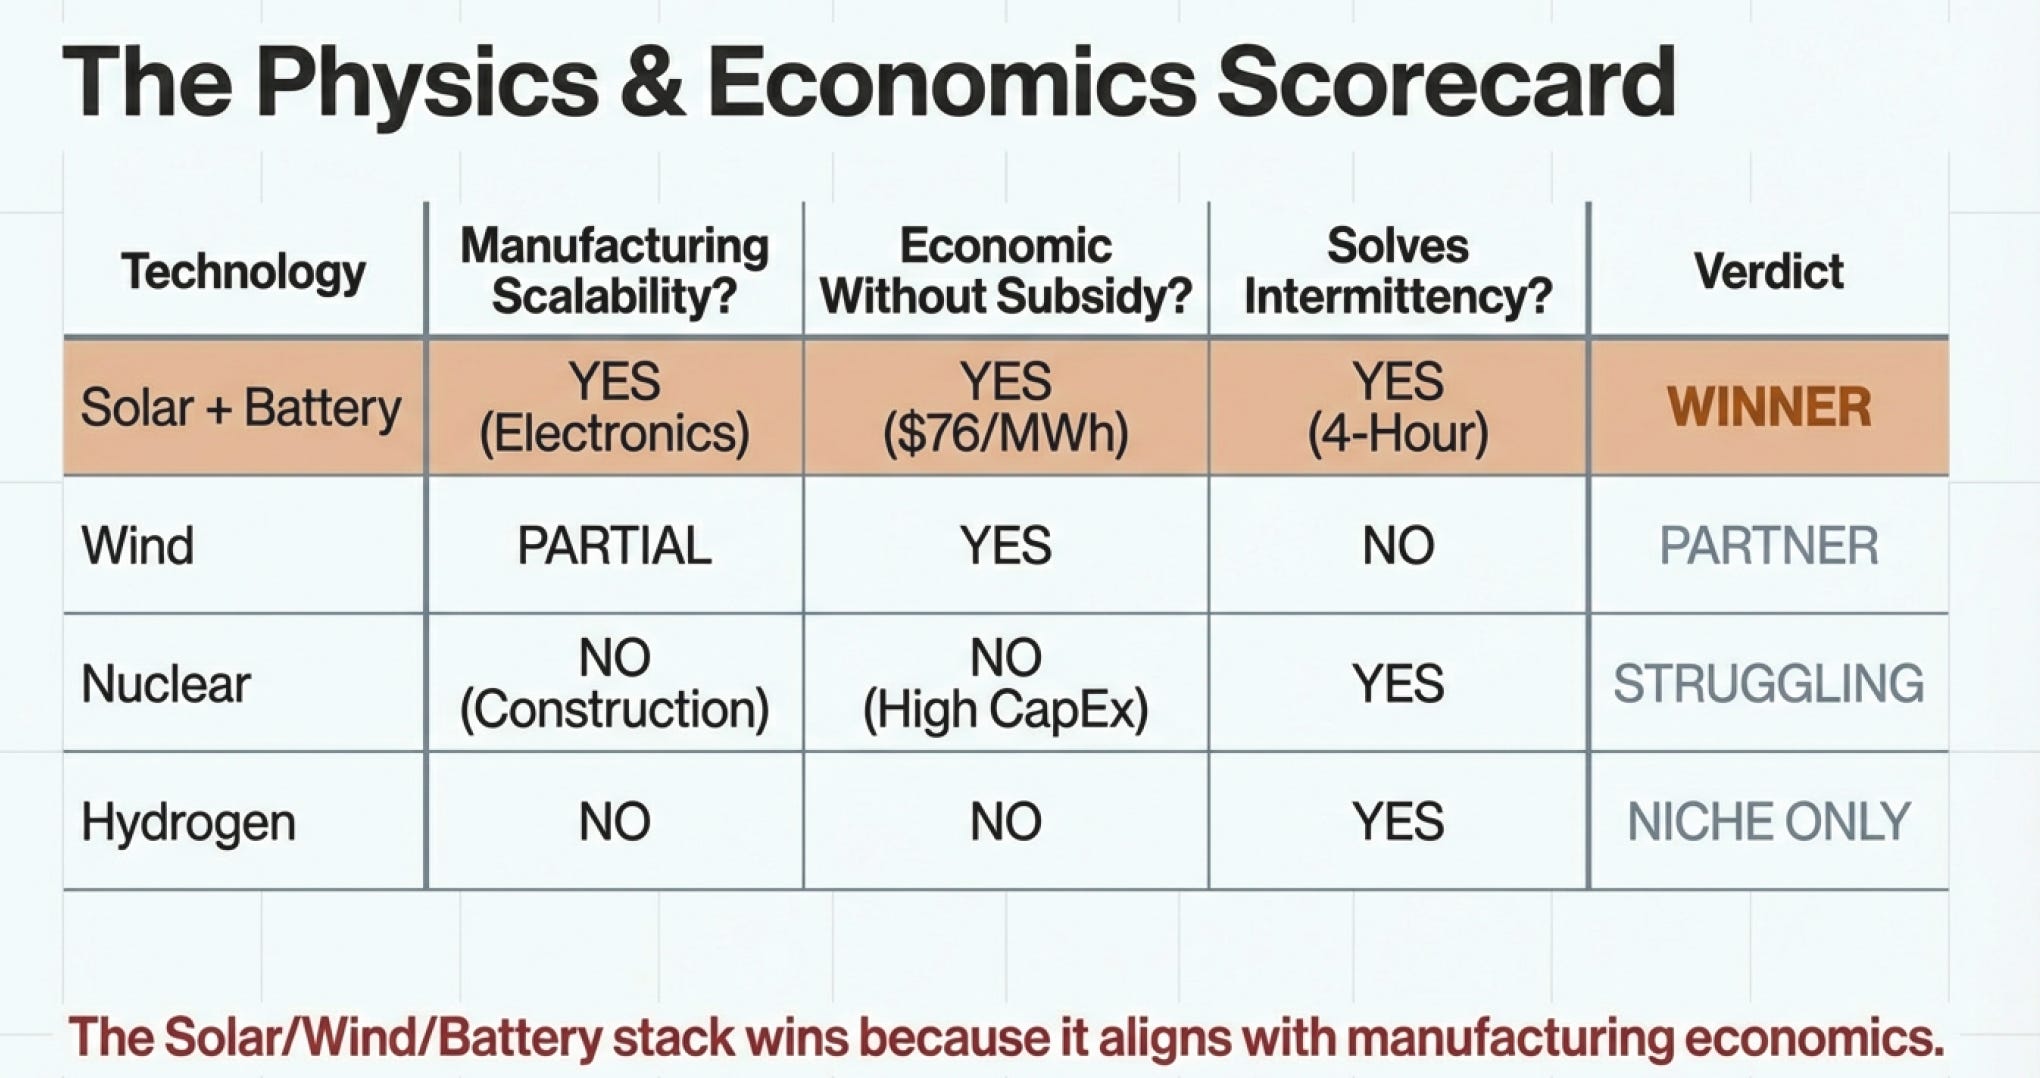
In alternative energy infrastructure, the physics sets the economics. The economics determine what’s buildable. And the competitive landscape determines who survives long enough to profit.
Let’s meet the players and understand their game….
Alternative Energy Primer Part 2 - Business & Competitive Landscape
The Shipwreck That Changed Everything
For part 1 - Industry Fundamentals: click here
For part 2 - Business & Competitive Landscape: click here
For part 3 - Industry and Sector Technicals: click here
References
Alternative Energy Primer – Part 1
https://compoundingzero.substack.com/p/alternative-energy-primer-part-1Renewable energy basics overview (Better Buildings Solution Center)
https://betterbuildingssolutioncenter.energy.gov/renewables/basics Better Buildings Solution CenterGlobal energy system fundamentals (Global Energy Assessment – Energy Primer)
https://www.cambridge.org/core/books/global-energy-assessment/energy-primer/5DC4D4E4A6A75B67F4F6173F26E9ADC6 Cambridge University Press & AssessmentFundamental basics of electricity and energy (NREL report)
https://www.nrel.gov/docs/fy24osti/89244.pdf NRELOverview of different renewable energy sources (BU Economics of Renewable Energy Module)
https://www.bu.edu/eci/files/2024/03/renewable-energy-econ-module-final.pdf Boston UniversityWikipedia entry on distributed generation (renewables and grid integration)
https://en.wikipedia.org/wiki/Distributed_generation WikipediaWikipedia entry on fuel cells (energy conversion technology)
https://en.wikipedia.org/wiki/Fuel_cell WikipediaWikipedia entry on feed-in tariffs (renewables policy mechanism)
https://en.wikipedia.org/wiki/Feed-in_tariff WikipediaWikipedia entry on energy transition (overview of low-carbon transformation)
https://en.wikipedia.org/wiki/Energy_transition WikipediaComprehensive renewable energy technologies review (ScienceDirect)
https://www.sciencedirect.com/science/article/pii/S2211467X2200133X ScienceDirectReview of LCOE and electricity cost metrics
https://doi.org/10.1016/j.egyr.2023.06.036 ScienceDirectIntegrating renewable energy into power grids (RFF Renewables 101 explainer)
https://www.rff.org/publications/explainers/renewables-101-integrating-renewables/ Resources for the FutureWikipedia entry on grid parity (renewable vs grid cost)
https://en.wikipedia.org/wiki/Grid_parity WikipediaWikipedia entry on sector coupling (electricity usage across sectors)
https://en.wikipedia.org/wiki/Sector_coupling WikipediaChinese Wikipedia on electricity generation cost (LCOE concept description)
https://zh.wikipedia.org/wiki/%E5%8F%91%E7%94%B5%E6%88%90%E6%9C%AC WikipediaRenewable Energy Crash Course: A Concise Introduction (Springer book)
https://link.springer.com/book/10.1007/978-3-030-70049-2 SpringerRenewable energy textbook preview (integration of renewable sources)
https://s3-euw1-ap-pe-df-pch-content-store-p.s3.eu-west-1.amazonaws.com/9781849775144/0ab4e1ec-1a5d-4e26-bb99-e3faebdf2b67/preview.pdf s3-euw1-ap-pe-df-pch-content-store-p.s3.eu-west-1.amazonaws.comIntermittent renewable energy definition and grid impact (VRE Wikipedia)
https://zh.wikipedia.org/wiki/%E9%96%93%E6%AD%87%E6%80%A7%E5%86%8D%E7%94%9F%E8%83%BD%E6%BA%90 WikipediaImpacts of renewable energy on grid integration (Energies journal)
https://doi.org/10.3390/en13184856 MDPIRenewable energy integration challenges and strategies (McKinsey article)
https://www.mckinsey.com/industries/electric-power-and-natural-gas/our-insights/how-grid-operators-can-integrate-the-coming-wave-of-renewable-energy McKinsey & CompanyHistorical academic study on wind intermittency and grid risk (arXiv)
https://arxiv.org/abs/1002.2243 arXivPower systems with high renewable sources – inertia & frequency review (arXiv)
https://arxiv.org/abs/2004.02951 arXivTradeoffs in power grids with renewable energy (arXiv)
https://arxiv.org/abs/1407.7889 arXivComplementarity of renewable sources review (arXiv)
https://arxiv.org/abs/1904.01667 arXiv