
1️⃣ Industry Fundamentals & Macro View
Picture this: You’re a doctor in 1965. A patient walks in with chest pain. You order every test you can think of—EKG, stress test, blood work, maybe even a chest X-ray for good measure. Not because you’re necessarily sure they’re all needed, but because each test pays you separately. The more you do, the more you earn. Your patient’s insurance company? They just pay the bill. No questions asked.
Now imagine you’re that same doctor in 2025. Except now, if you order too many unnecessary tests, you might actually lose money. Your contract with the insurance company—excuse me, the “managed care organization”—pays you a fixed amount per patient per month, whether you see them once or ten times. Suddenly, your incentives have flipped 180 degrees.
This, dear reader, is the story of how American healthcare went from “fee-for-service” to “managed care.” And like most stories involving trillions of dollars and millions of lives, it’s equal parts fascinating, horrifying, and absurd - because in this case, the entities involved don’t actually lose money but make more.
The Protagonist: The American Healthcare System (Deeply Flawed)
Let’s start with some numbers that should make any reasonable person spit out their coffee:
The healthcare system harms one in ten patients worldwide. Not “provides suboptimal care.” Not “could do better.” Harms. That’s 3 million deaths annually from medical care itself. In 2015 alone, preventable deaths from treatable conditions cost $6 trillion in lost welfare globally. The World Health Organization—not exactly known for hyperbole—warns that patient harm slows global GDP by almost 1% (that is pretty significant btw).
Think about that for a moment. The U.S. has built a system so inefficient, so error-prone, that it functions as a drag on the entire global economy.
Here’s the American version of this tragedy: roughly 5-20% of all clinical encounters involve diagnostic mistakes. About 795,000 Americans annually end up permanently disabled or killed by serious misdiagnoses. Medication errors afflict about 1-in-30 patients and account for half of all avoidable patient harm.
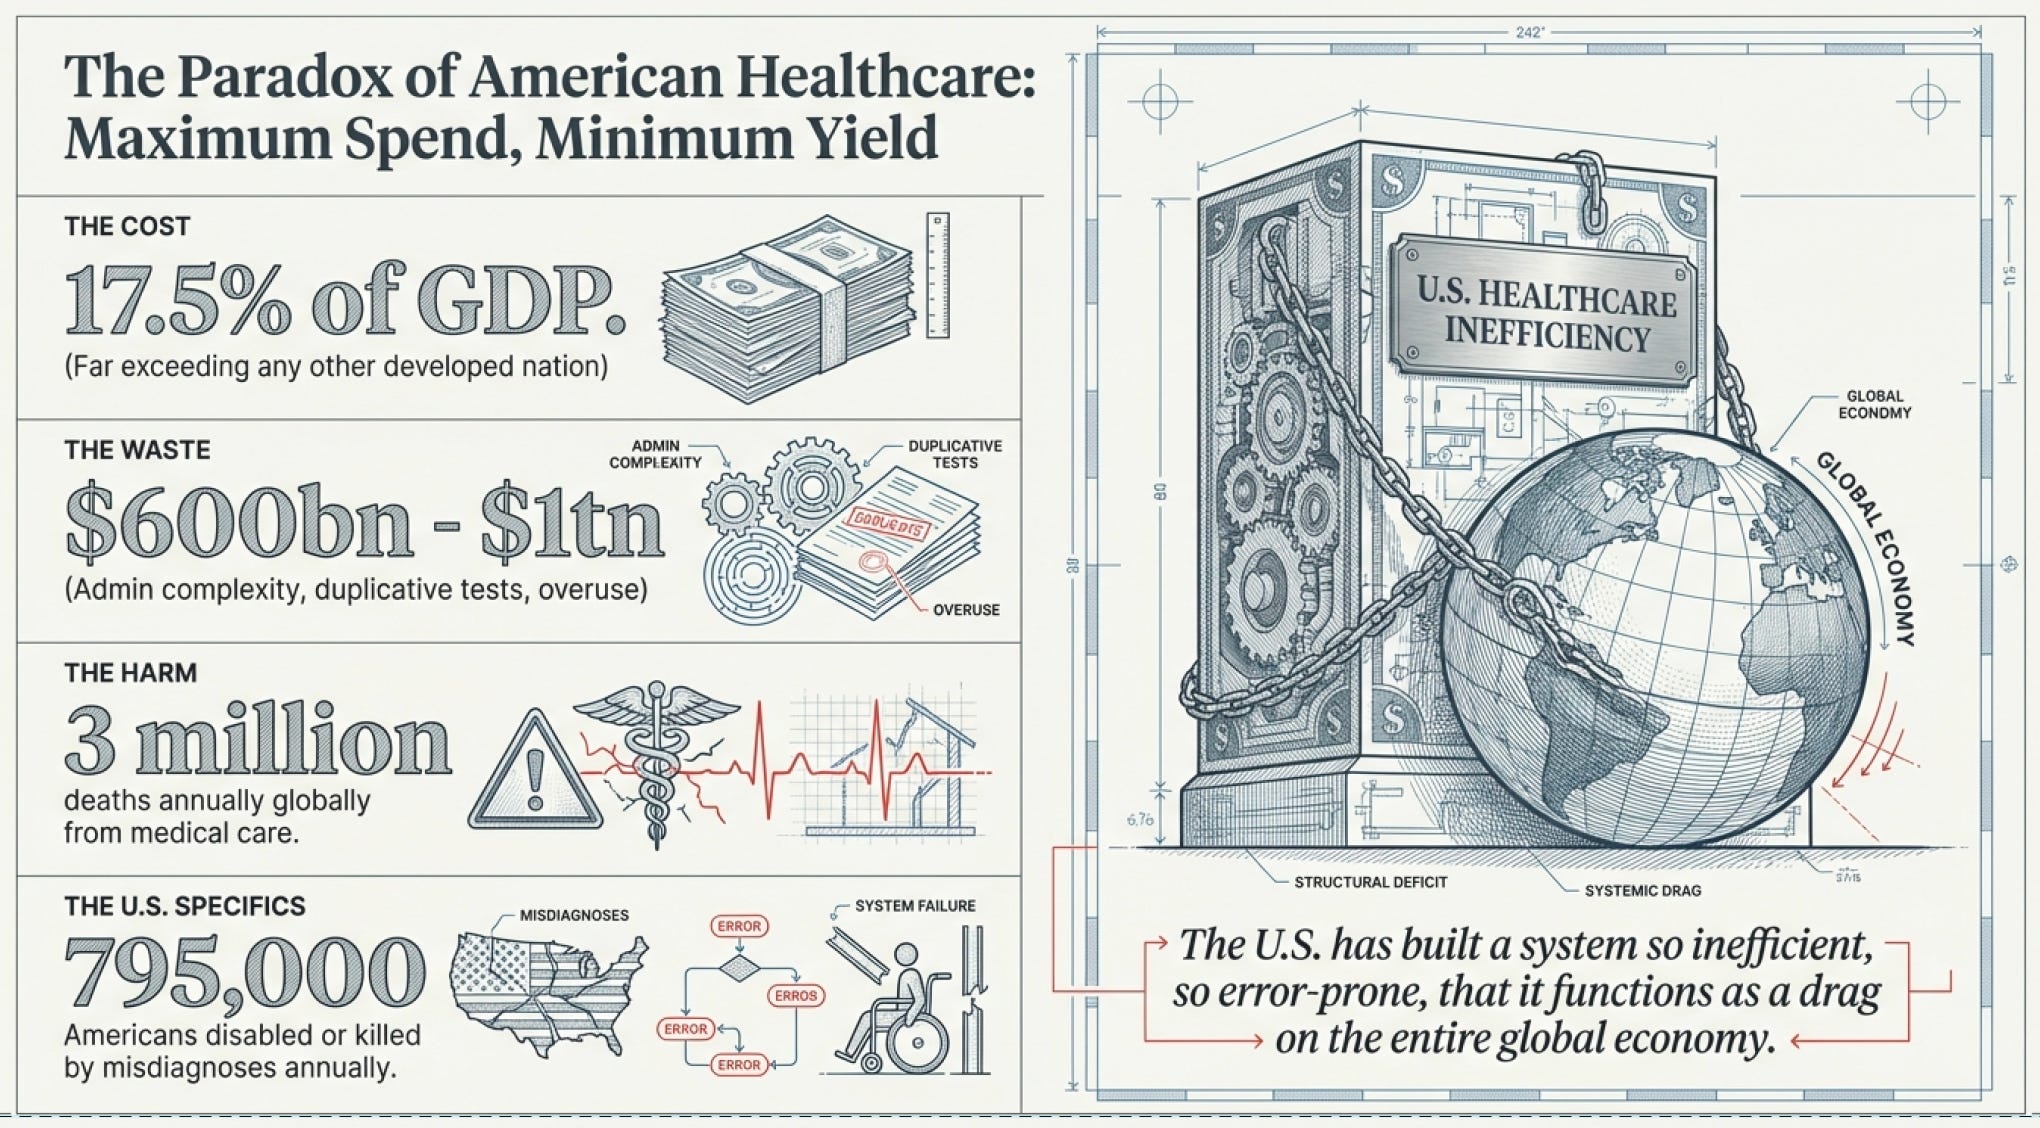
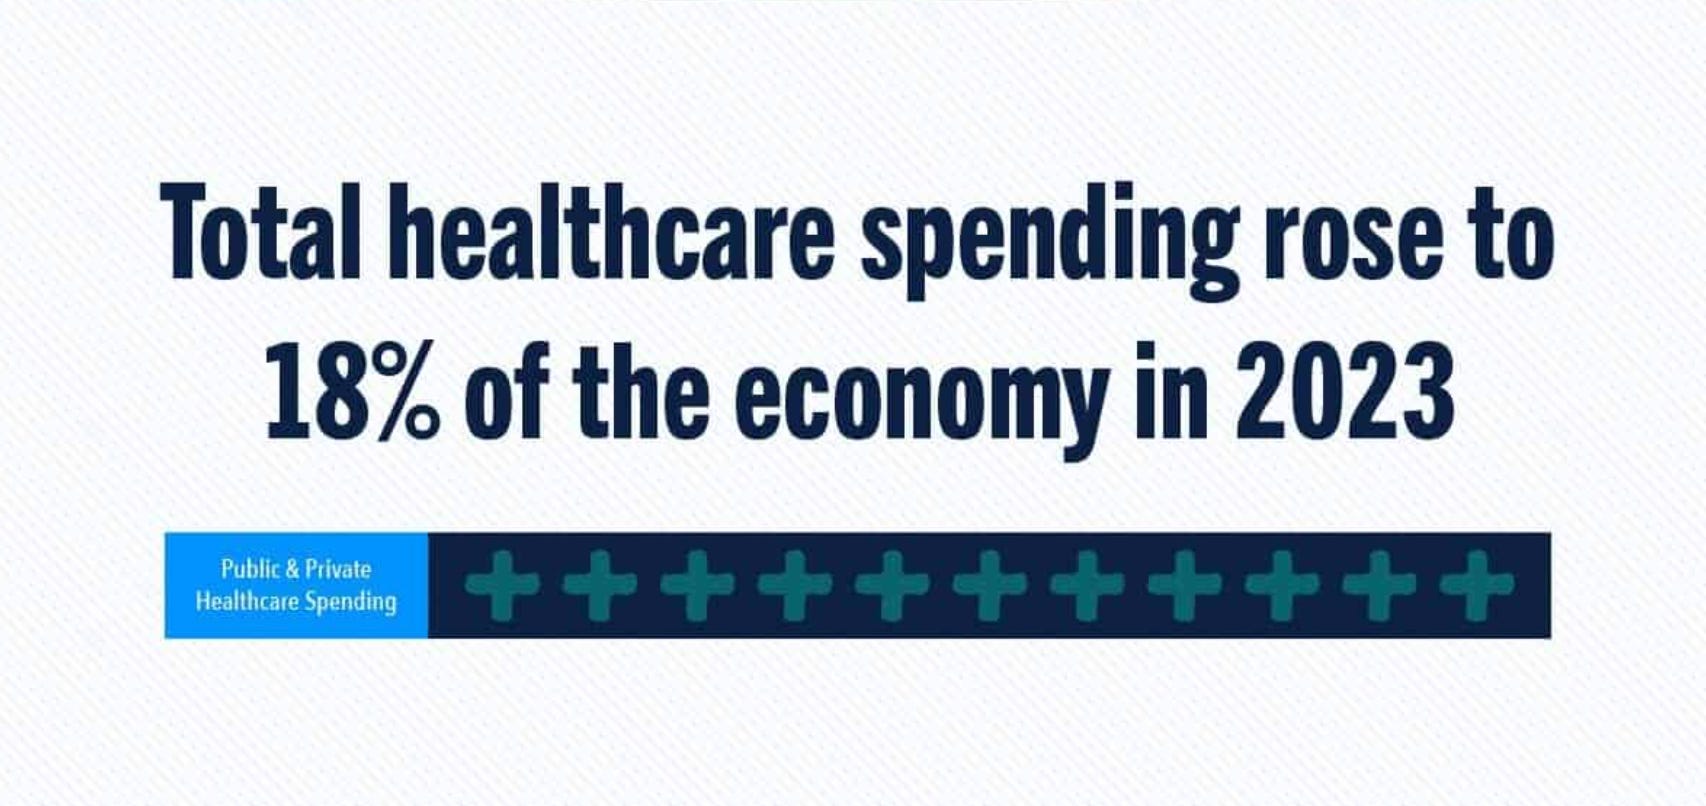
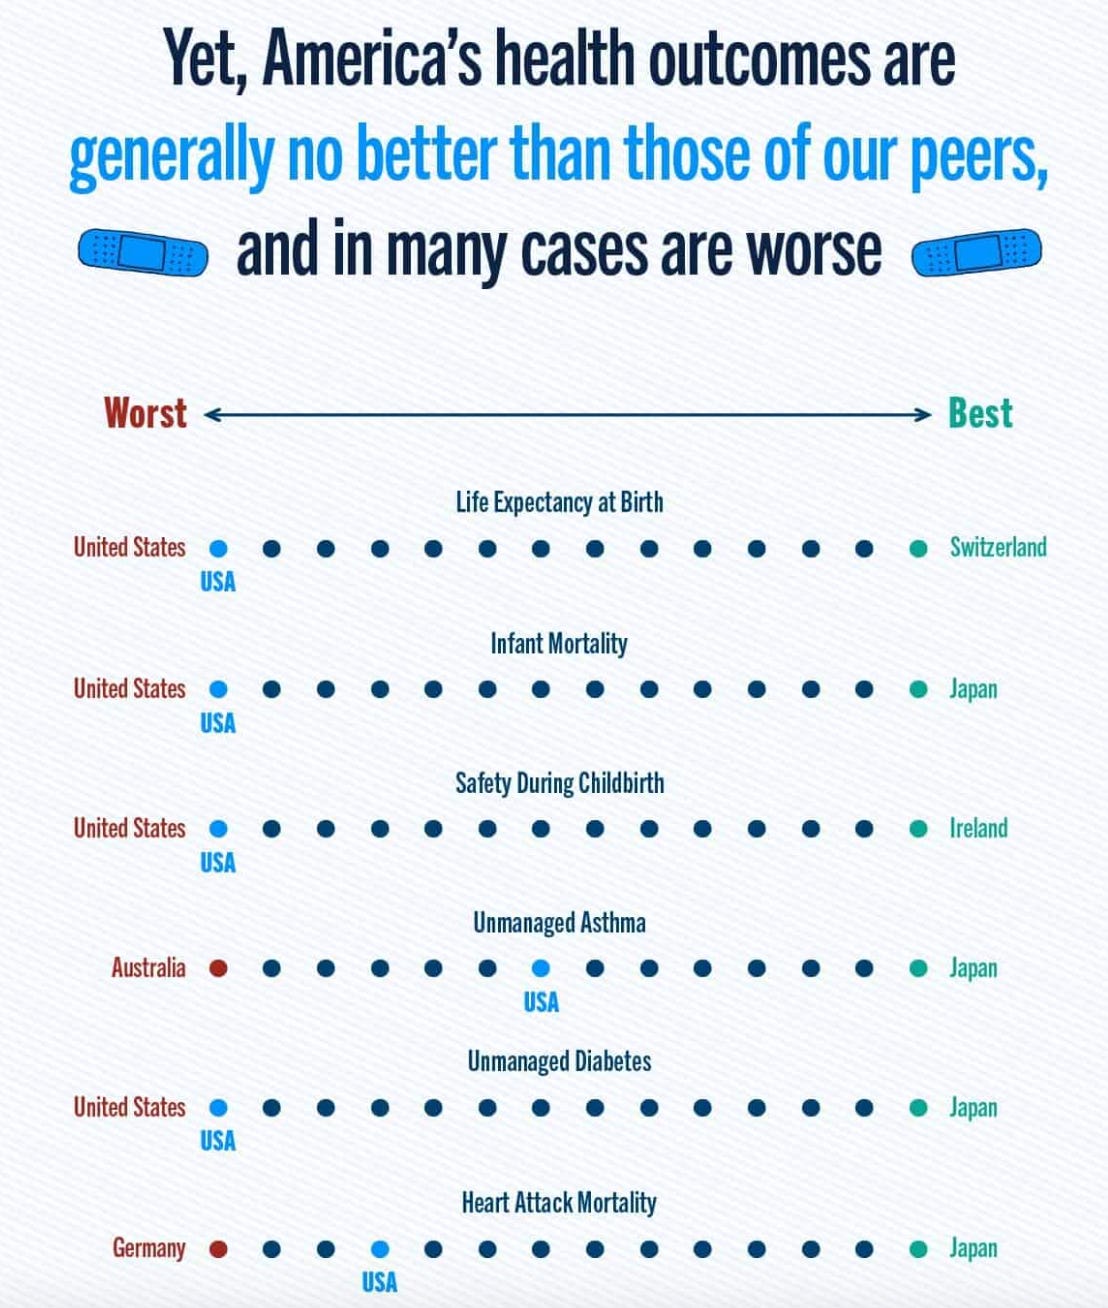
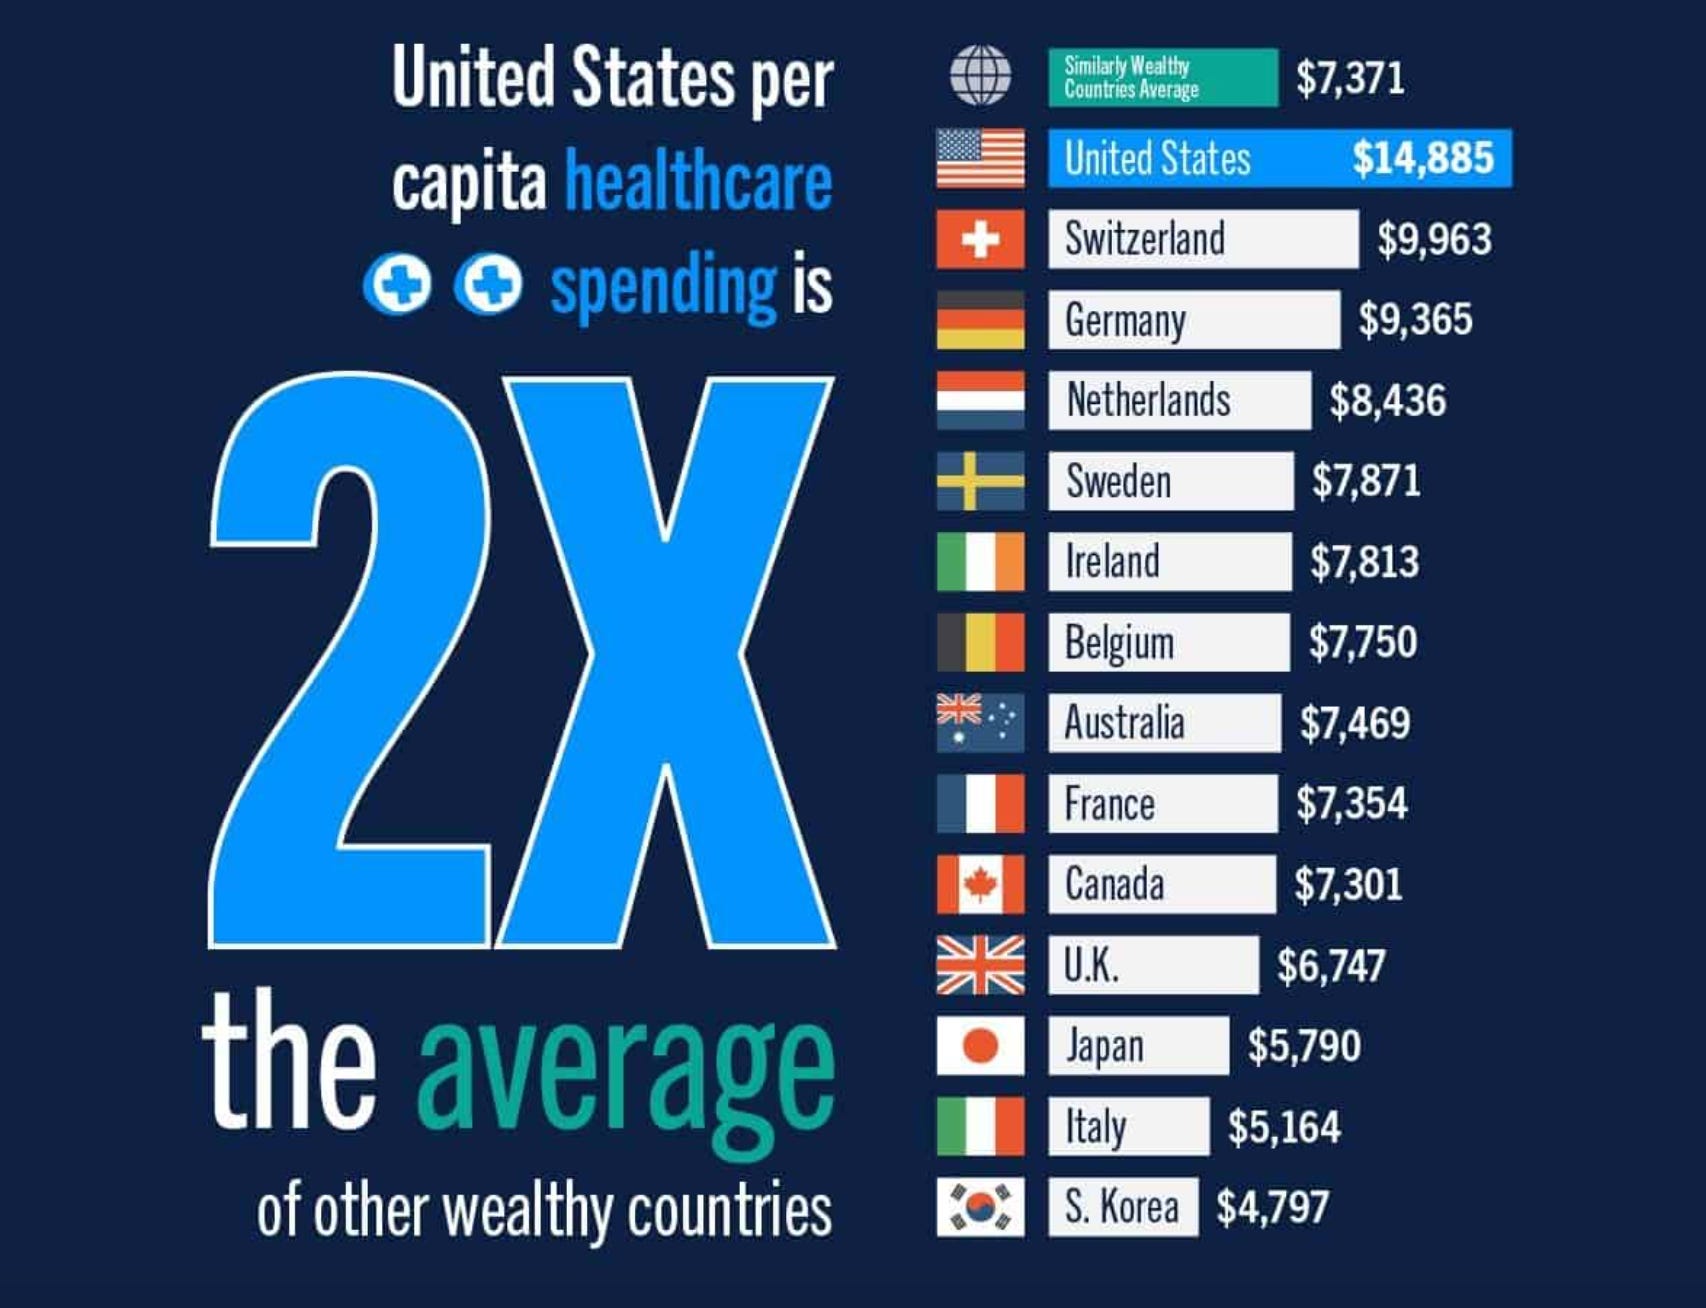
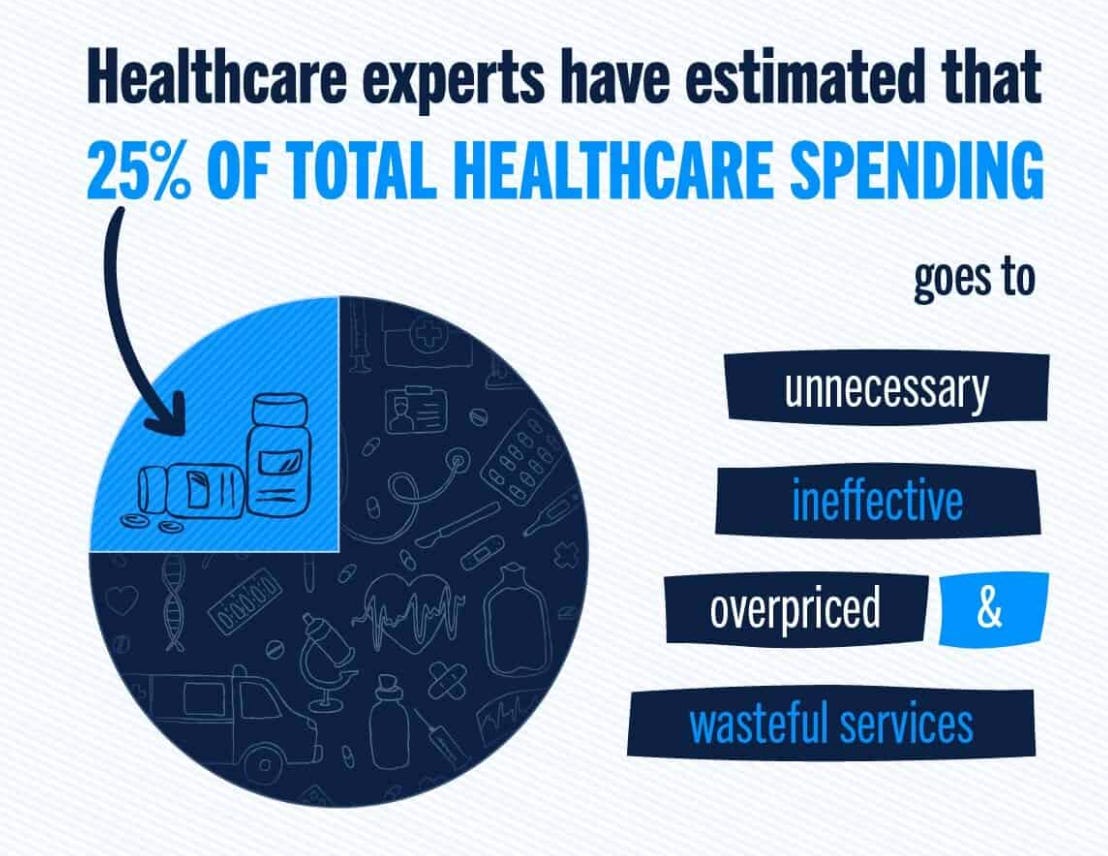
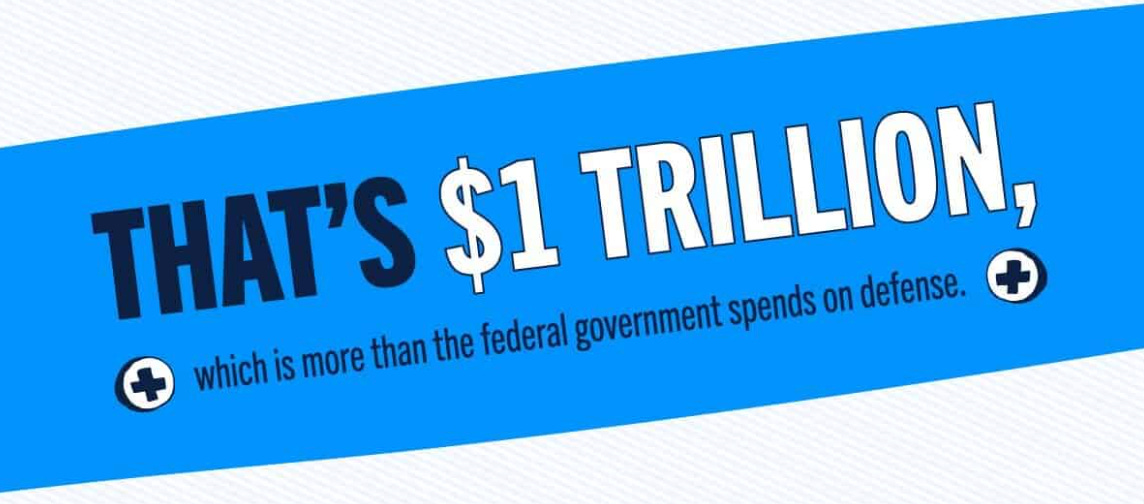
And the cost? The United States spends approximately 17.5% of GDP on healthcare—far above any other developed nation. Yet the U.S. rank poorly on actual health outcomes. Experts estimate between $600 billion to over $1 trillion annually is “avoidable waste” from administrative complexity, duplicative tests, fee-for-service overuse, and siloed records.
The Villain: Misaligned Incentives (And Human Nature)
Now, before we start throwing stones at doctors and hospitals, let’s be clear: most healthcare professionals genuinely want to help people. But as Warren Buffett once observed, “You can always tell someone to go to hell tomorrow”—meaning good intentions are wonderful, but incentives drive behavior.
Consider the hospital that charges $210,000 for a failed attempt to remove an infected hip transplant—a procedure successfully performed for free when the patient was admitted to a Canadian hospital. Or the $17 Tylenol pill (yes just 1!). Or the anesthesiologist who does a “drive-by” before surgery, says “Hi, how are you doing? Any questions?” and then bills the same amount as the nurse-anesthetist who actually administered the anesthesia.
This isn’t evil. It’s economics.
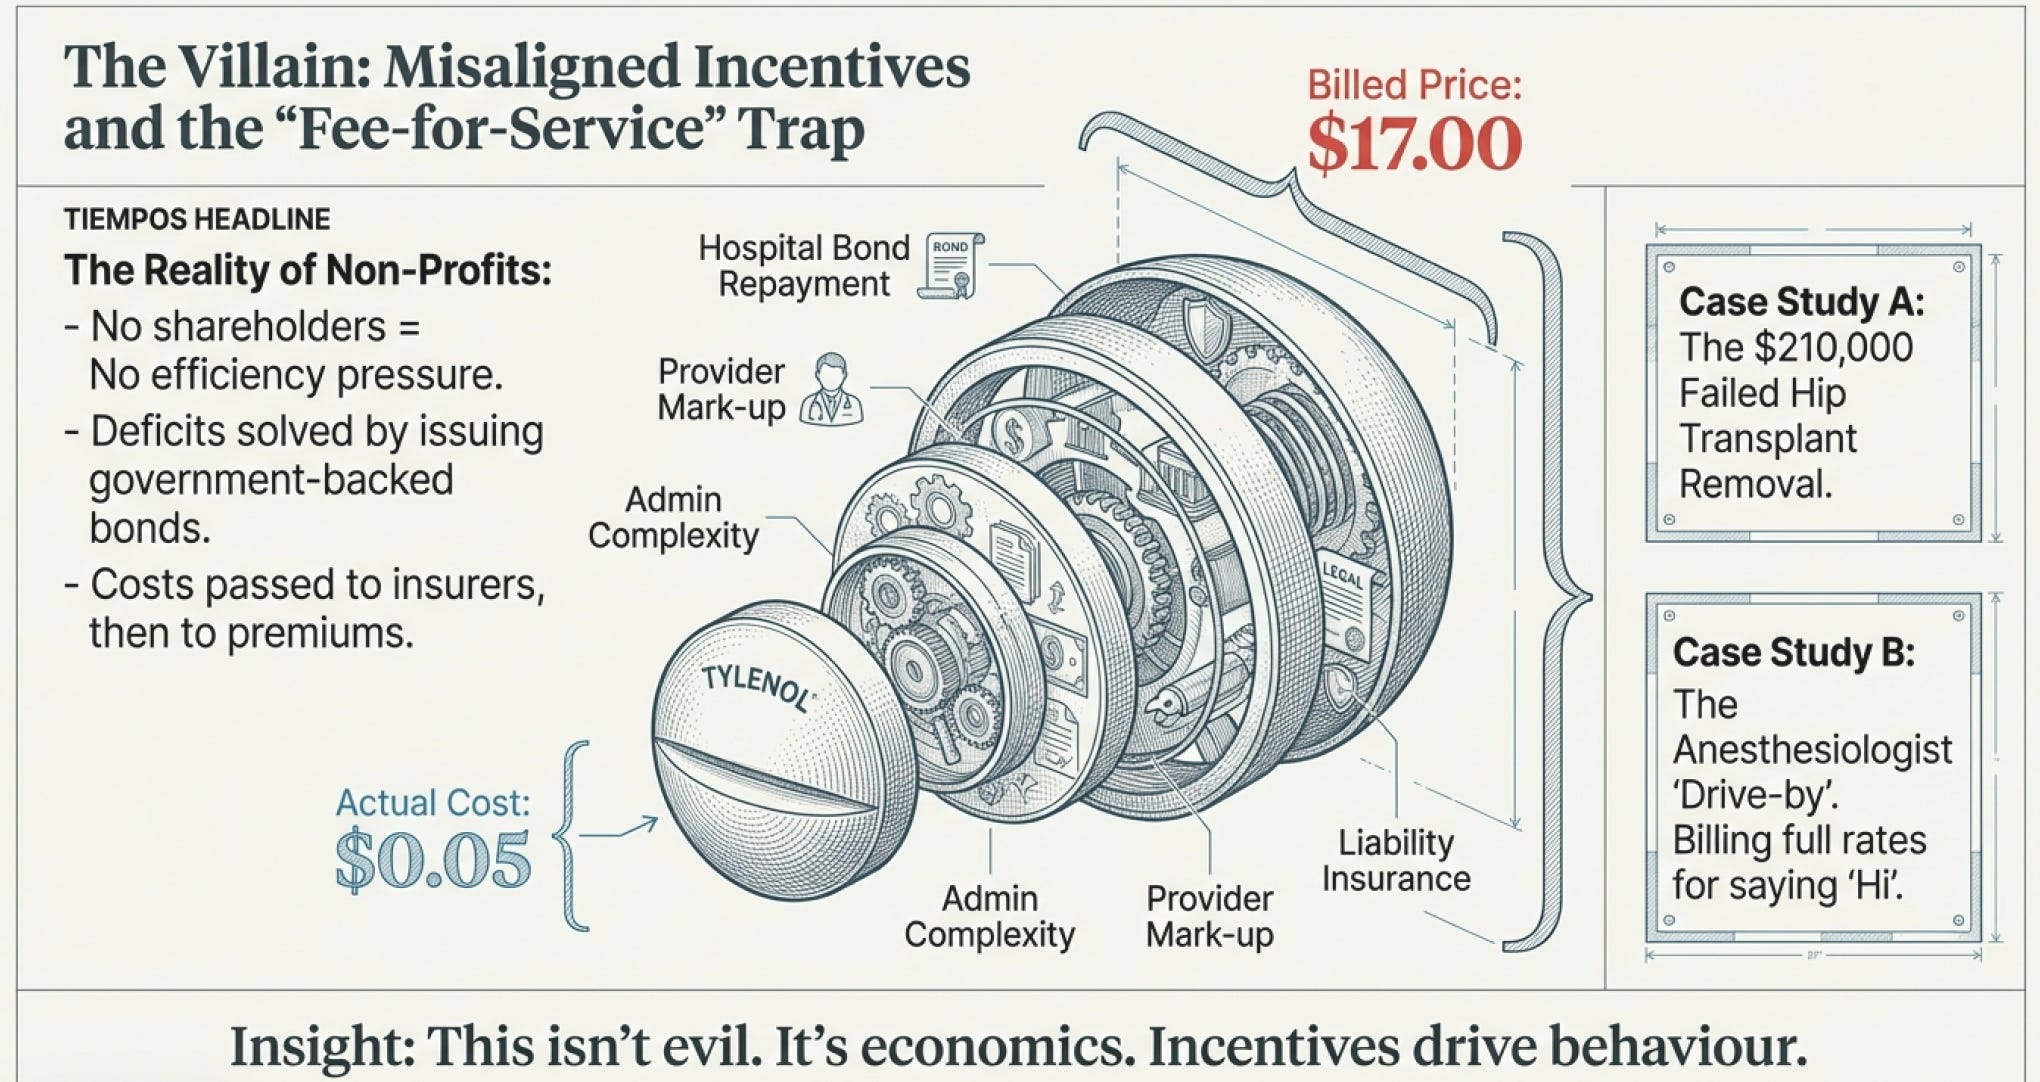
Here’s what happened: Most American hospitals are non-profit. That sounds nice until you realize what “non-profit” means in practice. It doesn’t mean “cheap” or “efficient.” It means “no shareholders demanding returns.” When a non-profit hospital runs a deficit, it simply issues bonds through the government. When it wants nicer buildings, more staff, or fancier equipment, it issues more bonds. The cost? Passed directly to consumers through higher prices.
And here’s the kicker: insurers generally agree to pay these inflated prices. Why? Three reasons:
It’s less trouble than arguing. Negotiating with NYU Medical Center over whether a skin immunity infusion should cost $19,000 or $100,000 takes time and energy.
Large hospital systems have leverage. Insurers don’t want to lose major medical centers from their networks. Patients would revolt.
They can pass costs to someone else. Government subsidizes premiums, employers pay for coverage, or patients pay through the nose. The insurer just adjusts premiums next year.
Richard Feynman once said, “The first principle is that you must not fool yourself—and you are the easiest person to fool.” The American healthcare system has been fooling itself for decades that this arrangement is sustainable.
Confrontation - Enter the Managed Care Organizations
The Hero Arrives (Sort Of)
By the 1970s, even the federal government realized something had to change. Healthcare costs were exploding. The elderly were going bankrupt. And the fee-for-service model was creating what economists call a “moral hazard”—when someone else pays for your decisions, you make different decisions.
In 1973, Congress passed the Health Maintenance Organization Act, an amendment to the Public Health Service Act of 1944. This legislation established the foundation for what we now call “managed care organizations.”
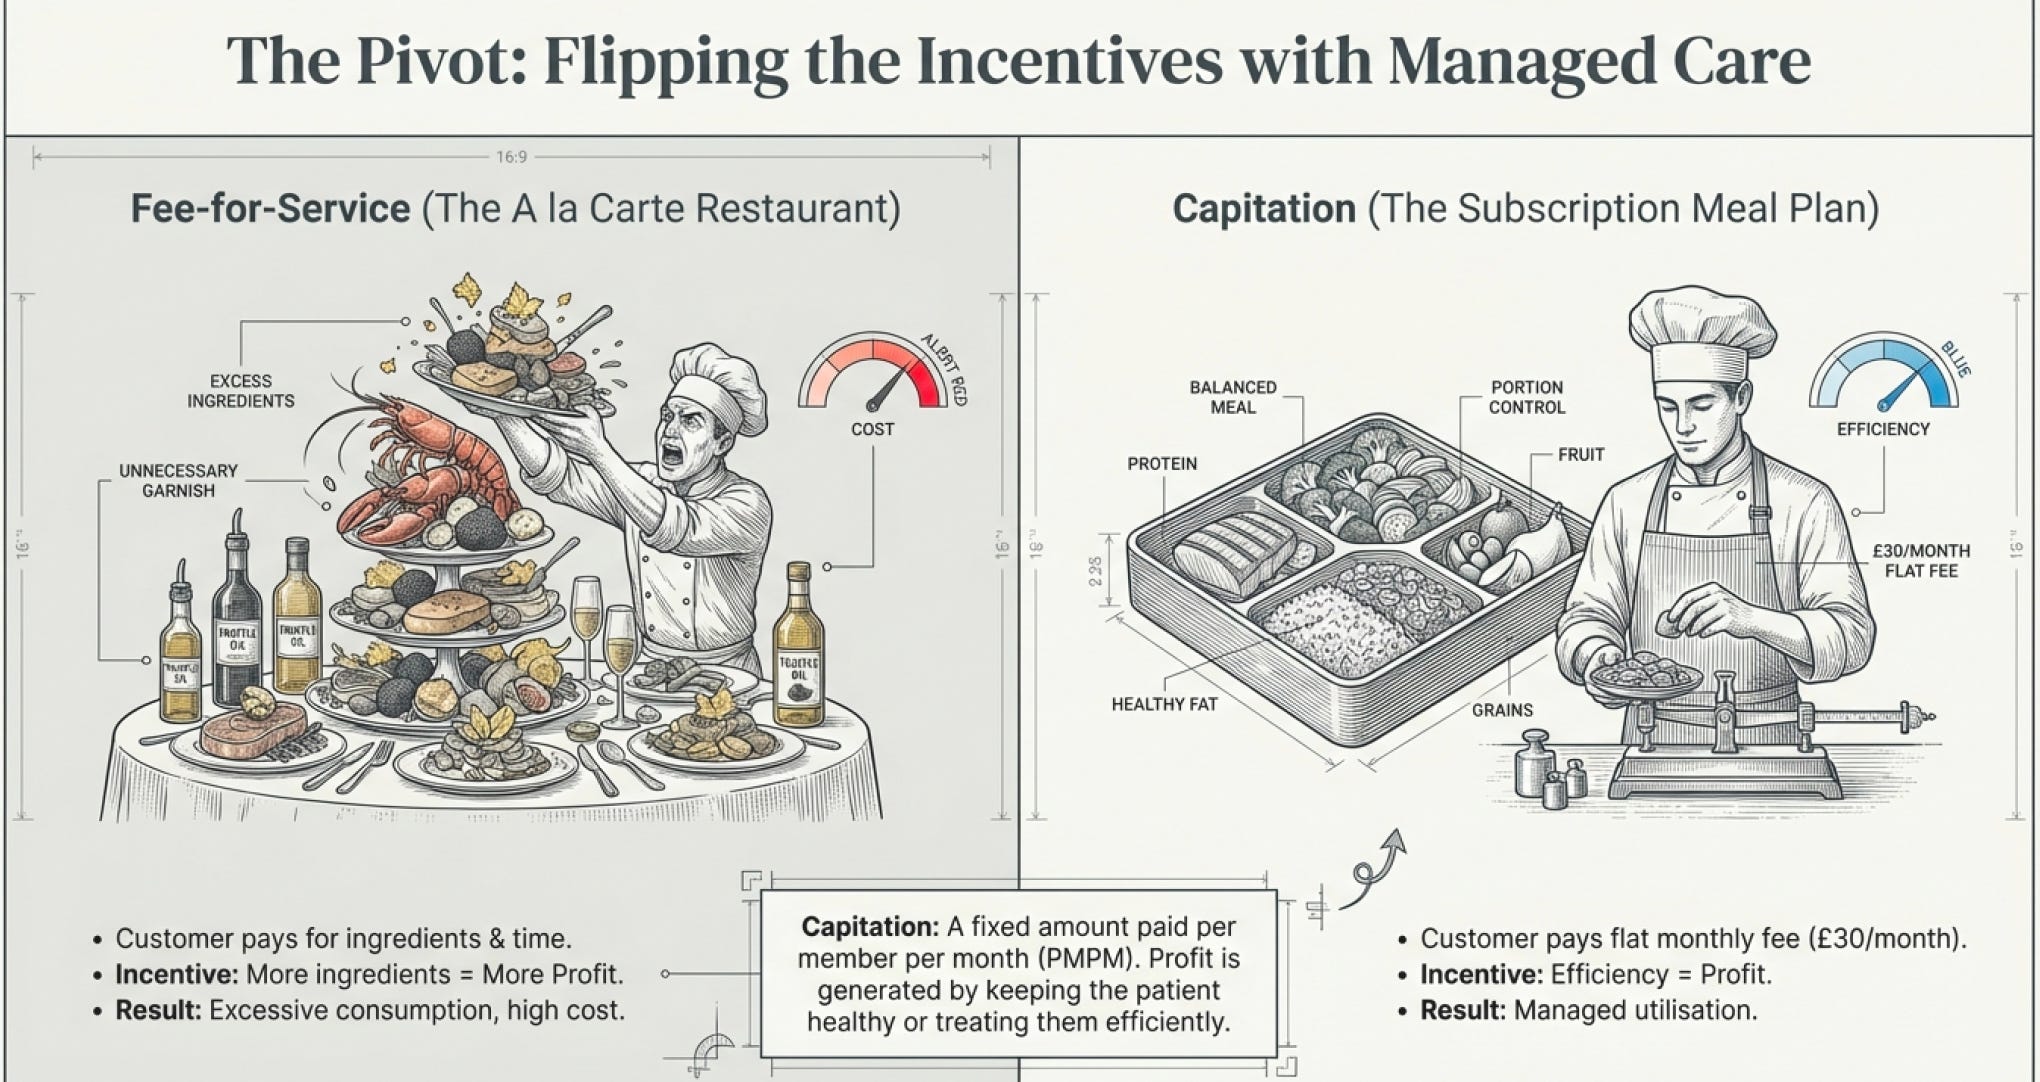
The idea was elegantly simple: instead of paying doctors and hospitals for each service performed, pay them a fixed amount per patient per month—called “capitation”—to manage that patient’s total healthcare needs. Suddenly, the incentive flips. Now providers make more money by keeping people healthy rather than by treating them when they’re sick.
It’s the difference between paying a security guard by the hour versus giving him a bonus for every month nothing gets stolen. One incentivizes showing up; the other incentivizes actually preventing theft.
The Four Flavors of Managed Care
As MCOs evolved, they split into different models, each with varying levels of control and flexibility:
1. Health Maintenance Organizations (HMOs) - The strictest model. You pick a primary care doctor who controls access to everything else. Want to see a specialist? You need a referral. Want to go out-of-network? Tough luck, you’re paying out of pocket. But HMOs are typically the cheapest option because they control costs most aggressively.
2. Preferred Provider Organizations (PPOs) - More flexibility, more cost. You can see specialists without referrals. You can even go out-of-network (though you’ll pay dearly for the privilege). This is the “have your cake and eat it too” option—assuming you can afford the extra premium.
3. Point of Service (POS) - A hybrid. You need a primary care physician like an HMO, but you can see in-network specialists without referrals like a PPO. It’s the middle child of managed care: neither as cheap as HMOs nor as flexible as PPOs.
4. Exclusive Provider Organizations (EPOs) - You can choose your providers without needing a PCP or referrals, but stay in-network or pay for everything yourself. No out-of-network coverage whatsoever.
The common thread? All of these models exist to manage utilization. That’s just a fancy way of saying “make sure you’re not ordering $100,000 procedures when $20,000 ones will do just fine.”
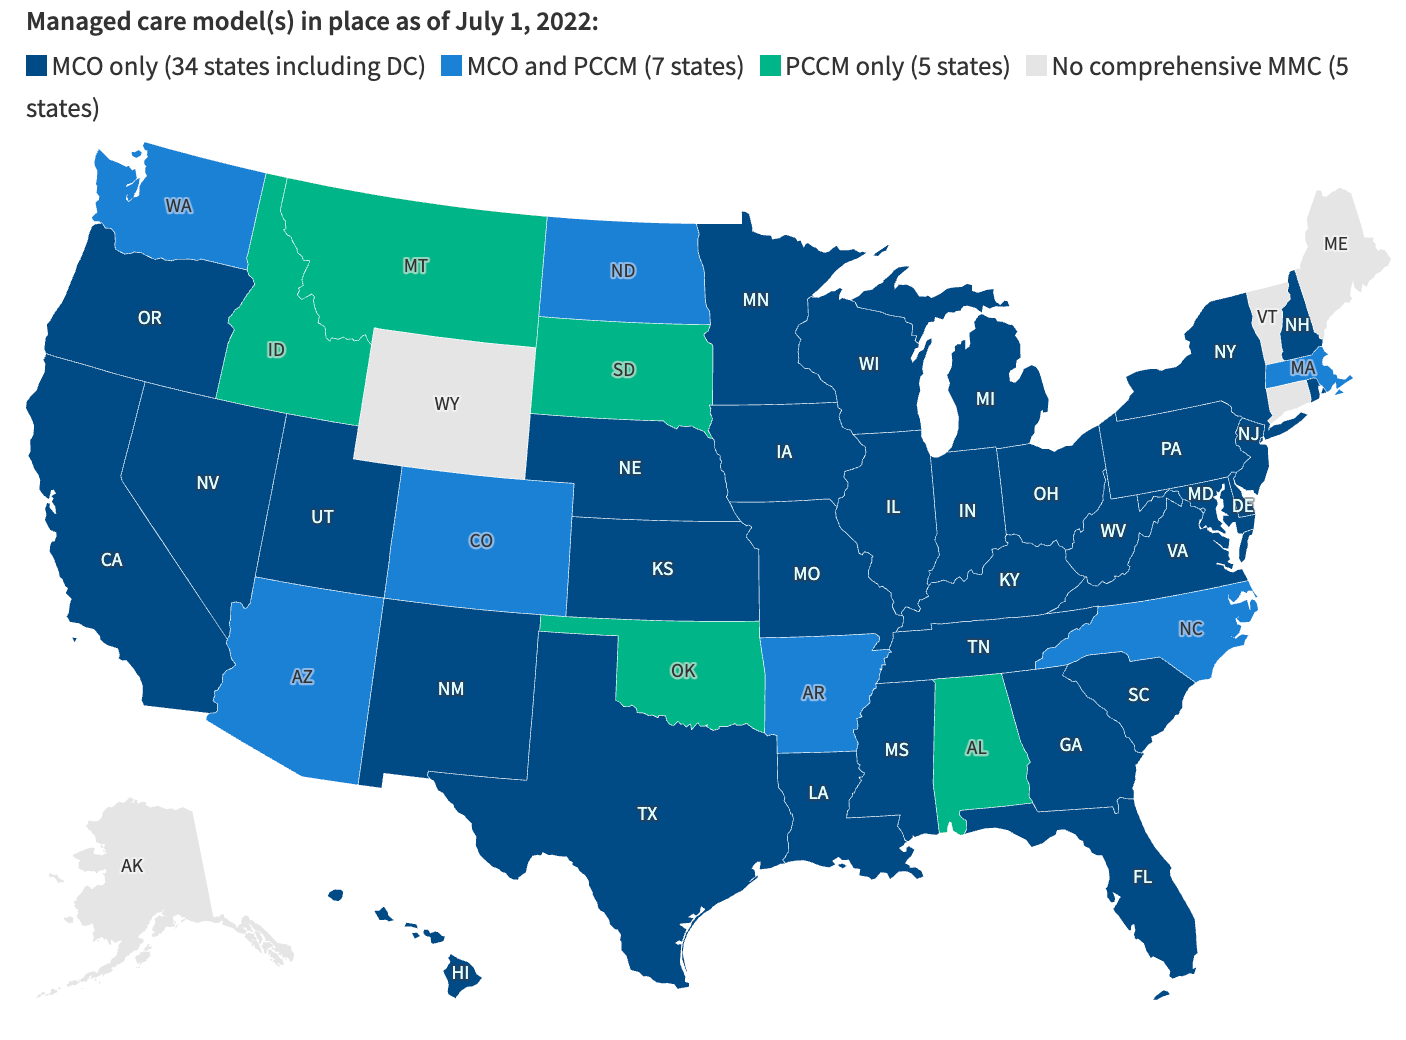
PCCM most commonly stands for Primary Care Case Management, a system where a primary care provider (PCP) manages and coordinates a Medicaid patient's care,
Scenario A: Fee-for-Service (The Old Way)
Imagine you run a restaurant where customers pay you not for the meal, but for each individual ingredient and each minute of cooking time. A simple pasta dish? That’ll be $5 for the noodles, $3 for the sauce, $8 for the cook’s time, $4 for the plate and utensils, $6 for the dining room overhead... You see where this goes.
Your incentive? Load up the dish with as many ingredients as possible. Maybe add some truffle oil. Perhaps a fancy garnish. More ingredients = more charges = more profit. Whether the customer actually needs all that? Irrelevant.
Scenario B: Capitation (The Managed Care Way)
Now imagine that same restaurant, but customers pay you a flat $30/month subscription, and you have to provide them up to 3 meals per month, whatever they need.
Suddenly, your incentives reverse. You want to keep customers satisfied but not encourage them to order the most expensive dishes. You want to use ingredients efficiently. Maybe you even start teaching customers about nutrition so they don’t develop expensive health problems—er, I mean, so they don’t order as much.
This is essentially what happened to American healthcare. And like all major shifts in incentives, it had unintended consequences.
The Midpoint Twist: When the Solution Becomes the Problem
Here’s where our story takes a darker turn.
Remember those anesthesiologists doing “drive-bys”? That’s a direct result of capitation pressures. The anesthesiologist contracts to “monitor” multiple patients simultaneously while sitting in a lounge (monitoring their stock portfolio), bills for full services at each, but pays a nurse-anesthetist a fraction of the reimbursement to do the actual work. The system created to reduce waste created new forms of waste.
Or consider this: one patient was charged $19,000 for a skin immunity infusion. The hospital later charged another patient $100,000 for the same service. Why? Because they could. The MCO grudgingly paid both times because fighting would cost more in legal fees and risk losing the hospital from their network.
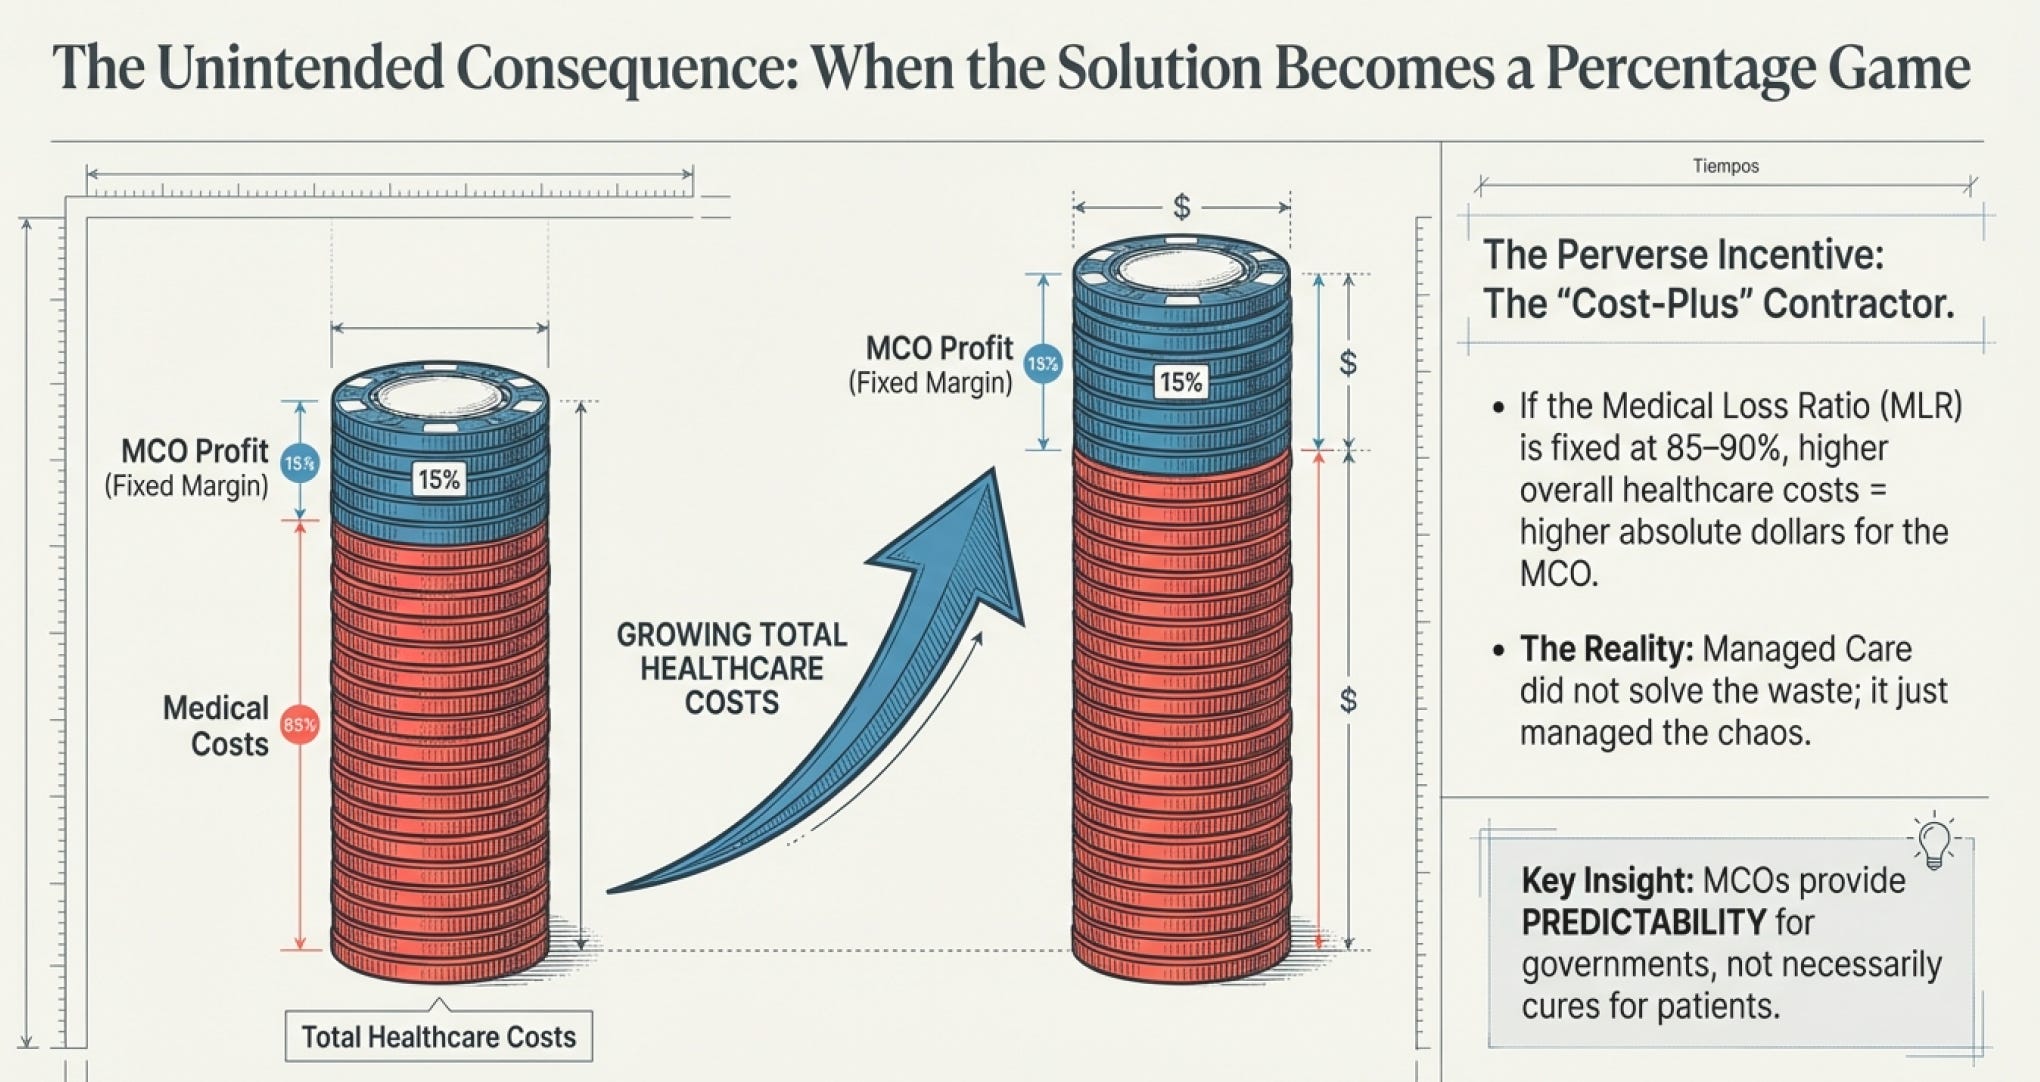
But here’s the really perverse part: MCOs don’t actually hate high prices. They just pass them through as higher premiums. In fact, higher overall spending can mean higher premium revenue, from which they take their percentage. As long as their medical loss ratio (the percentage spent on actual care) stays around 85-90%, they’re profitable.
It’s like hiring a contractor to renovate your house and paying them a percentage of total costs. Don’t be surprised when they suggest marble countertops.
Rising Stakes: The Chronic Disease Time Bomb
While all this was happening, American healthcare faced another crisis building in slow motion: chronic disease.
By 2008, noncommunicable diseases—cardiovascular disease, diabetes, cancer—caused approximately 63% of deaths worldwide. In the United States, chronic illness costs over $1 trillion annually, and it was projected to reach $47 trillion globally by 2030.
These aren’t the diseases that fee-for-service medicine handles well. You can’t cure diabetes with a single expensive procedure. You can’t cut out obesity with surgery (well, you can, but that creates its own set of issues). These conditions require ongoing management, lifestyle changes, coordination between multiple providers.
In other words, they require exactly the kind of long-term, preventive-focused approach that capitation was supposed to encourage.
And here’s where the economics get interesting from an investor’s perspective: chronic disease management is predictable. If you know someone has diabetes, you can estimate with reasonable accuracy how much their care will cost over the next year. And if you can predict costs, you can price your services accordingly.
This is why managed care organizations started to look less like regular insurance companies and more like infrastructure businesses.
Resolution - The Essential Infrastructure Nobody Wanted
The Current State: Too Big to Fail, Too Entrenched to Reform
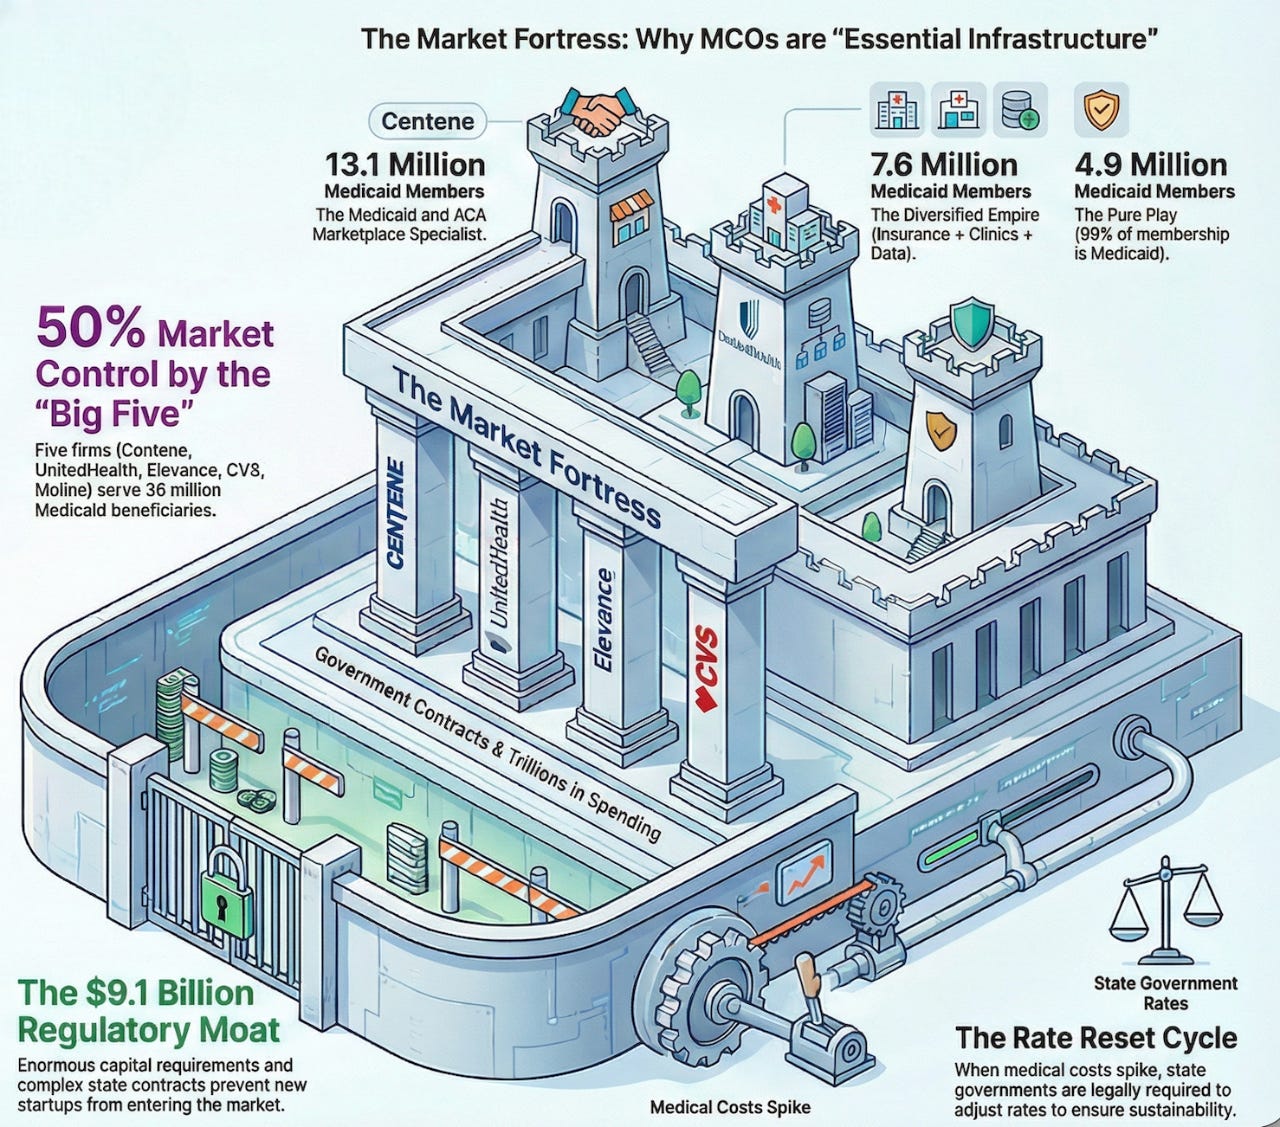
Fast forward to 2025. Five companies—Centene, UnitedHealth Group, Elevance Health (formerly Anthem), CVS Health/Aetna, and Molina Healthcare—control 50% of the Medicaid managed care market. Each operates in 14 or more states. Together, they serve over 36 million Medicaid beneficiaries.
This isn’t a free market. This is infrastructure.
Think about it: when was the last time you heard about a new company disrupting the managed care business? When was the last time a startup said, “You know what the world needs? Another Medicaid MCO!”
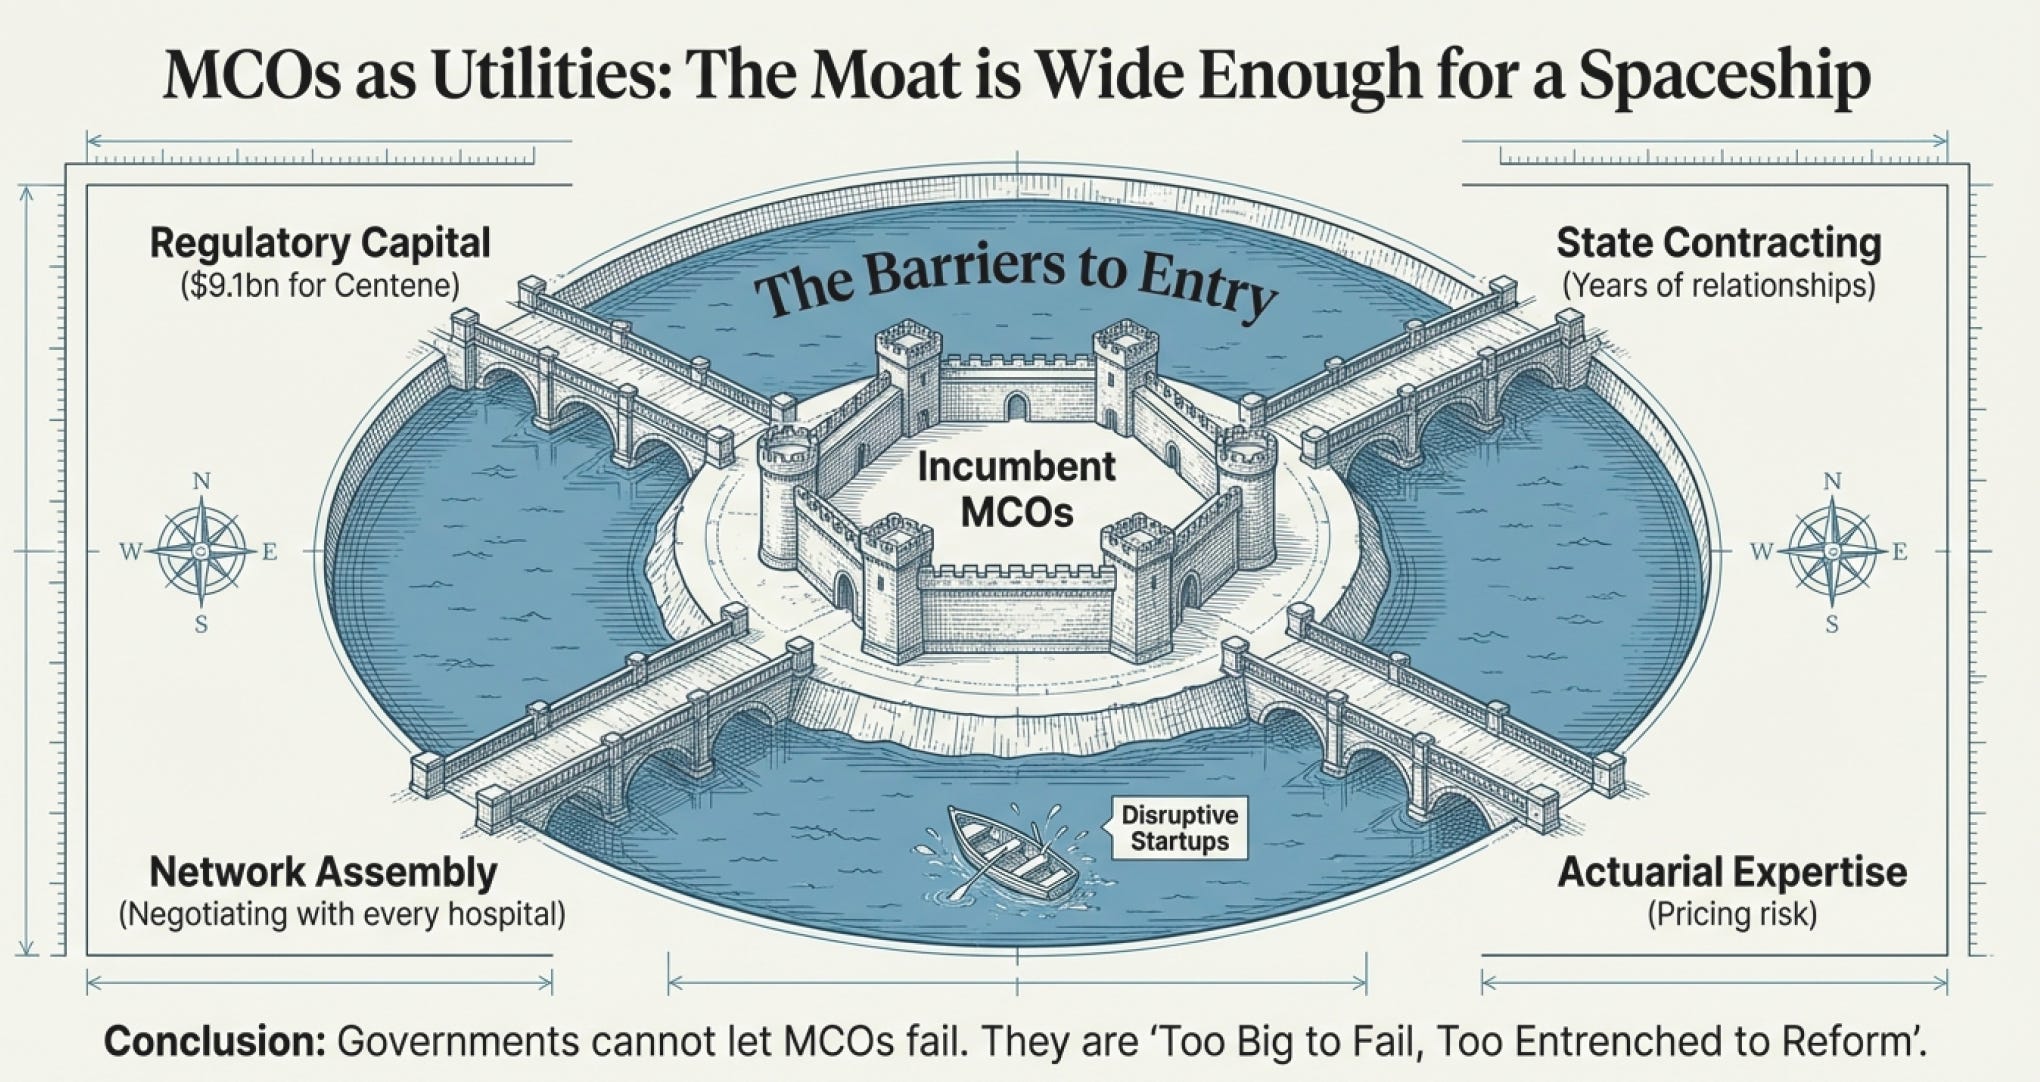
It doesn’t happen. The barriers to entry are enormous:
Regulatory capital requirements - States mandate MCOs maintain minimum capital reserves. For Centene alone, that’s $9.1 billion just sitting there to comply with regulations.
State contracting processes - Getting a Medicaid contract typically takes years of relationship building, RFP responses, and proving operational capability. Most states only award contracts to 2-5 MCOs.
Network assembly - You need contracts with enough hospitals and doctors to actually provide care. Try negotiating with every hospital system in a state as a newcomer.
Claims processing infrastructure - You need systems to process millions of claims, verify eligibility, manage care coordination, report to states, etc.
Actuarial expertise - Pricing capitation rates requires sophisticated modeling. Get it wrong and you lose hundreds of millions.
No wonder Warren Buffett loves businesses with moats. Managed care has a moat so wide you need a spaceship to cross it.
The Government’s Dilemma: Can’t Live With Them, Can’t Live Without Them
Here’s the beautiful paradox from an investment perspective: governments need MCOs more than MCOs need any individual government contract.
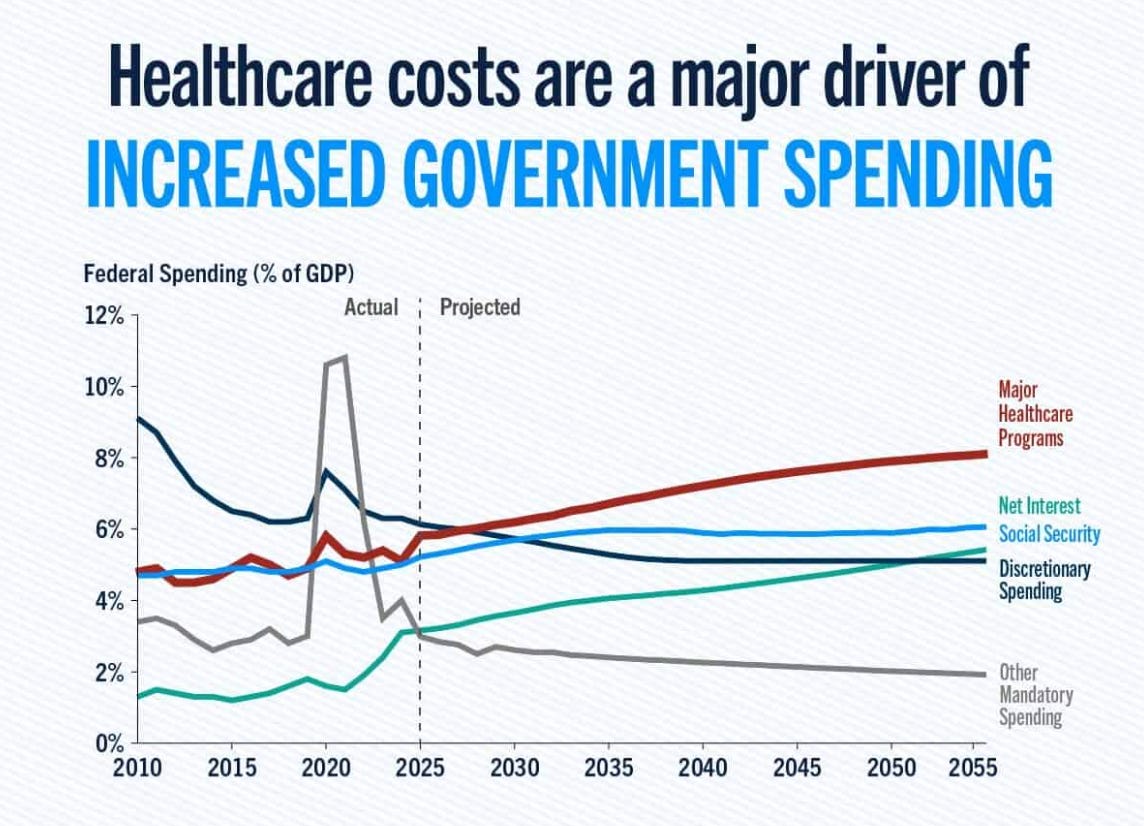
Consider what would happen if a state tried to eliminate managed care and return to fee-for-service:
Administrative costs would explode. The state would need to process millions of individual claims, negotiate with thousands of providers, manage care coordination, prevent fraud, etc.
Utilization would spike. Remember those incentives? Fee-for-service encourages more procedures, more tests, more expensive care.
Costs would become unpredictable. With capitation, the state knows exactly what it’s paying per member per month. With fee-for-service, spending can vary wildly based on utilization.
Political backlash would be severe. If care quality declined or access worsened, voters would punish the politicians responsible.
This is why, despite all the criticism MCOs face, they’re essentially untouchable. Federal law even mandates that Medicaid capitation rates must be “actuarially sound”—meaning states are legally required to pay MCOs enough to sustainably operate.
Let me translate that into plain English: the government cannot let MCOs fail because MCOs have become the critical infrastructure managing healthcare for almost 90 million Americans.
The Resolution: A Permanently Temporary Solution
In late 2025, Molina Healthcare’s CEO, Joseph Zubretsky, put it perfectly during an earnings call when asked about potential Medicaid cuts:
“The way to cut a cost is actuarially and financially determinable. Where that would go is where the political tension exists—it’s either got to be membership, benefits to existing membership, reductions of payments to providers, or higher taxes for the citizens in the state. Neither of those approaches is politically tenable. That’s why we conclude that any changes to managed Medicaid as we know it today would be marginal.”
Translation: Everyone knows the math. You want to cut Medicaid spending? You have four options:
Cut enrollment - Kick people off coverage. (Political suicide)
Cut benefits - Reduce what’s covered. (Also political suicide)
Cut provider payments - Pay doctors and hospitals less. (They’ll revolt)
Raise state taxes - Make taxpayers pay more. (Good luck getting re-elected)
Since none of these are palatable, what actually happens? Marginal adjustments. The political theater of “healthcare reform” continues, but the fundamental structure remains intact.
The Transformation: From Villain to Necessary Evil
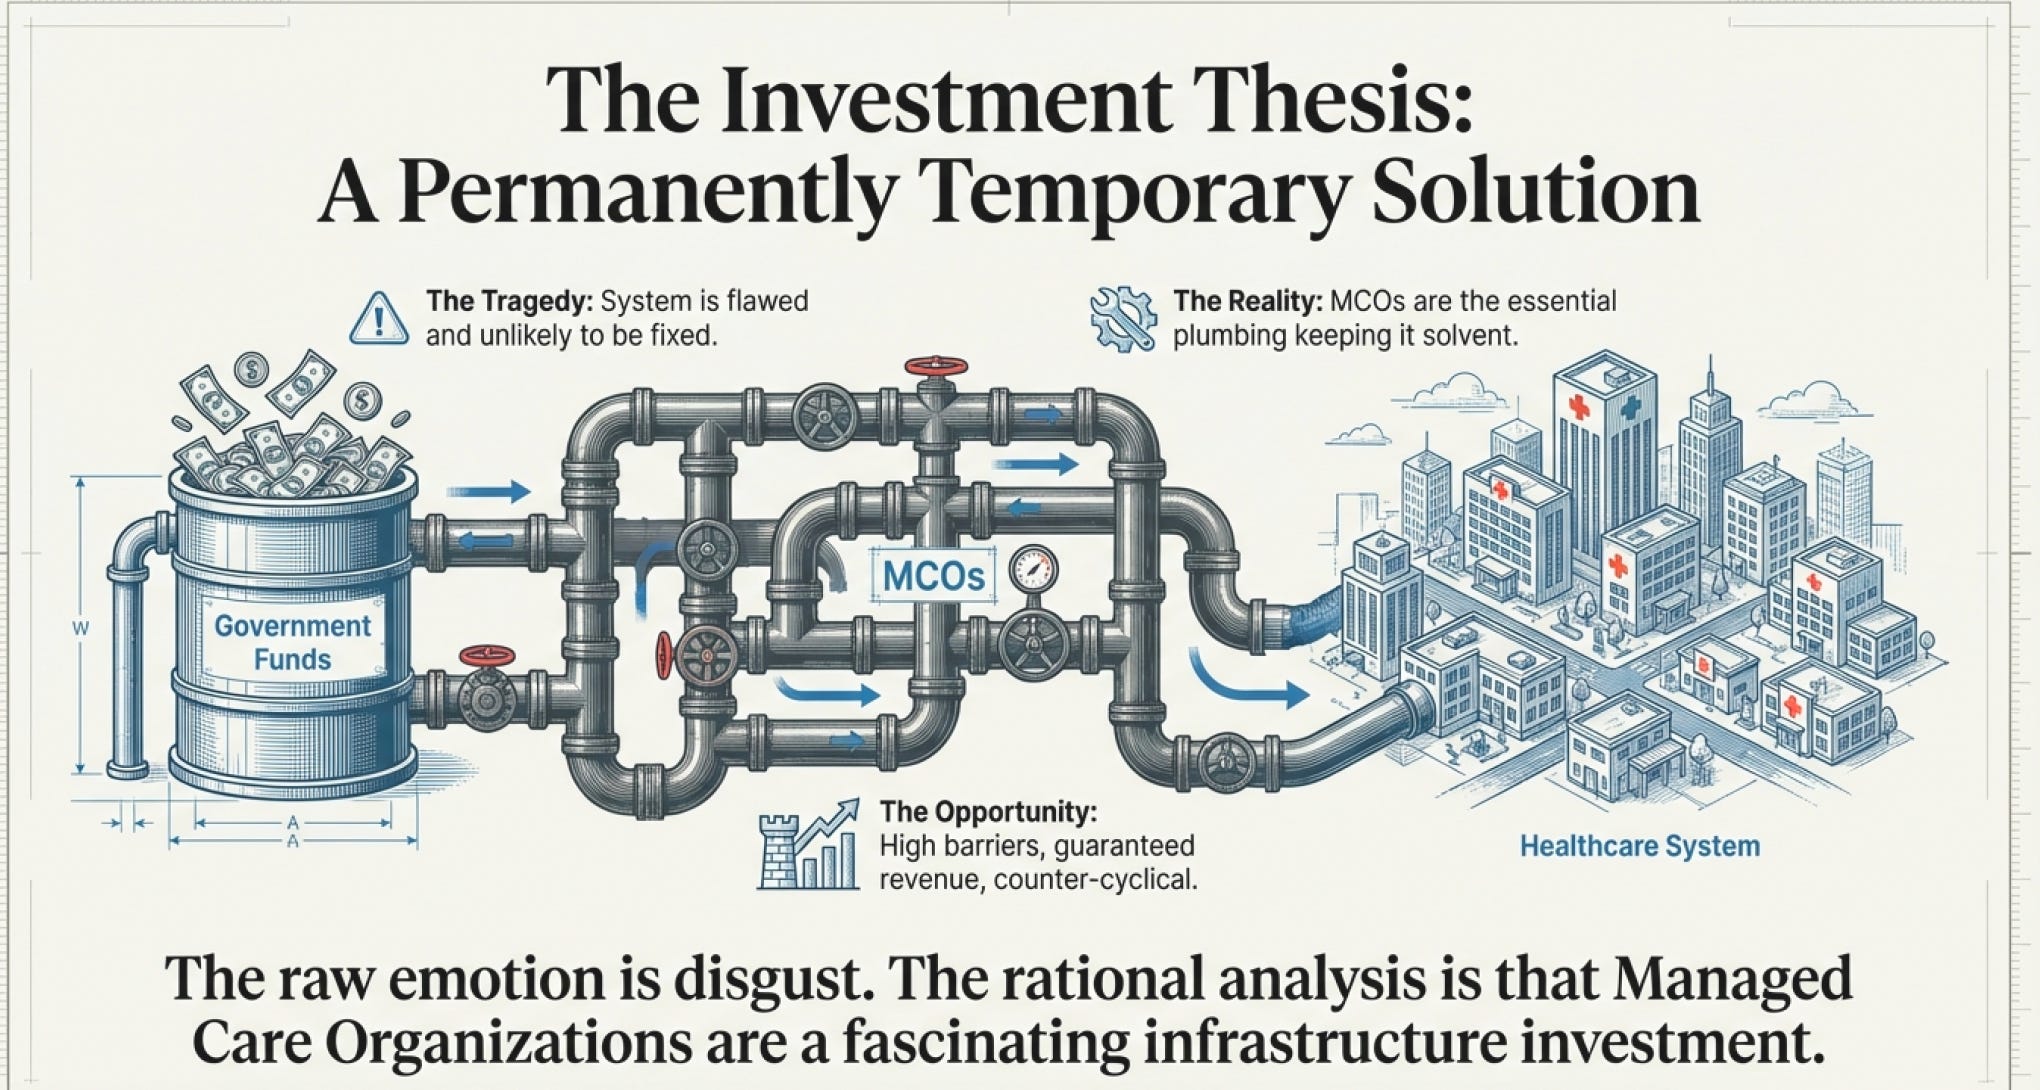
Here’s where the story comes full circle. Managed care organizations aren’t heroes. They’re not solving the trillion-dollar waste problem. They’re not eliminating preventable patient harm. They’re not even making healthcare significantly cheaper.
But they’re managing the chaos in a way that governments and employers find acceptable. They’re providing predictability in an otherwise unpredictable system. They’re creating scale economies that individual doctor’s offices can’t match - the irony - the system is still unpredictable.
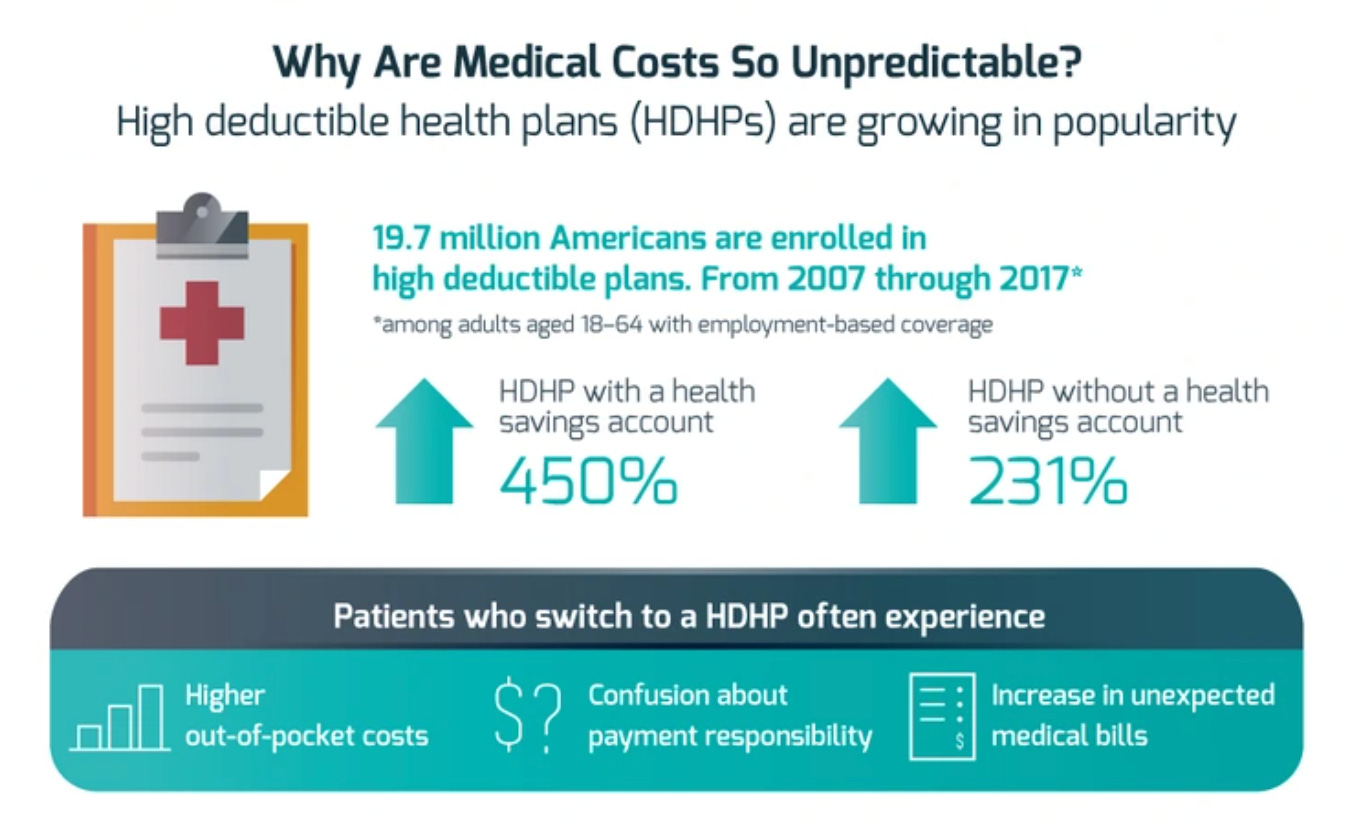
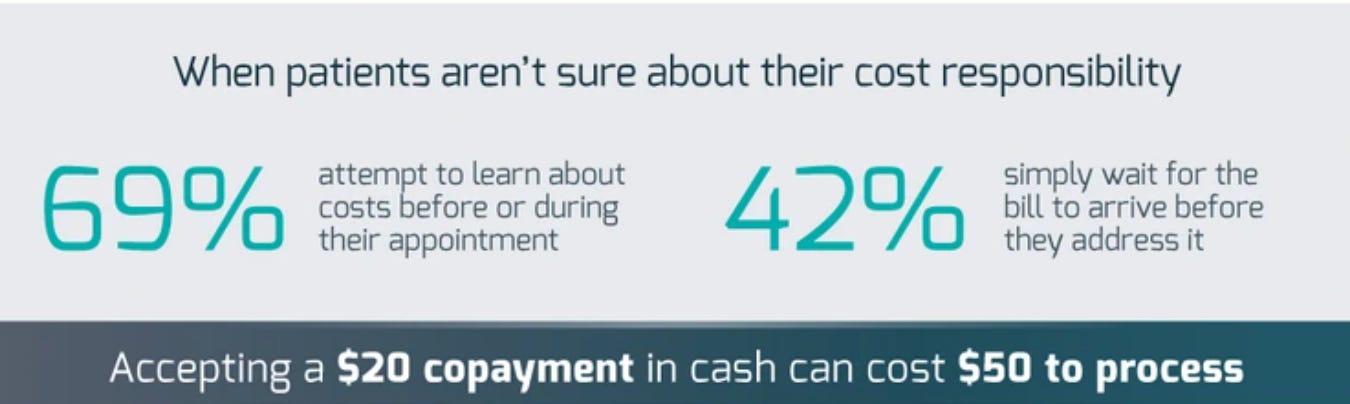
In other words, they’ve become what Munger calls a “damn fine business”—not because they’re beloved, but because they’re essential.
Think about it from first principles:
Question: What business characteristics make for predictable, sustainable profits?
Answer:
Essential service (people need healthcare)
High barriers to entry (regulatory, capital, expertise)
Government-backed revenue (Medicaid, Medicare)
Predictable costs (capitation + actuarial modeling)
Oligopoly structure (few large players)
Counter-cyclical demand (recessions increase Medicaid enrollment)
Managed care organizations check every box.
Why This Matters for Investors
The trillion-dollar patient harm problem isn’t getting solved. Americans aren’t suddenly going to embrace British-style single-payer or Singapore’s health savings accounts. The chronic disease epidemic is getting worse, not better.
Which means the companies managing this mess—flawed as they are—will continue to be essential infrastructure for decades to come.
The raw, irrational emotion here is disgust at the healthcare system. The rational analysis is that managed care organizations are the only scaled solution anyone’s found, which makes them—imperfect as they are—a fascinating infrastructure investment.
In Part 2, we’ll dive deep into the business and competitive landscape: the “Big Five” players, their moats, why Medicaid beats Medicare, and how to think about valuation in an industry where the government essentially guarantees your revenue.
2️⃣ Business & Competitive Landscape
Meet the Oligarchs
A Five-Horse Race Nobody’s Running
Imagine you’re watching a horse race. Five magnificent horses line up at the starting gate. The crowd buzzes with anticipation. The gate opens and... all five horses walk calmly onto the track, maintain careful distance from each other, and trot leisurely toward the finish line at roughly the same pace.
No one’s trying to win. No one’s trying to lose. They’re all just... participating.
Welcome to the managed care oligopoly.
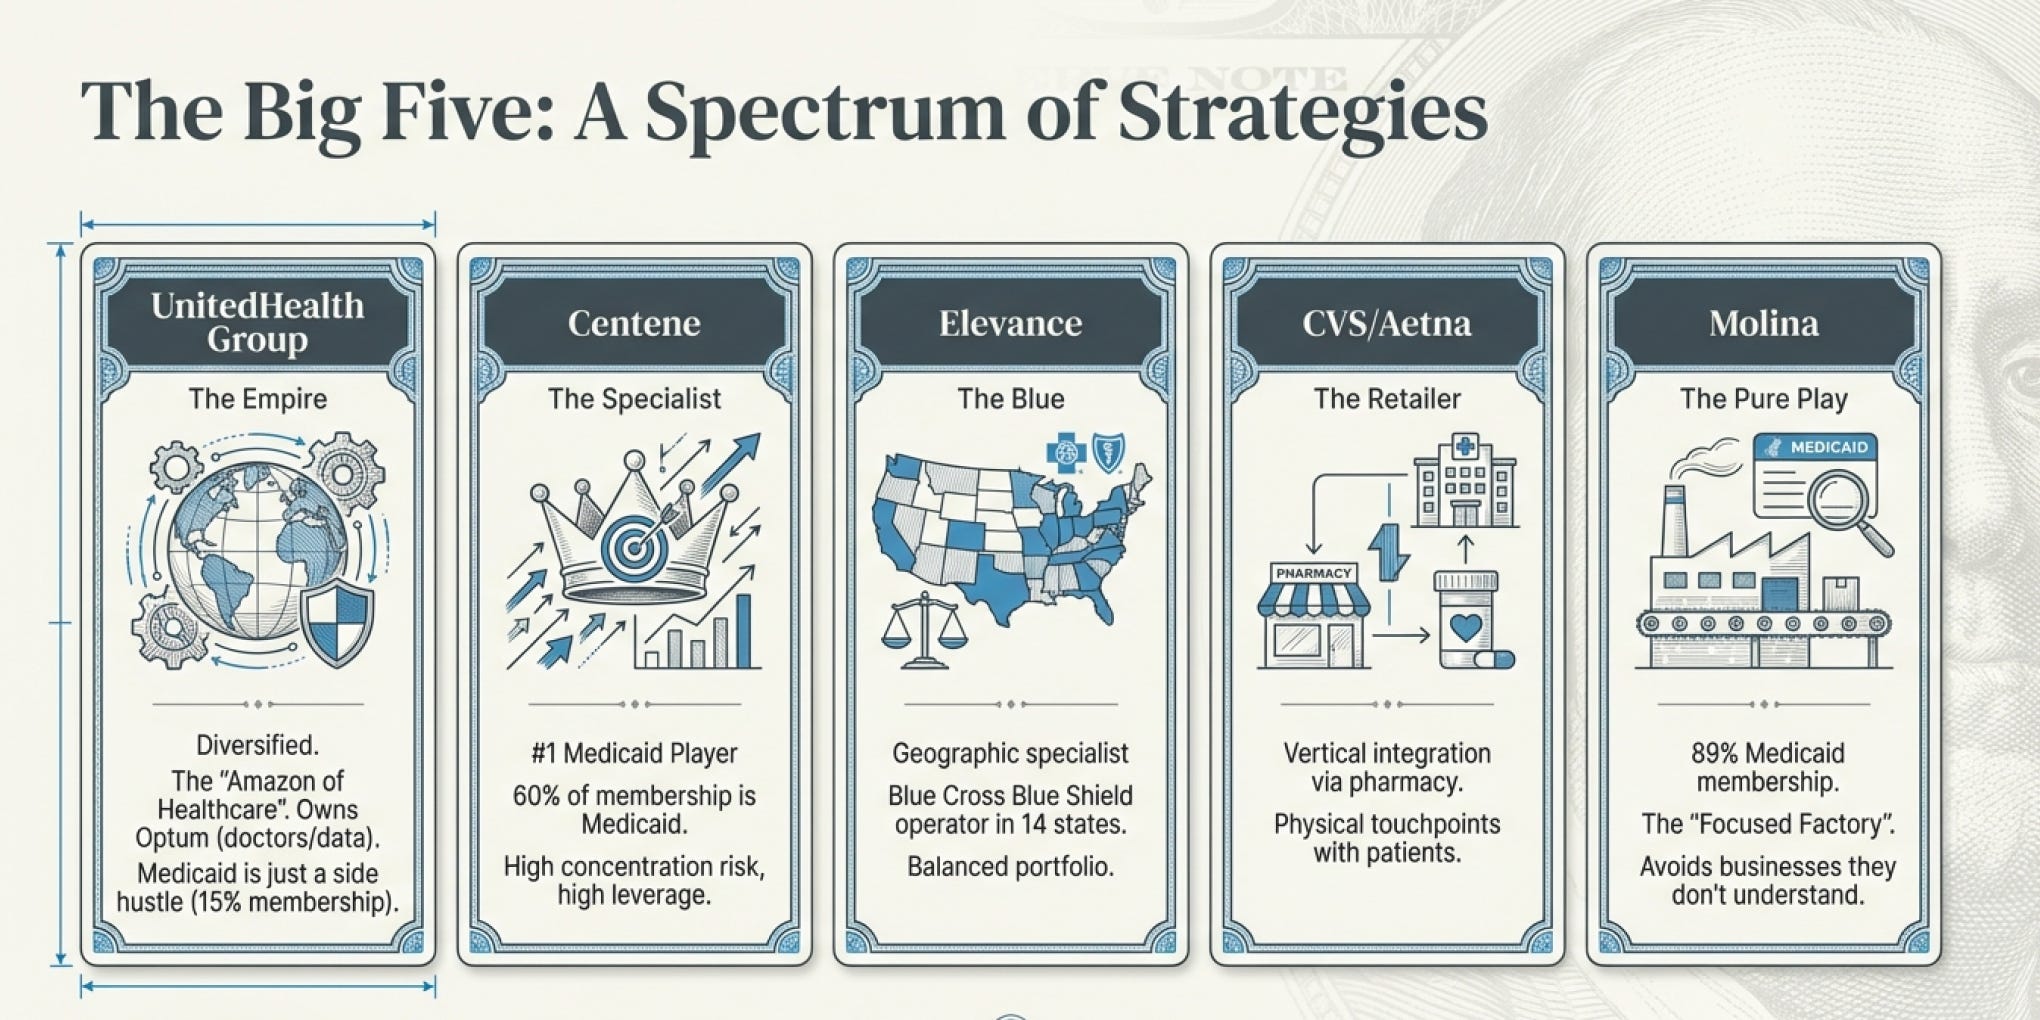
The “Big Five” as of 2024:
UnitedHealth Group - The 800-pound gorilla
Total medical membership: ~51 million
Medicaid members: ~7.6 million
Revenue: ~$371 billion (2023)
Market cap: ~$450 billion
Elevance Health (formerly Anthem)
Total medical membership: ~46 million
Medicaid members: ~9.2 million
Revenue: ~$175 billion (2024)
Market cap: ~$110 billion
Centene Corporation
Total medical membership: ~45.6 million
Medicaid members: ~13.1 million (highest of all)
Revenue: ~$144 billion (2024)
Market cap: ~$17 billion (currently distressed)
CVS Health/Aetna
Total medical membership: ~35 million
Medicaid members: ~2.5 million
Revenue: ~$358 billion (2024, includes retail pharmacy)
Market cap: ~$80 billion
Molina Healthcare
Total medical membership: ~5.5 million
Medicaid members: ~4.9 million (89% of total!)
Revenue: ~$33 billion (2024)
Market cap: ~$17 billion
Together, these five companies control approximately 50% of the Medicaid managed care market—serving over 36 million Medicaid beneficiaries. Each operates MCOs in 14 or more states.
Now here’s the fascinating part: they’re all operating in the same states, serving the same populations, offering essentially the same services... yet they’re all profitable.
Warren Buffett once said, “The most important thing to do if you find yourself in a hole is to stop digging.” The managed care industry found itself in a much better position: they realized they were standing on a gold mine, and all agreed to dig carefully so the mine wouldn’t collapse on anyone.
Five Players, Four Business Models
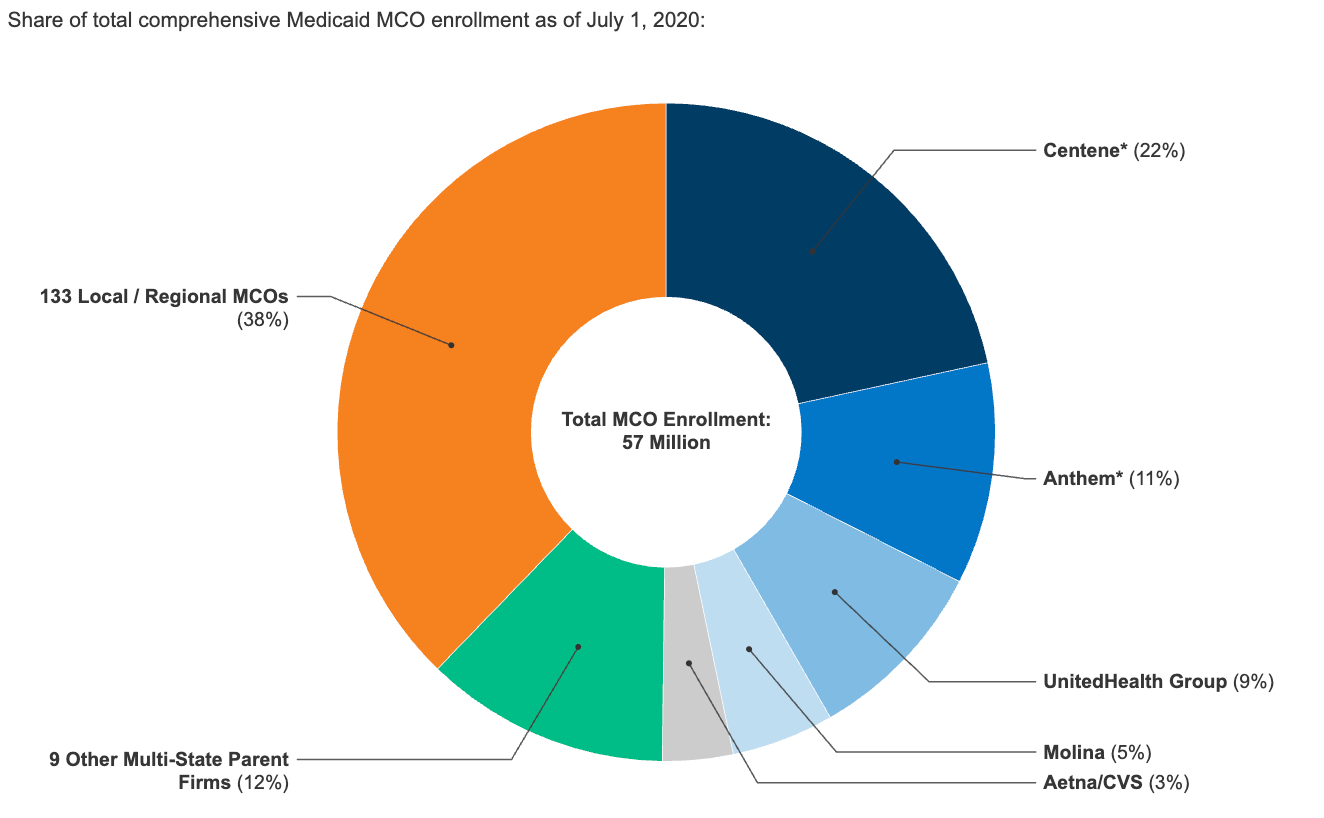
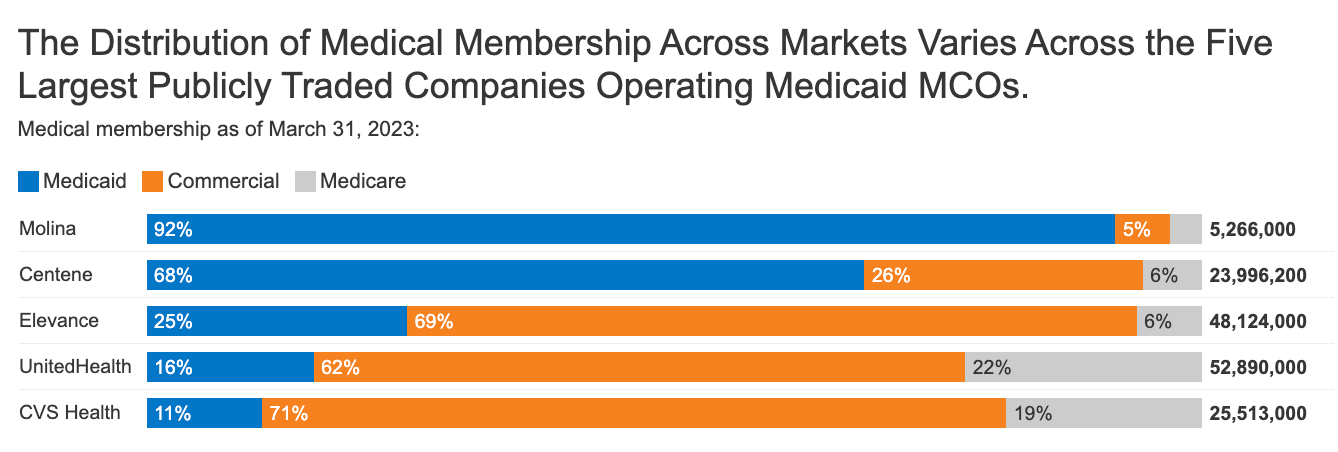
Let’s meet our protagonists more intimately:
Character 1: UnitedHealth Group - The Diversified Empire
UnitedHealth is what happens when a managed care company decides to vertically integrate everything. They own:
UnitedHealthcare (the insurance/MCO business)
Optum Health (care delivery - clinics, physicians, value-based care)
Optum Insight (data analytics, technology services)
Optum Rx (pharmacy benefits management)
It’s the Amazon of healthcare: not content to just sell health insurance, they want to own the delivery mechanism, the data infrastructure, and the pharmacy supply chain too.
Their Medicaid business? Only about 15% of total membership. UnitedHealth is like the wealthy kid who does Medicaid as a side hustle because, well, why not? The diversification makes them less vulnerable to any single line of business—Munger would call this “reducing the risk of ruin.”
Character 2: Elevance Health - The Geographic Specialist
Elevance (still called Anthem by most people) operates the Blue Cross Blue Shield plans in 14 states. They’re the classic “wide but not too deep” player—significant presence across multiple states and lines of business without dominating any single one.
Medicaid represents about 20% of their membership. They’re the balanced player, with meaningful exposure to commercial, Medicare, and Medicaid. Think of them as the diversified equity portfolio of MCOs—never the most exciting, rarely the worst performer.
Character 3: Centene - The Medicaid Specialist
Centene is the protagonist of our story, and like all good protagonists, they’re currently in a crisis.
With 13.1 million Medicaid members representing c.60% of their total membership, Centene is the most concentrated Medicaid player among the Big Five. They also happen to be the #1 player in the ACA Marketplace with 5.2 million members (21% of revenue).
If you wanted to make a pure play bet on government-sponsored healthcare, Centene is your vehicle. Which is both their strength and their current vulnerability—more on that later.
Character 4: CVS Health/Aetna - The Retail Integration Play
CVS is the only Big Five player that you can physically walk into. With 9,000+ retail pharmacies, CVS vertically integrated by acquiring Aetna for $69 billion in 2018. Their strategy: control the point of care (the pharmacy), the prescription benefit management, and the insurance.
Medicaid is only about 7% of their health plan membership. They’re in MCO business because it rounds out their ecosystem, not because it’s their primary focus.
Think of CVS as the company that said, “We’re already touching patients when they pick up prescriptions; might as well own their insurance too.”
Character 5: Molina Healthcare - The Pure Play
Molina is the most fascinating of the five because they’re the purest expression of the Medicaid business model. With 89% of their membership in Medicaid, they’re essentially a leveraged bet on government healthcare for low-income populations.
They operate in only 19 states but dominate in the markets where they compete. It’s the “focused factory” approach—do one thing, do it well, and don’t get distracted by sexy Medicare Advantage or employer contracts.
Charlie Munger would probably approve: “I think part of the popularity of Berkshire Hathaway is that we look like people who have found a trick. It’s not brilliance. It’s just avoiding stupidity.”
Molina avoided the stupidity of overextending into businesses they don’t understand. They just do Medicaid.
The Central Conflict: The Illusion of Competition
Here’s where our story gets interesting. In most industries, when five large players control 50% of a market, you’d expect brutal competition. Price wars. Market share battles. Aggressive expansion into each other’s territories.
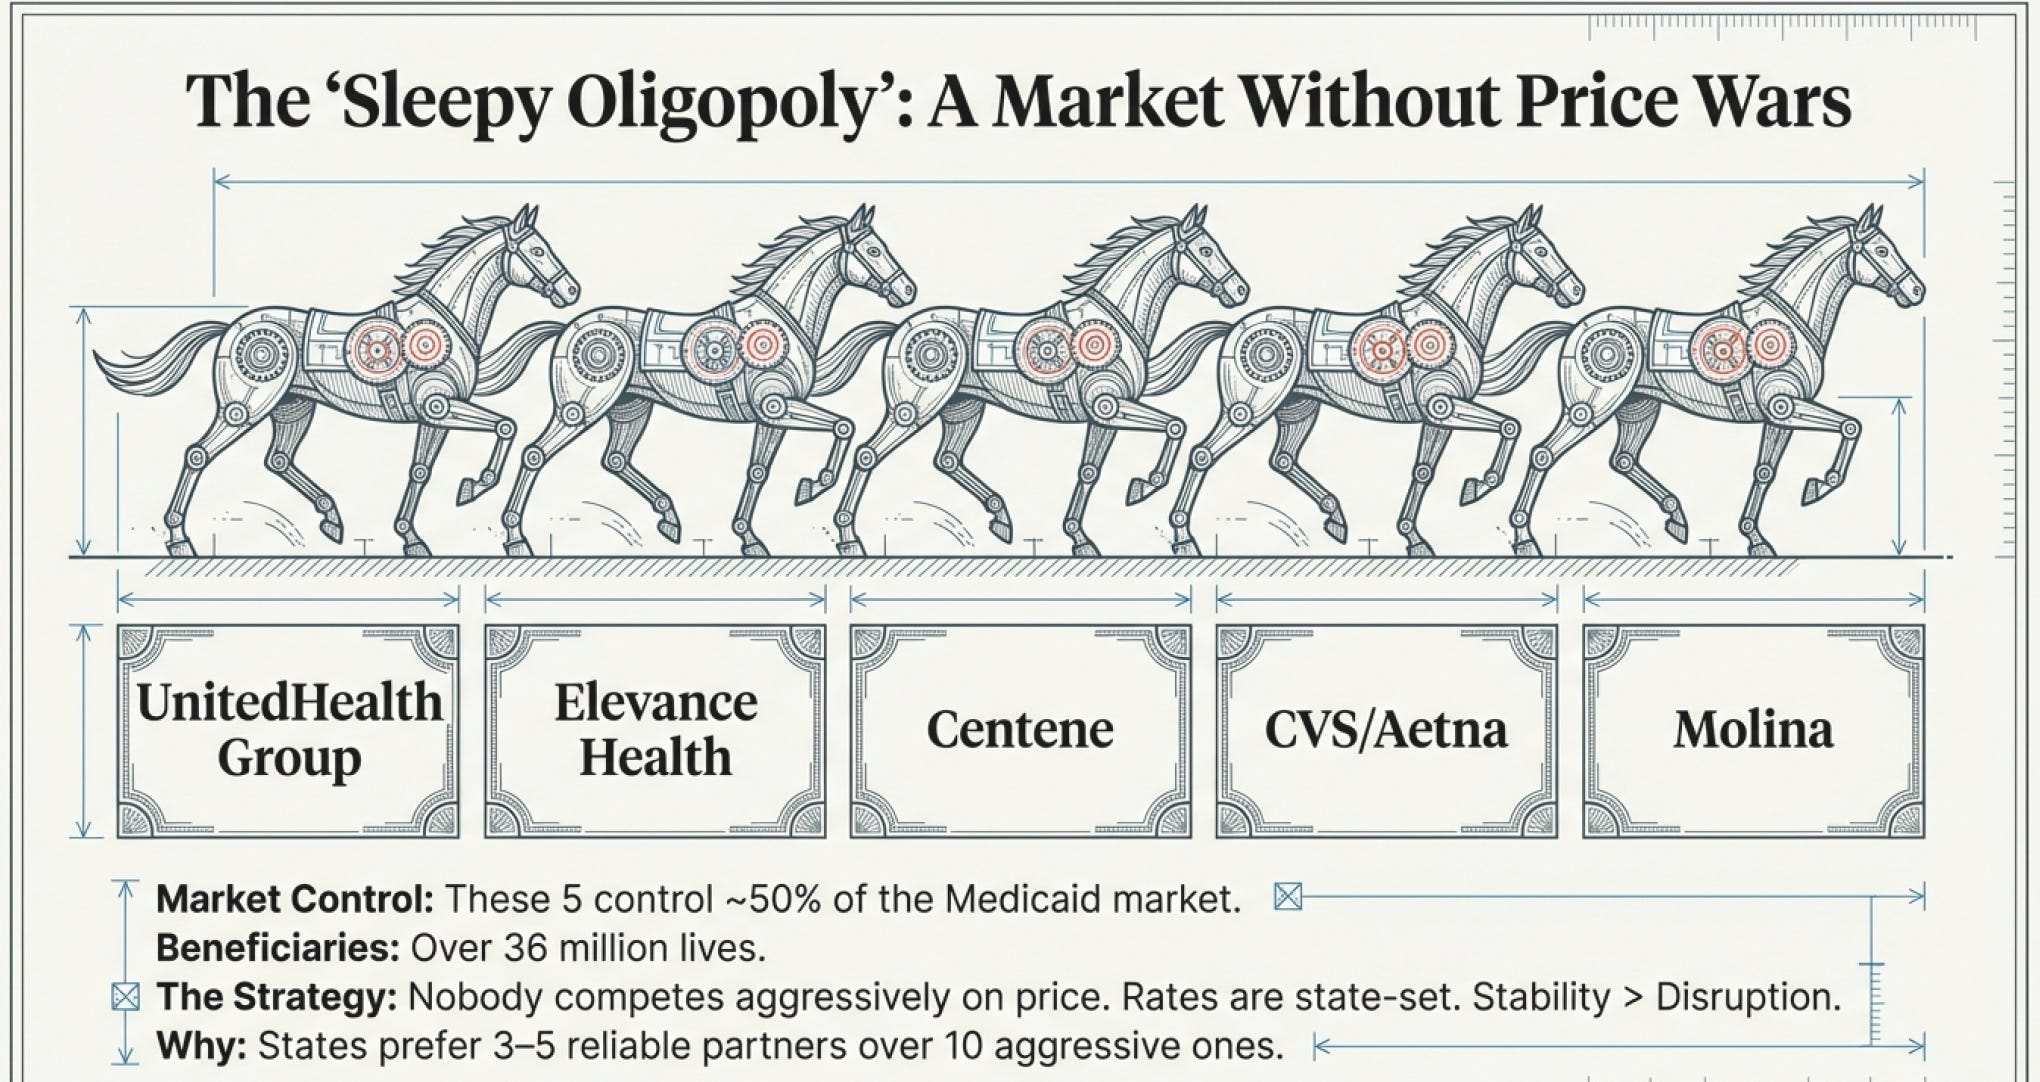
In managed care? Nothing of the sort.
All five companies operate in many of the same states. All five are bidding on the same state contracts. Yet somehow, all five remain profitable. All five are growing (or at least were until recently). All five maintain similar margins.
How is this possible?
The answer reveals the fundamental nature of this business—and why it’s such a compelling infrastructure investment.
Confrontation - The Business Model Unveiled
The First Revelation: Medicaid Beats Medicare (Seriously)
Pop quiz: Which is the better business—Medicaid managed care or Medicare Advantage?
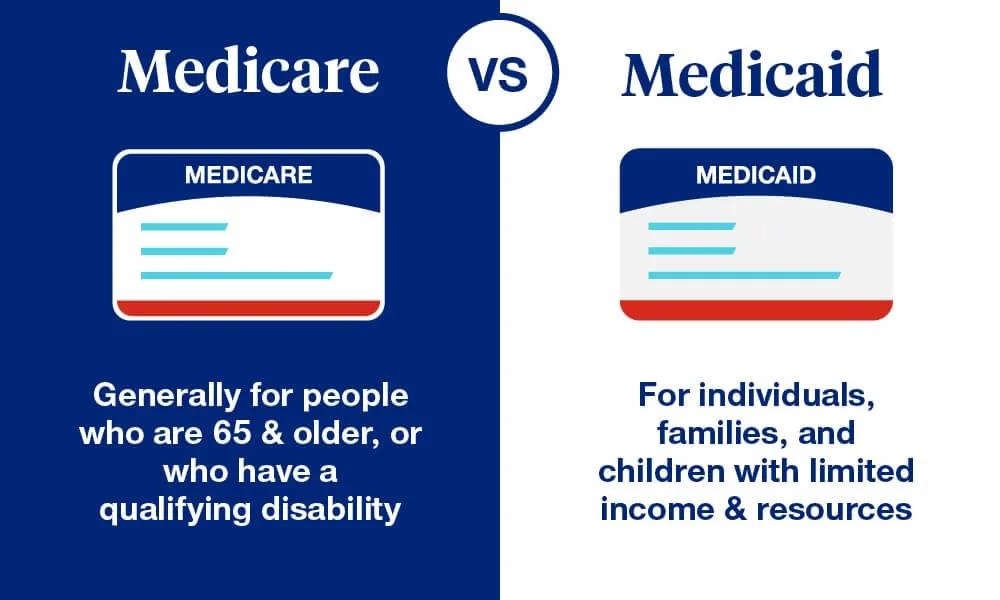
If you said Medicare, you’d be in good company. Most investors think Medicare is superior because:
Older patients with higher spending
More premium revenue per member
Less political interference
Growing market (aging population)
You’d also be wrong.
Let me explain why Medicaid is actually the superior business using first principles:
Question: What makes a great recurring revenue business?
Answer: Predictability of revenue, stickiness of customers, barriers to switching, and alignment of incentives.
Now let’s compare:
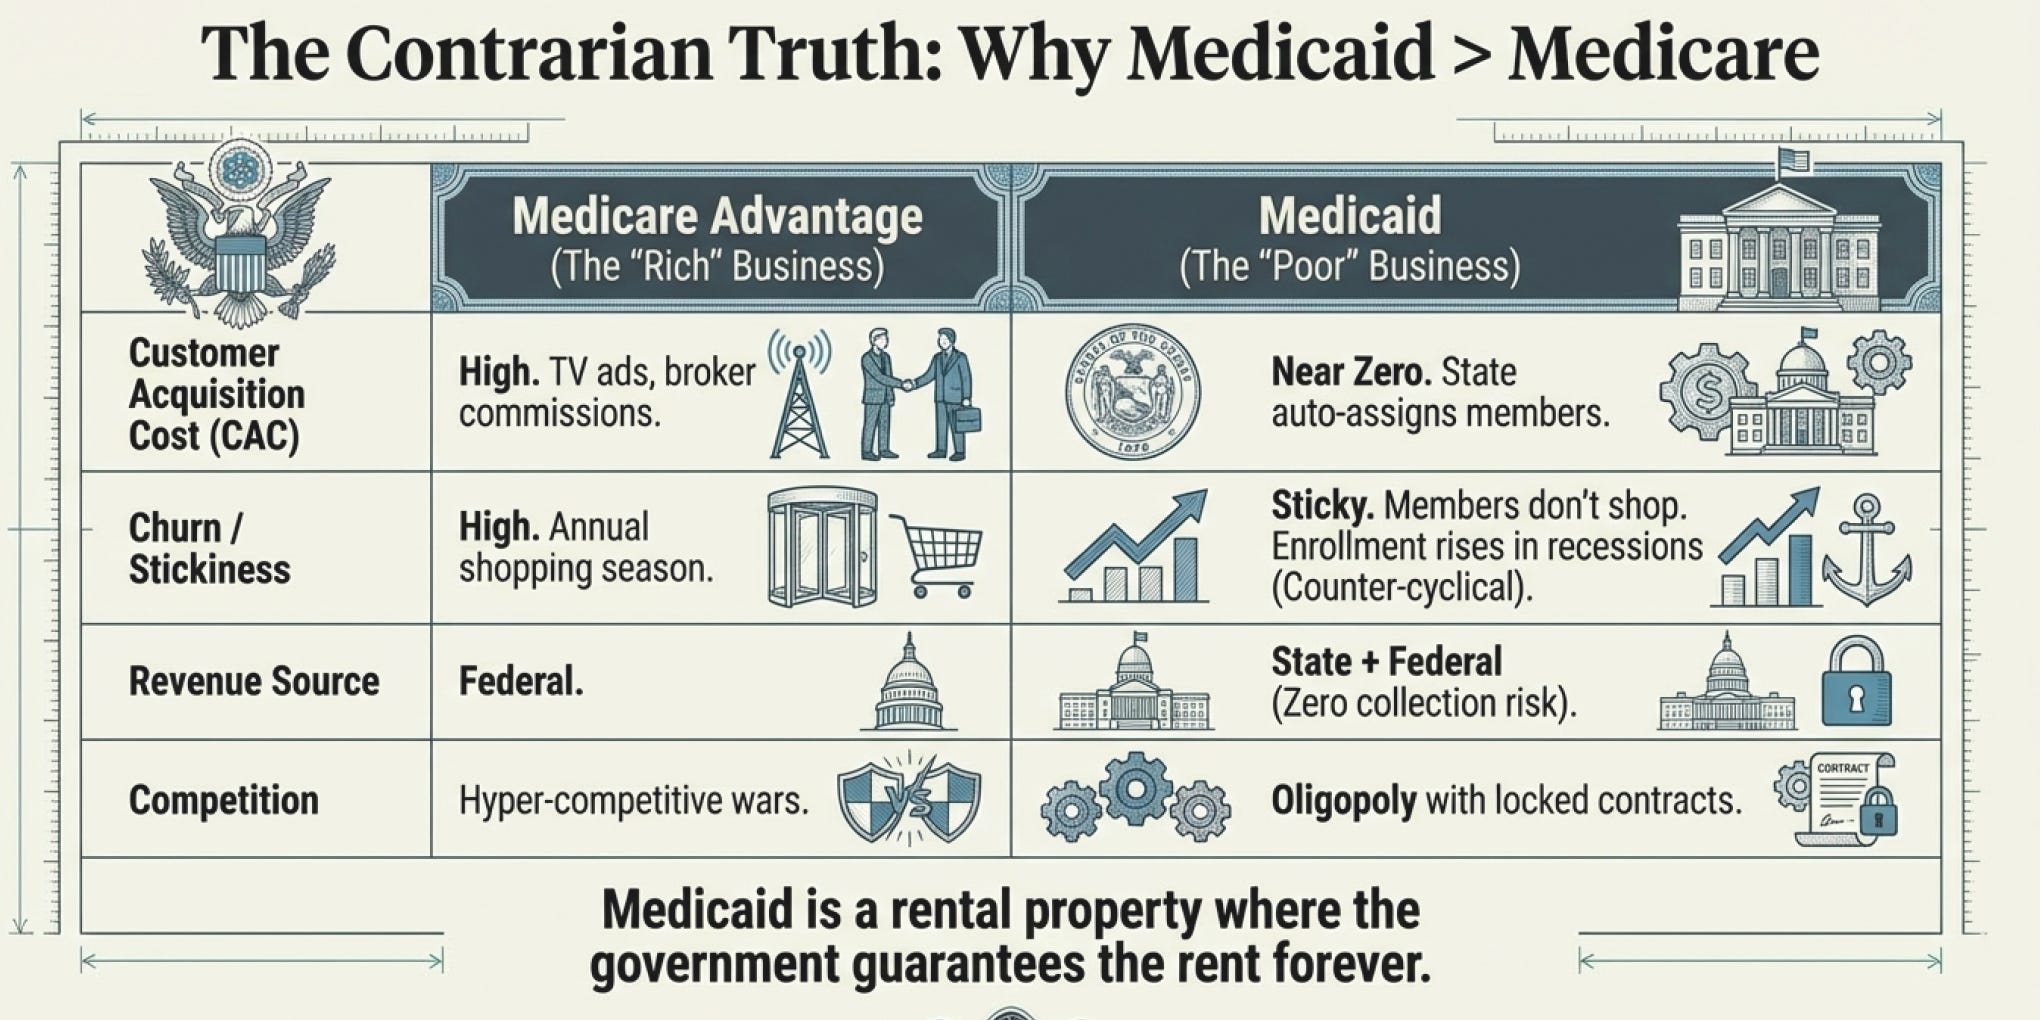
Medicaid Advantages:
Predictable, Stable Enrollment
Medicaid enrollment is tied to income thresholds and state eligibility rules, meaning enrollment rises during recessions with no voluntary switching—unlike Medicare Advantage where members often switch based on marketing.
Think about it: When someone loses their job, they don’t choose Medicaid. They become eligible for Medicaid. And once on it, they don’t shop around for better plans. The state assigns them to an MCO, and that’s that.
Medicare Advantage? Every fall, seniors are bombarded with ads from Joe Namath and William Shatner telling them to switch plans. Customer acquisition costs are enormous—often hundreds of dollars per member. Churn is significant.
In Medicaid, the state does your marketing for you. For free.
Massive TAM (Total Addressable Market)
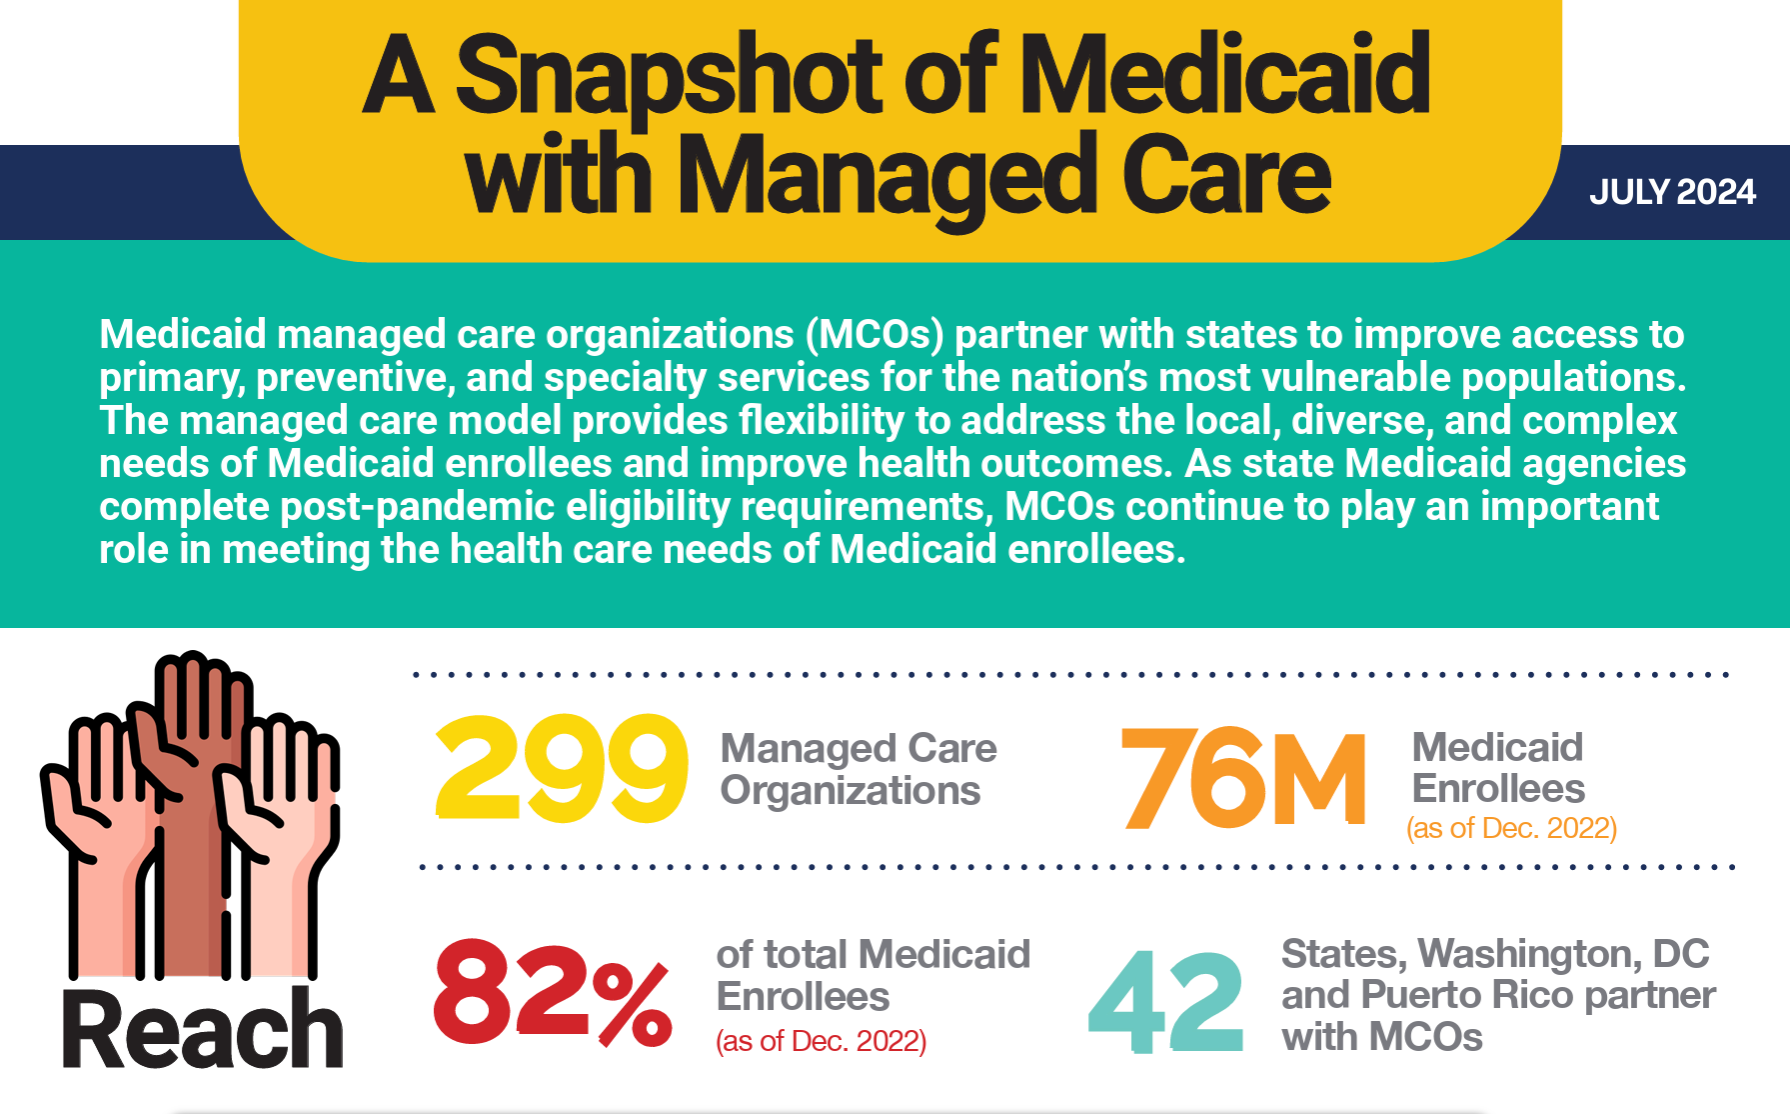
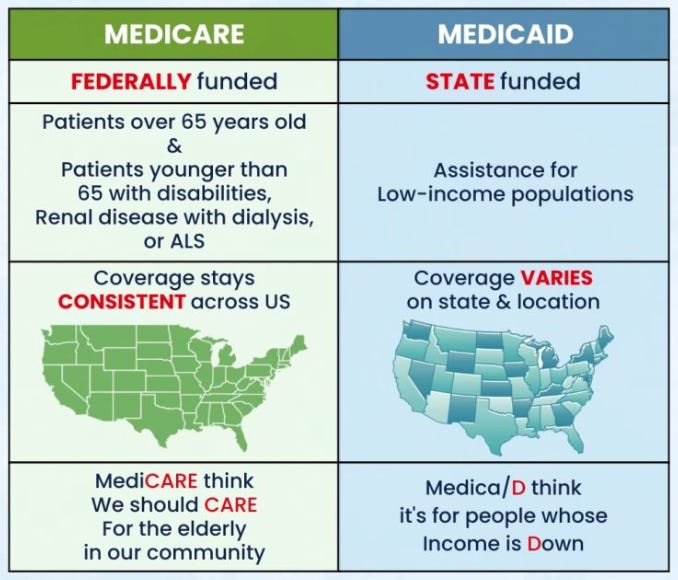
Medicaid covers 85-90 million+ Americans, far more than Medicare Advantage’s 33 million. And in many states, 70-90% of Medicaid is outsourced to private MCOs.
Better yet, most of this market is still underpenetrated. Many states are just now moving complex populations (long-term care, behavioral health, aged/blind/disabled) into managed care. Each new population comes with significantly higher per-member-per-month payments.
State-Paid Premiums = Zero Collection Risk
With commercial insurance, you worry about employers going bankrupt. With individual plans, you worry about people not paying premiums.
With Medicaid? The state pays capitation—per member per month payments—directly to MCOs, with federal support, meaning zero risk of non-payment from members who pay no premiums and almost no cost-sharing.
It’s like having a rental property where the government guarantees the rent checks. Forever.
Lower Customer Acquisition Costs
Medicare Advantage insurers spend hundreds of dollars per member on TV ads, agent commissions, broker fees, lead generation, and marketing materials. It’s a full-contact sport.
Medicaid insurers spend dramatically less because states auto-assign most members. There’s minimal competitive switching. Members generally don’t “shop around” because they’re just trying to access healthcare, not optimize their insurance portfolio.
It is estimated that Medicaid Customer acquisition cost is less than 20% of Medicare Advantage. That’s enormous when you’re operating on 3-5% margins.
High-Acuity, High-Premium Populations
Here’s the counter-intuitive part: the sickest Medicaid patients are actually the most profitable.
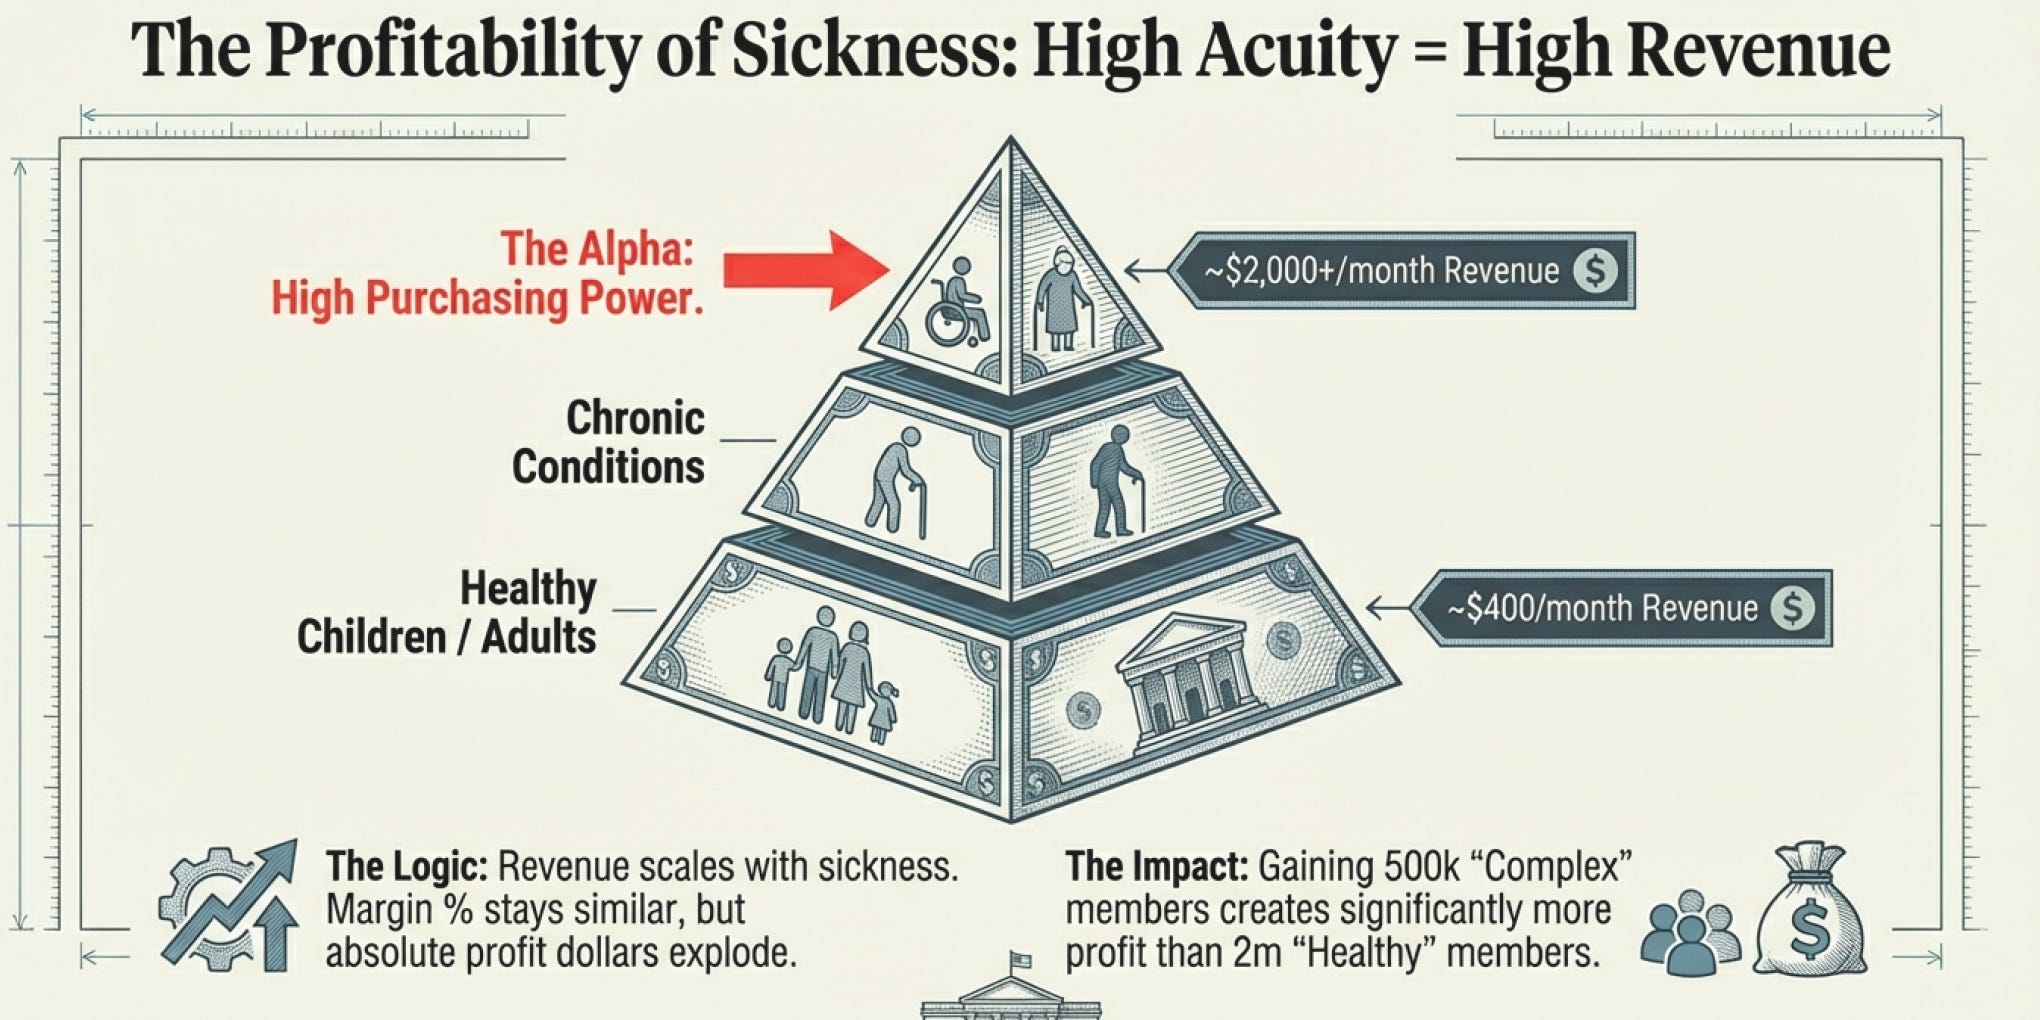
Why? Because states pay significantly higher capitation rates for complex populations:
Long-term care patients
Aged/blind/disabled populations
Behavioral health populations
Dual eligibles (Medicare + Medicaid)
These members might have 3-10x the capitation of standard Medicaid adults. And because MCOs can invest in specialized care management for these populations, they can actually improve outcomes while maintaining profitability.
It’s the classic Munger inversion: “Tell me where I’m going to die, so I don’t go there.” Most insurers avoid the sickest patients. Smart Medicaid MCOs lean into them—because that’s what you get with a customer that has almost unlimited purchasing power.
Fewer Competitors
The Medicare Advantage market is hypercompetitive: UnitedHealth, Humana, CVS/Aetna, Elevance, Kaiser, dozens of regional payers, plus new entrants constantly trying to innovate.
Medicaid is the opposite. In many states there are only 2-5 winning MCOs, with very high switching barriers and multi-year locked contracts.
Winning one contract can yield billions in guaranteed revenue for years. And once you’re operating in a state, the relationship becomes quasi-permanent. States don’t want to destabilize care by constantly switching MCOs.
The Medicare Disadvantages:
Let me flip this around using Munger’s favorite trick—inversion. What makes Medicare Advantage difficult?
Stars ratings tyranny - CMS rates plans on 40+ quality measures. Drop from 4 stars to 3.5 stars? You lose bonuses and members flee. It’s like running a restaurant where Yelp ratings directly control your profitability.
Annual shopping season - Every October through December, seniors shop for new plans. It’s like having your entire customer base re-evaluate you annually. Try building long-term value when customers might leave in 90 days.
Broker/agent economics - You’re paying intermediaries to sell your product, and they’re incentivized to switch customers to whoever pays the highest commission. It’s like hiring salespeople who work for your competitors too.
Rate pressure - CMS constantly tinkers with payment formulas. The 2024 rate cuts? Many Medicare Advantage plans saw benchmark reductions. In Medicaid, if states cut rates too much, MCOs just... stop bidding on contracts. States need MCOs more than MCOs need any individual state.
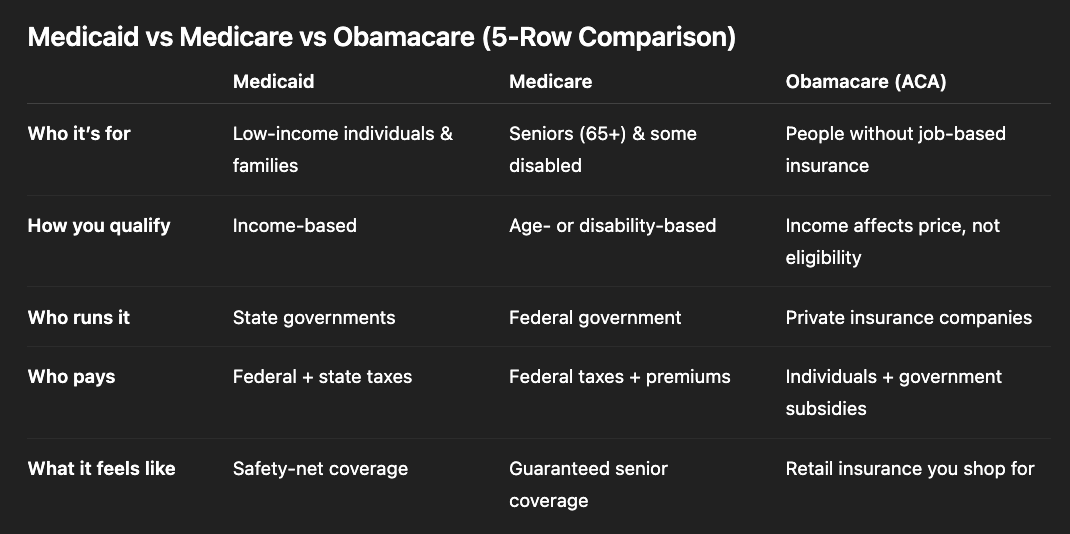
To summarise things, here’s a comparison with ACA marketplace/ Obamacare included
The Business Model Deep Dive: How Money Flows
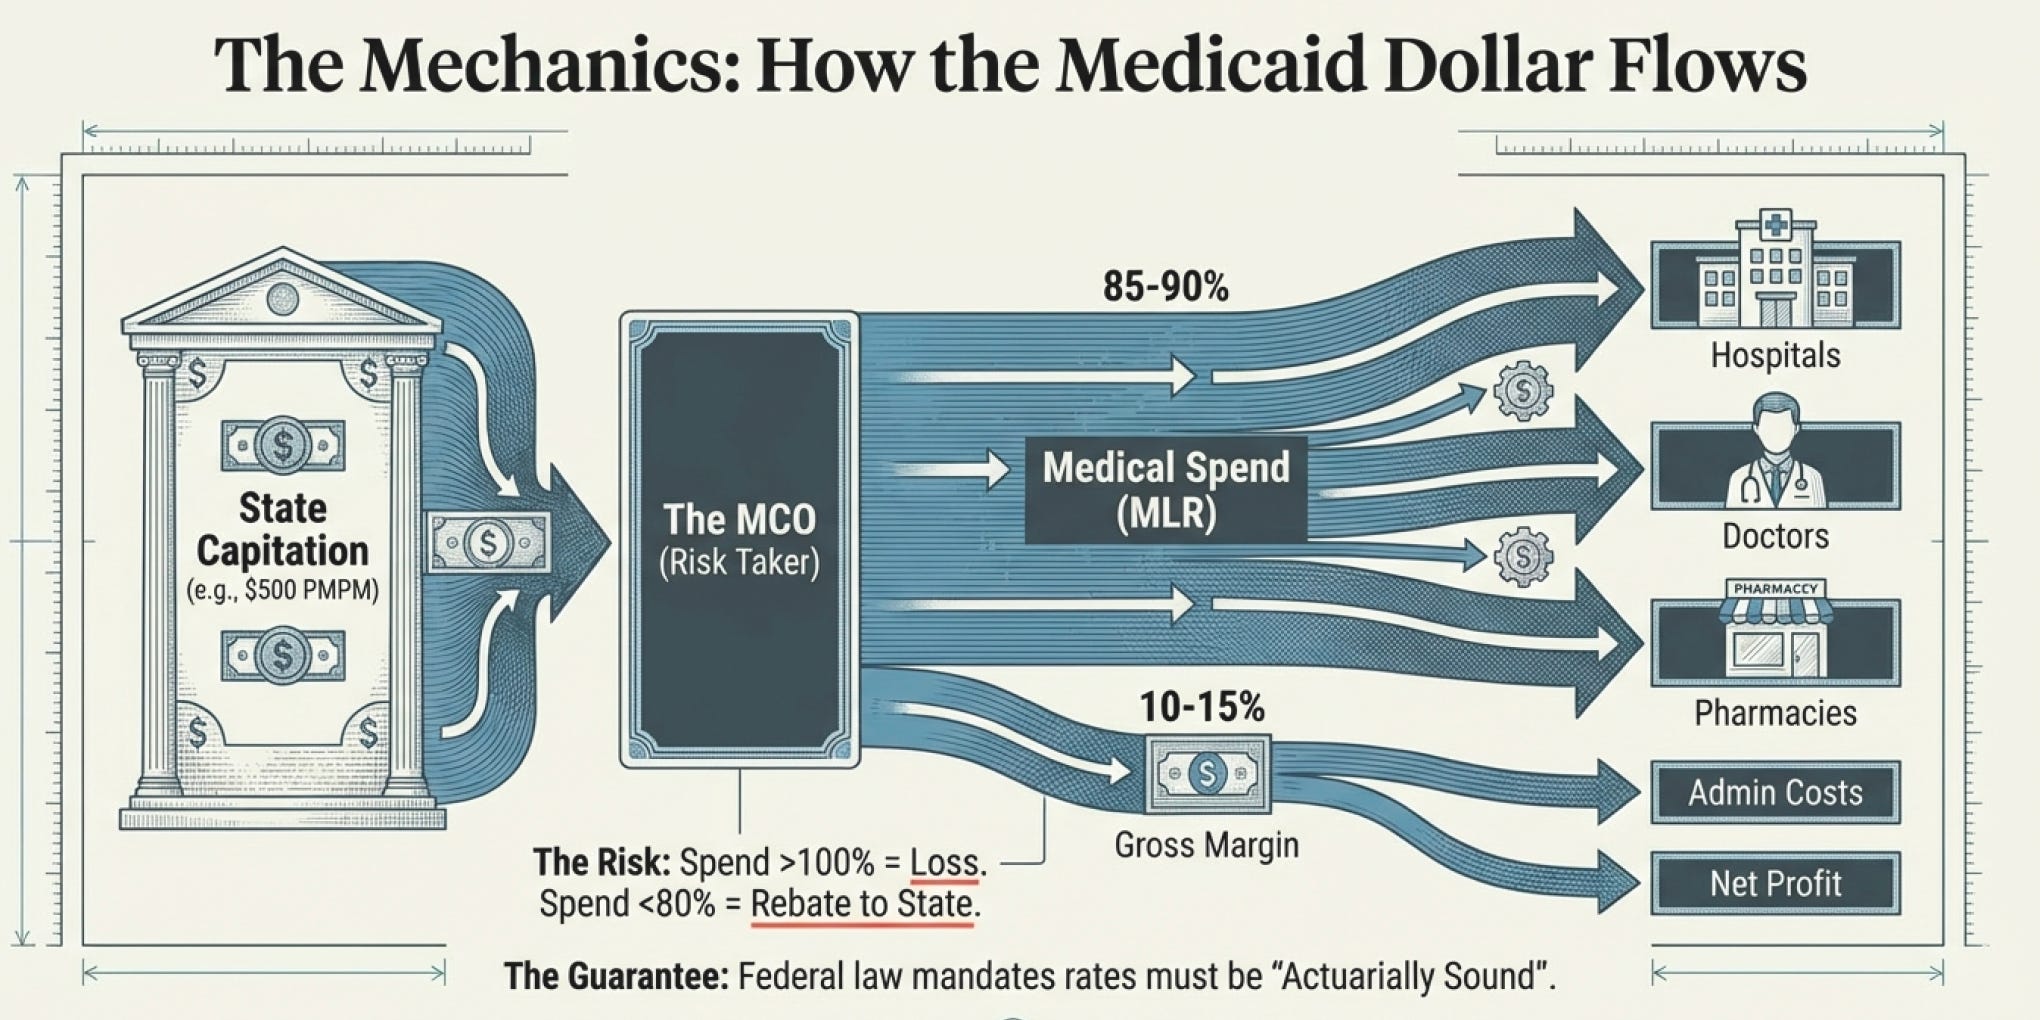
Alright, let’s get into the mechanics. How do MCOs actually make money?
Imagine you’re running a Medicaid MCO in Texas. Here’s what happens:
Step 1: The State Sets Capitation Rates
Texas (like all states) must develop “actuarially sound” capitation rates. This means rates projected to provide for all reasonable, appropriate, and attainable costs required under contract terms for the managed care plan’s operation.
The state uses historical claims data (typically 1-2 years old), trends it forward for medical inflation and utilization changes, adjusts for any program changes, and arrives at a per-member-per-month rate for different populations.
Example rates (simplified):
Standard adult: $400/month
Child: $250/month
Pregnant woman: $800/month
Disabled adult: $1,500/month
Dual eligible (Medicare + Medicaid): $2,000/month
Step 2: You Sign a Contract
You agree to provide all covered Medicaid benefits for these capitation rates. The state enrolls members into your plan, and you start receiving monthly payments.
If you have 500,000 members at an average rate of $500/month, that’s $250 million per month or $3 billion annually in revenue.
Step 3: You Spend Money on Medical Care
Now you have to actually provide healthcare. You pay:
Hospitals for inpatient stays
Doctors for office visits
Pharmacies for prescriptions
Labs for tests
Everything else covered under the benefit package
Your goal is to spend, on average, 85-90% of premium revenue on medical care. This percentage is called the Medical Loss Ratio (MLR).
If you spend $2.7 billion on medical care, your MLR is 90%. That leaves $300 million for administrative costs and profit.
Step 4: You Manage Administrative Costs
Out of that $300 million, you need to:
Process claims
Manage care coordination
Run customer service
Comply with state reporting
Pay your employees
Maintain IT systems
Marketing (minimal in Medicaid)
When the Model Breaks
In 2023-2024, something unusual happened: the business model temporarily broke.
During COVID, states implemented continuous enrollment—no one could be kicked off Medicaid. Enrollment swelled from 71 million to over 90 million. MCOs were thrilled. More members = more revenue.
Then in April 2023, the “unwinding” began. States started redeterminations—checking if people still qualified for Medicaid. Combined Medicaid enrollment across the Big Five declined by more than 7 million since March 2023, though it remained 6.2 million (or 20%) higher than at the pandemic’s start.
But here’s the twist: the healthiest members left. People with jobs, mild conditions, or other coverage options found private insurance. Who remained? The sickest, most complex, most expensive patients.
Suddenly, MCOs’ actuarial models were wrong. They’d priced their 2024 contracts based on historical mix assumptions that no longer applied. Medical Loss Ratios spiked.
The two firms that reported Medicaid MLRs saw them increase in 2024—Centene from 89.9% to 92.3% and Molina from 88.5% to 90.3%—implying a potential decrease in profitability.
For context: a 2.4 percentage point MLR increase on $90 billion in Medicaid revenue (Centene’s scale) equals $2.16 billion in unexpected medical costs.
No wonder Centene’s stock crashed from $80 to $35.
Rising Stakes: The Rate Reset Cycle
Now we get to the critical dynamic that most investors miss: the rate reset cycle.
About two-thirds of responding MCO states reported seeking CMS approval for capitation rate amendments to address shifts in the average risk profile of MCO members in FY 2024 and/or FY 2025.
Here’s what’s happening:
Phase 1 (2023): Redeterminations Begin
Healthy members leave
Acuity increases
But rates are locked for the contract year
Phase 2 (2024): MCOs Bleed
Medical costs exceed projections
MLRs spike to 92-93%
Profits evaporate
Stock prices crater
Phase 3 (2025-2026): Rate Adjustments
States complete new rate studies
Data now reflects post-unwinding population
New rates incorporate higher acuity
Margins normalize
Phase 4 (2027+): Equilibrium Returns
Rates match actual costs
MLRs return to 88-90%
Profits recover
Stock prices recover
This isn’t speculation. It’s happened before. During the 2016-17 pharmacy cost shock, the same cycle played out. MCOs bled in 2016, rates adjusted in 2017, margins recovered by 2018.
The Competitive Dynamic: Why Nobody Competes on Price
Here’s what’s bizarre about this industry: despite having five major players in most states, nobody competes aggressively on price or margins.
Why not?
Because the business model prevents it.
Remember: Medicaid managed care rates are developed by states and their actuaries and reviewed and approved by CMS, with plans required to achieve actuarial soundness. Plans can’t just slash prices to gain market share because:
Rates are state-determined, not plan-determined - You bid on contracts, but the state sets the payment rates. If rates are $500/month, everyone gets $500/month for that member type.
Unprofitable contracts get rejected - If you bid unrealistically low margins to win share, you’ll either a) lose money and exit the state, or b) go back to the state begging for rate increases. Neither builds long-term relationships.
States want stability - States don’t want their Medicaid programs disrupted by MCO failures. They prefer 3-5 reliable partners over 10 aggressive competitors constantly churning.
Scale economics favor incumbents - The fixed costs of operating in a state are enormous. New entrants face a multi-year path to profitability. Most don’t bother.
The result? An oligopoly that’s stable, predictable, and quietly profitable.
It’s what Munger calls a “sleepy oligopoly”—the best kind. Enough competition that you can’t be lazy, but not so much that anyone destroys value.
Resolution - The Permanent Oligopoly
The Final Confrontation: Can This Last?
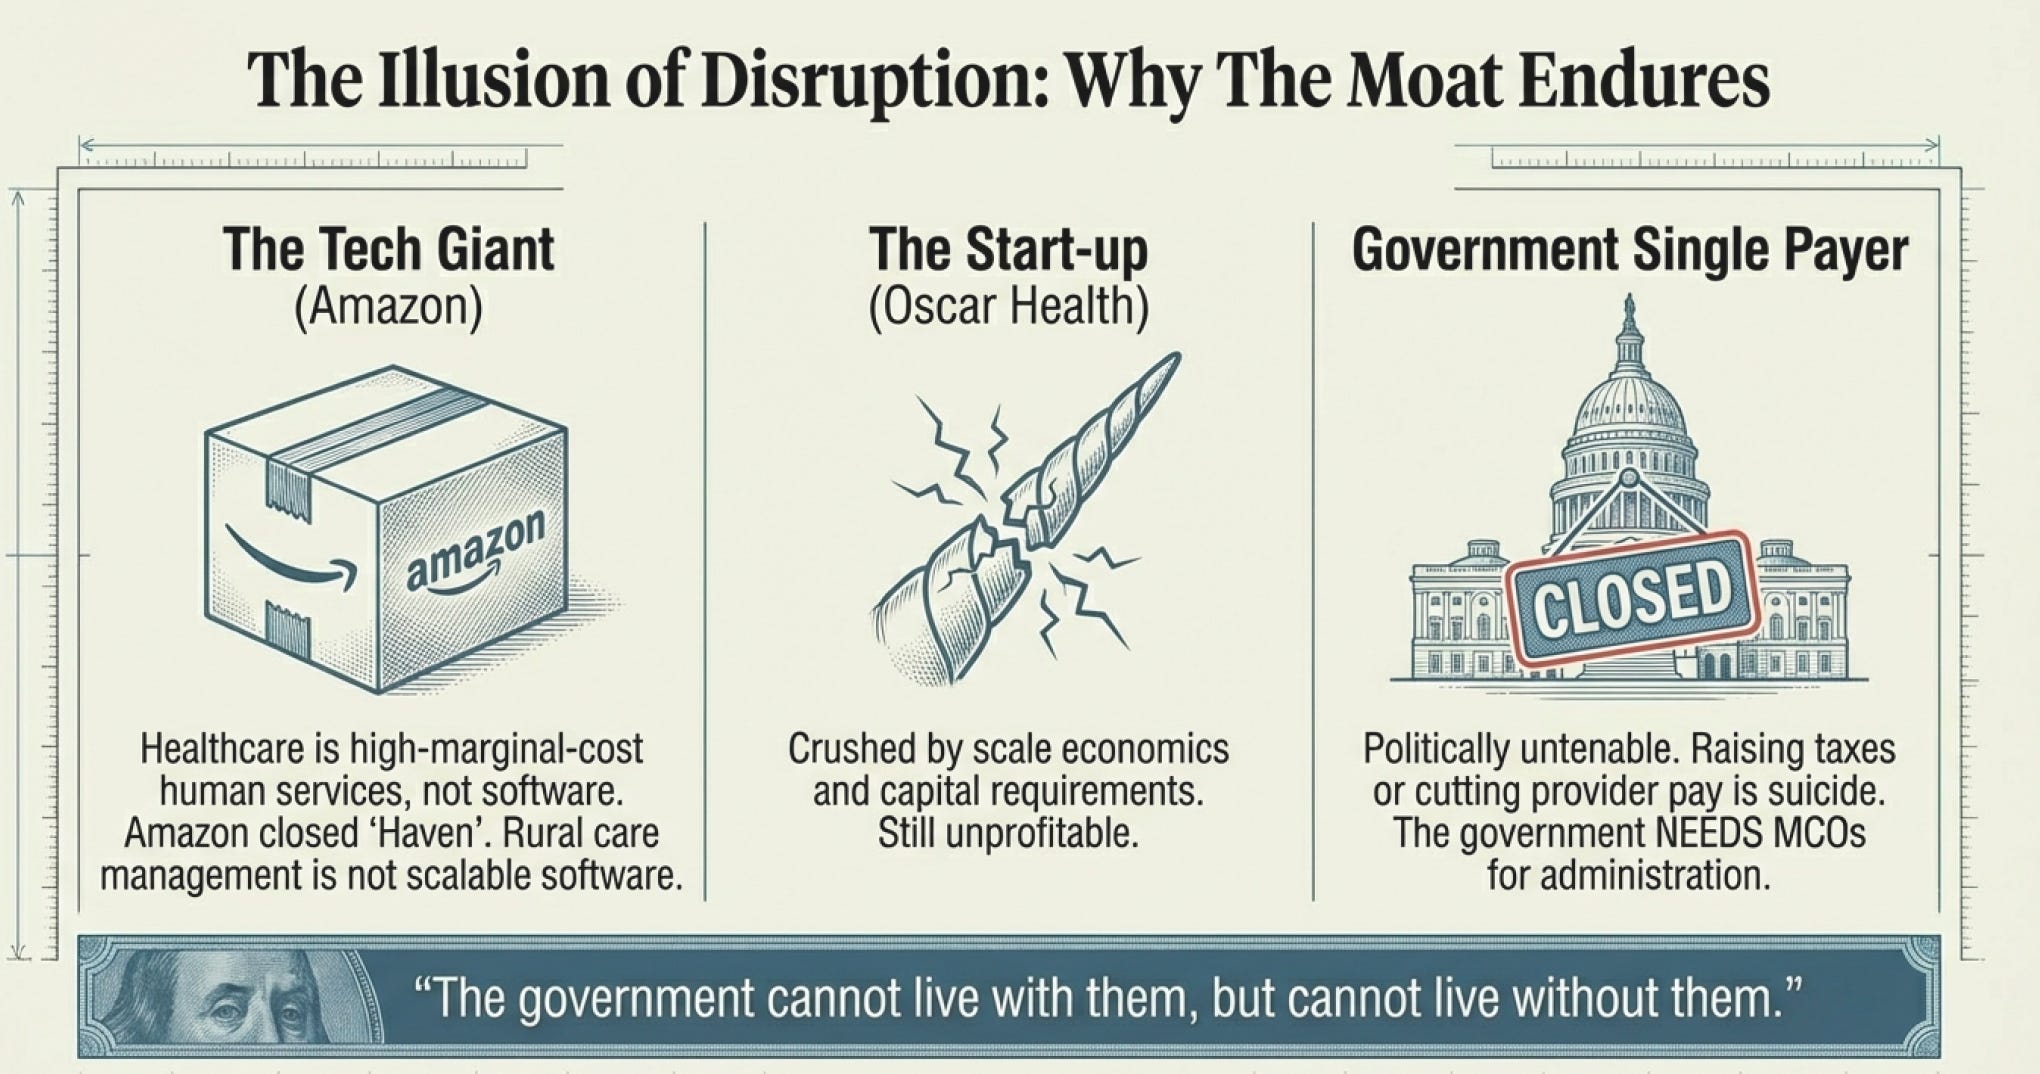
Every investor’s question: “Sure, this looks good now, but what about disruption? What about value-based care startups? What about Amazon entering healthcare?”
Let me channel Munger’s approach to this: inversion. Ask not “What could go right?” but “What would it take to kill this business?”
Scenario 1: A Well-Funded Startup
Oscar Health tried this. They raised $1.6 billion in venture capital to disrupt health insurance with technology and better member experience. They focused on ACA Marketplace plans, not Medicaid, because Medicaid is “too hard.”
Result? They went public via SPAC in 2021 at a $7.9 billion valuation. Today? Trading at ~$1.5 billion market cap, still unprofitable.
Why did they fail to disrupt? Because health insurance isn’t a technology problem. It’s a:
Capital intensity problem (you need billions in reserves)
Regulatory complexity problem (each state is different)
Provider relationship problem (you need networks)
Actuarial expertise problem (mispricing = bankruptcy)
Scale economics problem (fixed costs are enormous)
Could someone disrupt Medicaid MCOs? Only if they solved all five problems simultaneously. And then they’d just... become another Medicaid MCO.
Scenario 2: Government Single-Payer
The “Medicare for All” scenario. Government eliminates private MCOs and directly manages all healthcare.
Likelihood? Approximately zero, for reasons the Molina CEO explained perfectly:
“Neither side of the aisle wants to see more uninsured. Reduction in benefits, reduction in enrollment, reduction in payments to providers, or none of the above and I either have to, as a state, decrease my education budget or raise taxes. None of those solutions is politically tenable”.
Translation: The government needs MCOs to manage this complexity. Going back to fee-for-service would explode costs and create administrative nightmares.
It’s politically dead on arrival.
Scenario 3: Amazon/Big Tech
Amazon announced a big healthcare push with Haven in 2018 (partnership with Berkshire and JPMorgan). They shut it down in 2021.
Amazon bought One Medical in 2023 for $3.9 billion. One Medical operates 200+ clinics in 25 markets. Compare that to UnitedHealth’s Optum, which employed or contracted with 90,000+ physicians as of 2024.
Tech companies excel at zero-marginal-cost scalable software. Healthcare is high-marginal-cost human services. The skill sets don’t transfer.
Could Amazon become a Medicaid MCO? Technically, yes. Would they want to manage complex behavioral health cases for disabled beneficiaries in rural Mississippi? Absolutely not. The juice isn’t worth the squeeze.
The Transformation: From Competition to Coexistence
Here’s the resolution: this isn’t a competitive industry; it’s a regulated utility.
Think about your local electric company. You don’t have 10 electric companies competing for your business. You have one or two, heavily regulated, with guaranteed returns on capital deployed.
Medicaid MCOs are functionally the same:
Limited number of licensed operators (typically 2-5 per state)
Rates set by government to ensure “actuarial soundness”
Service requirements mandated by contract
Capital requirements mandated by regulation
Geographic monopolies (each county typically has 2-4 options)
The difference? Electric utilities get 10-12% regulated returns. MCOs get less official protection but similar economic outcomes because the barriers to entry are just as high.
Buffett loves regulated utilities for a simple reason: predictable returns, limited competition, essential service. Medicaid MCOs tick all three boxes without the explicit rate regulation.
Managed care organizations are not insurance companies. They’re healthcare infrastructure operators with government-guaranteed revenue, predictable unit economics, high barriers to entry, and oligopolistic market structure.
In Part 3, we’ll examine the technical aspects: How to value MCOs, what metrics matter, when to buy, and how to think about position sizing in government-dependent businesses. Subscribe to get the final installment.
3️⃣ Industry and Sector Technicals
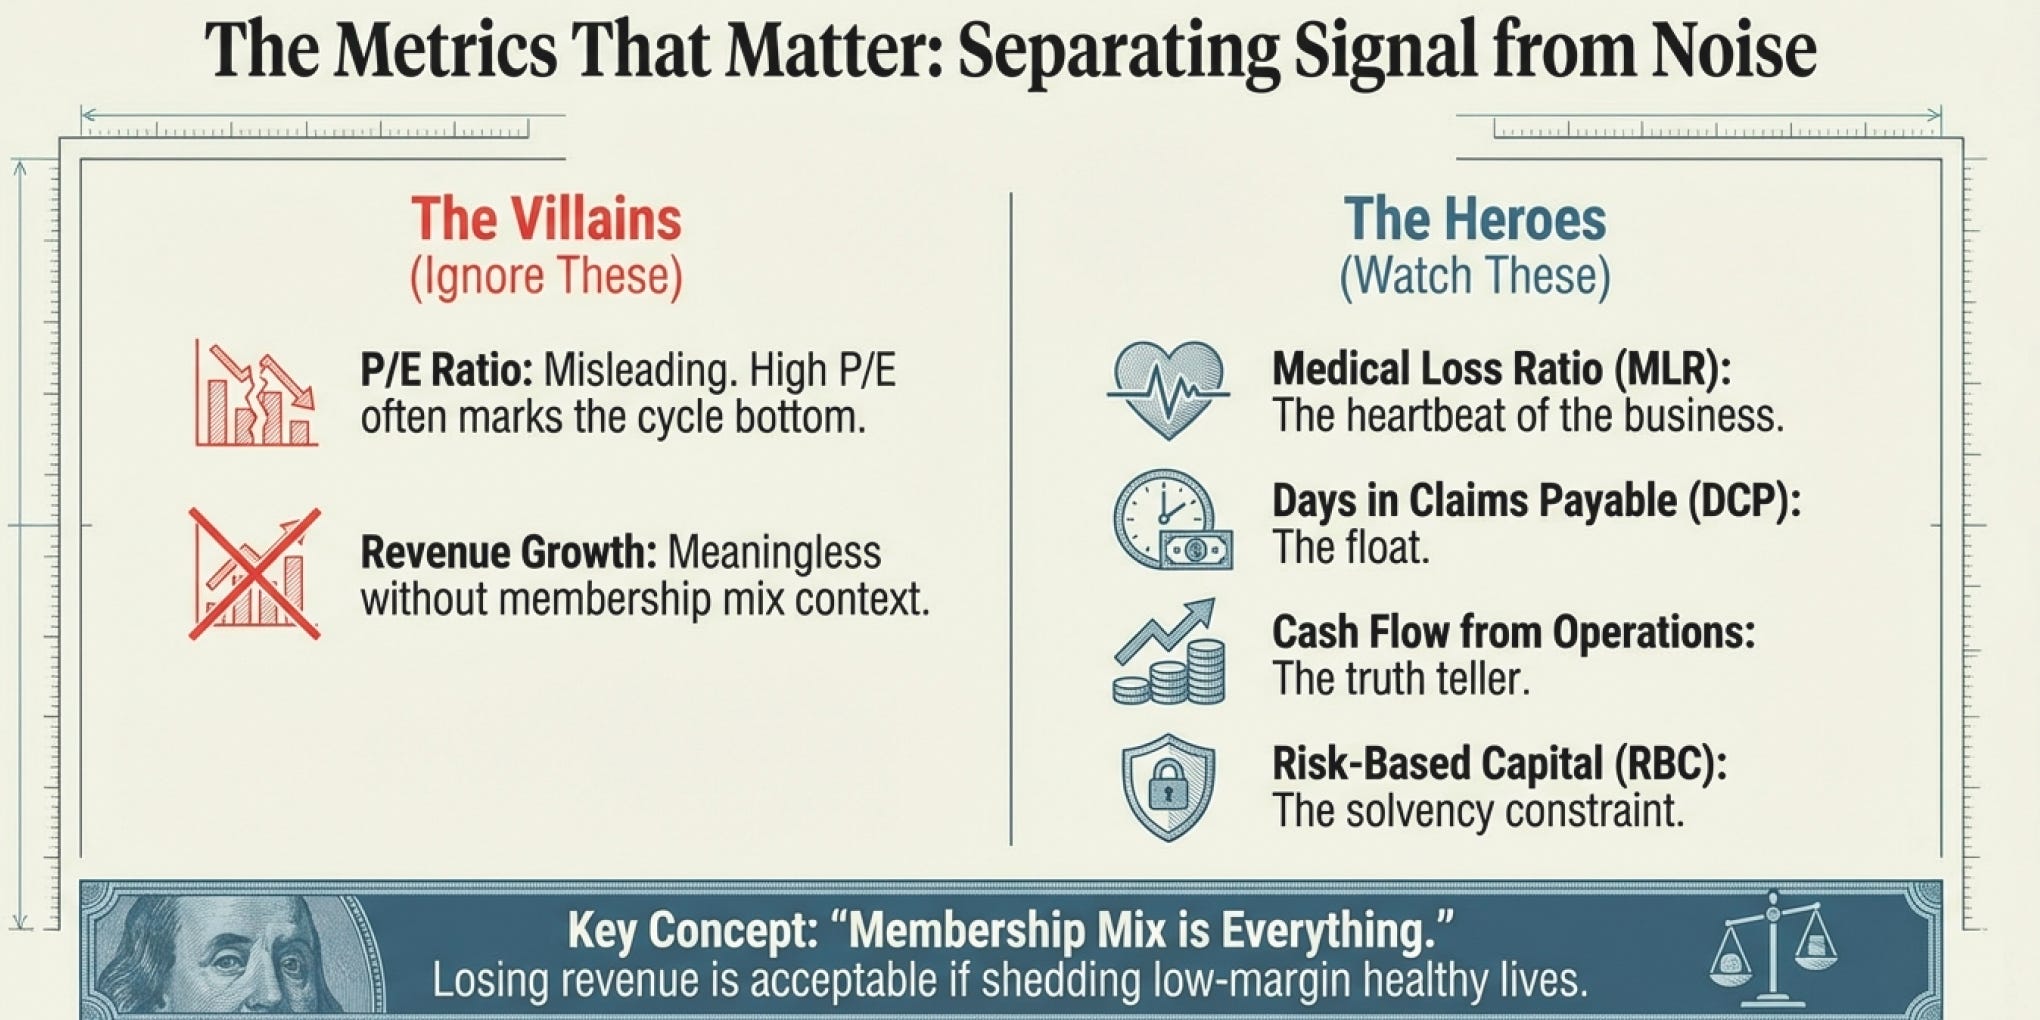
The Metrics That Matter (And The Ones That Don’t)
Let’s meet our cast of characters—the financial metrics that actually tell you something useful about MCOs:
The Heroes (Metrics You Should Care About):
Medical Loss Ratio (MLR) - The percentage of premium revenue spent on medical care
Administrative Expense Ratio - The percentage spent on overhead
Revenue Per Member Per Month (PMPM) - How much money comes in per member
Medical Cost PMPM - How much goes out per member
Membership Mix - What types of members (Medicaid, Medicare, Commercial)
Days in Claims Payable (DCP) - How much float you have
Risk-Based Capital (RBC) - Regulatory solvency margin
Cash Flow from Operations - The actual cash generated
The Villains (Metrics That Mislead You):
P/E Ratio - Earnings are too cyclical; this means nothing in isolation
Traditional EV/EBITDA - Doesn’t work for insurance-like businesses
Quarterly Earnings - Noisy and subject to reserve adjustments
Revenue Growth - Meaningless without understanding membership mix changes
Let me explain why using a thought experiment Feynman would appreciate:
Thought Experiment: The Ice Cream Shop
Imagine you own an ice cream shop. In summer, you sell 1,000 cones per month at $5 each = $5,000 revenue. Your ice cream costs $2 per cone = $2,000 cost. Profit = $3,000 (60% margin).
In winter, you sell only 200 cones = $1,000 revenue. Costs drop to $400. Profit = $600 (60% margin still).
Now imagine a naive investor looks at your shop in December and says, “This business only makes $600/month! It’s worth $7,200 per year (12 × $600). I’ll pay 10x earnings = $72,000.”
You, being clever, sell immediately. Because you know that summer is coming, and the business actually earns $3,000 × 6 months + $600 × 6 months = $21,600 annually. At 10x earnings, it’s worth $216,000.
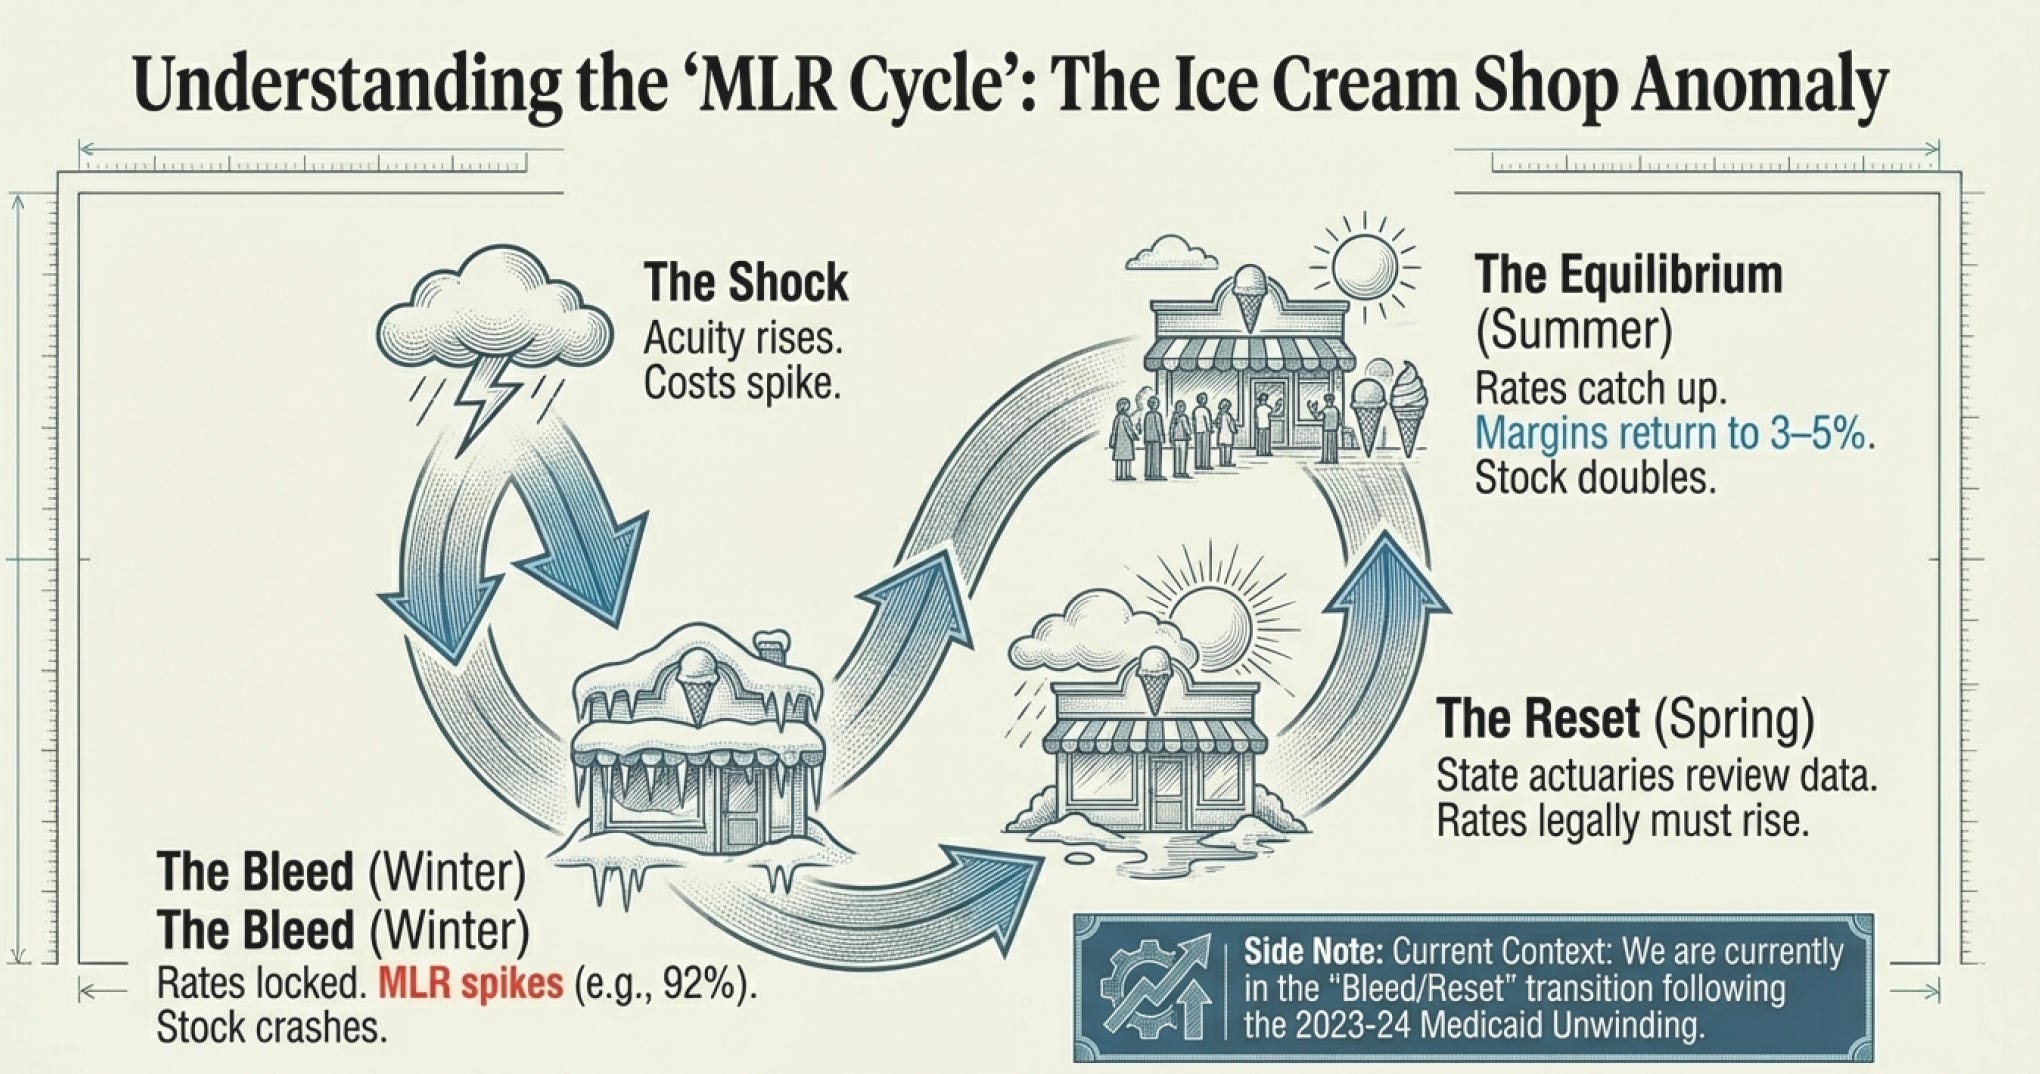
The naive investor looked at P/E ratio at the wrong point in the cycle.
This is exactly what’s happening with Centene right now.
The market is looking at depressed 2024-2025 earnings during a MLR spike (the “winter”) and valuing the company as if these margins are permanent. But experienced MCO investors know: margins are cyclical, and rate adjustments are coming (the “summer”).
The Central Conflict: Cycles vs. Structure
The fundamental challenge in valuing MCOs is distinguishing between:
Cyclical Problems (temporary margin compression that will reverse)
MLR spikes due to population mix changes
Lag between cost trends and rate adjustments
One-time expenses or reserve adjustments
Short-term regulatory changes
Structural Problems (permanent impairment of earning power)
Loss of major state contracts
Emergence of superior competitor
Fundamental shift in government policy (single-payer)
Inability to achieve required scale economics
Wall Street constantly confuses the two. The value investor’s job is to separate signal from noise.
Munger: “It’s not supposed to be easy. Anyone who finds it easy is stupid.”
Confrontation - Deconstructing the Financial Model
Understanding the MLR Cycle
Let me explain Medical Loss Ratio (MLR).
What is MLR?
MLR = Medical Costs ÷ Premium Revenue
If you collect $1,000 in premiums and spend $880 on medical care, your MLR is 88%.
Simple, right? Now here’s where it gets interesting.
The MLR Cycle: A Real Example
Let’s follow a fictional MCO called “StateHealth” through a complete cycle:
Year 1: Equilibrium
Premium revenue: $100 per member per month (PMPM)
Medical costs: $88 PMPM
MLR: 88%
Admin costs: $9 PMPM
Profit: $3 PMPM (3% margin)
Return on Equity: ~20% (because you only need ~15% of annual premiums in equity capital)
Everything is balanced. The actuaries priced it correctly. Everyone’s happy.
Year 2: The Shock (Population Mix Changes)
The state completes Medicaid redeterminations. Healthy members leave. Your remaining population is sicker.
Premium revenue: Still $100 PMPM (rates are locked for the year)
Medical costs: Jump to $92 PMPM (4% increase in acuity/utilization)
MLR: 92%
Admin costs: $9 PMPM (relatively fixed)
Profit: -$1 PMPM (you’re losing money!)
Return on Equity: -7%
Your stock price crashes 50% because investors extrapolate: “If margins are negative, the business is worth nothing!”
Year 3: The Adjustment (State Rate Reset)
The state completes a new actuarial study using Year 2 data. They increase rates to reflect the higher-acuity population.
Premium revenue: $108 PMPM (8% rate increase)
Medical costs: $95 PMPM (costs stabilize with new care management)
MLR: 88% (back to target)
Admin costs: $9 PMPM
Profit: $4 PMPM (3.7% margin)
Return on Equity: 25%+
Your stock price doubles as investors realize: “Oh, the cycle turned!”
Year 4: Equilibrium Returns
Everything normalized
You’re back to steady-state economics
But now you have fewer members with higher PMPM
Total profit dollars might be similar, but on a smaller membership base
This cycle plays out every 3-5 years in this industry. It’s as predictable as winter following autumn.
Buffett: “Be fearful when others are greedy, and greedy when others are fearful.”
The Second Principle: Membership Mix is Everything
Here’s something most investors miss: a Medicaid MCO is actually several different businesses combined.
Let me show you using real data from Centene’s business:
Centene’s Medicaid Membership (Simplified)
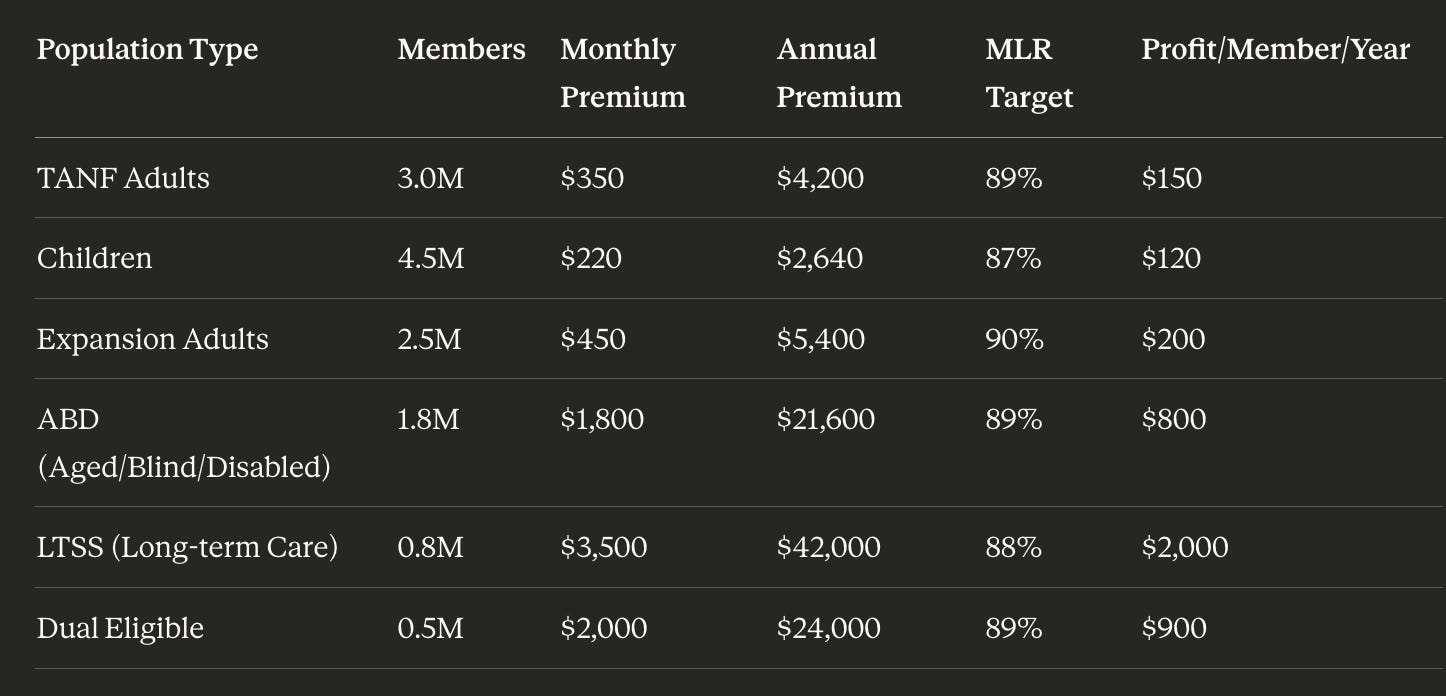
Total Blended: 13.1M members, ~$600 PMPM, 89% MLR
Now watch what happens when mix shifts:
Scenario A: Lose 2M Healthy Children
Revenue drops: 2M × $220 = -$440M monthly = -$5.3B annually
But profit only drops: 2M × $10/month = -$240M annually
MLR for remaining population increases (lost the lowest-MLR segment)
Scenario B: Gain 500K LTSS Members
Revenue increases: 500K × $3,500 = +$1.75B monthly = +$21B annually!
Profit increases: 500K × $167/month = +$1B annually
MLR for total population might appear worse (higher-cost population)
This is why naive investors get confused. They see:
Revenue up $16B (net)
MLR up from 88% to 89%
Conclusion: “Margins are compressing!”
Meanwhile, absolute profit dollars increased by $750M.
Buffett tells a story about buying See’s Candies: “We could raise prices 1 cent and people wouldn’t notice, but it would add millions to profits.” In MCOs, adding one high-acuity population segment can add hundreds of millions in profit—even though it looks like MLR is worsening.
The Lesson: Never look at MLR without understanding membership mix changes.
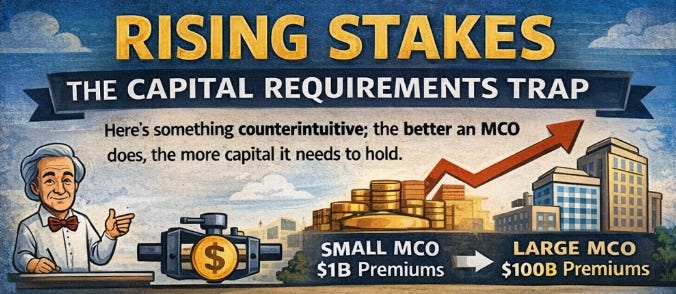
Rising Stakes: The Capital Requirements Trap
Here’s something counterintuitive: the better an MCO does, the more capital it needs to hold.
The Physics of Risk-Based Capital (RBC):
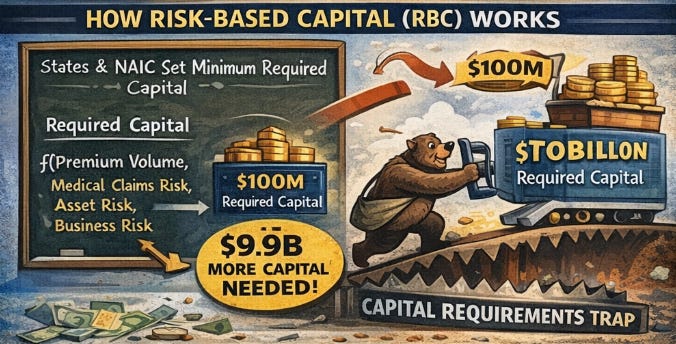
States and the NAIC require MCOs to maintain minimum capital ratios based on their risk exposure. The formula is complex, but simplified:
Required Capital = f(Premium Volume, Medical Claims Risk, Asset Risk, Business Risk)
As your business grows, your required capital grows proportionally.
Example:
Small MCO with $1B in annual premiums: Needs ~$100M in capital
Large MCO with $100B in annual premiums: Needs ~$10B in capital
So if you want to grow from $1B to $100B in scale, you need to find $9.9B in additional capital.
Where does that come from?
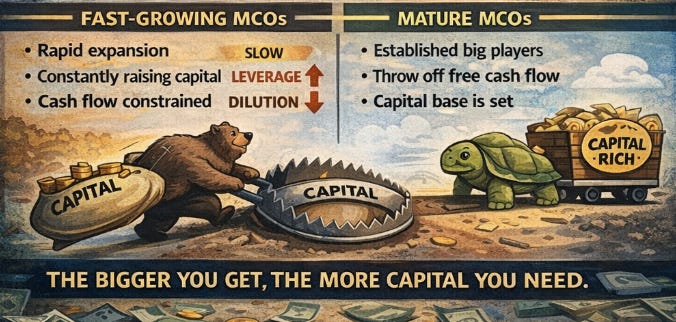
Retained earnings (slow)
Debt issuance (increases leverage)
Equity issuance (dilutes shareholders)
This creates a fascinating dynamic: fast-growing MCOs are capital-hungry, while mature MCOs are capital-rich.
It’s why UnitedHealth can throw off $20+ billion in free cash flow annually—they’ve reached scale, their capital base is established, and incremental growth doesn’t require proportional capital.
Meanwhile, a company trying to rapidly expand Medicaid presence would need to constantly raise capital.
How Entrenched the System Really Is
Hospitals, physician groups, device manufacturers, and pharmaceutical companies all operate inside payment architectures that reward throughput, coding intensity, and service expansion, regardless of whether those activities improve outcomes.
Elisabeth Rosenthal documents in An American Sickness how hospitals evolved from charitable institutions into revenue-maximizing enterprises once reimbursement became complex enough to obscure prices. Entire hospital departments now exist solely to optimize billing codes, negotiate reimbursement, and manage payer contracts—functions that would be unnecessary in a simpler system but are indispensable in the current one.
Marty Makary’s The Price We Pay provides repeated examples of how standard clinical pathways persist not because they are best, but because they are profitable.
Example 1: Unnecessary Procedures as Default Care
In many hospitals, patients with uncomplicated back pain are routed toward imaging and surgery despite evidence that conservative management often yields equal or better outcomes. Why?
Imaging feeds downstream referrals.
Surgery reimburses dramatically more than physical therapy.
Surgeons, hospitals, and device manufacturers all benefit, while the patient absorbs risk.
The system does not require malice—only alignment with existing incentives.
Example 2: Hospital-Acquired Harm as a Revenue Source
In Unaccountable, Makary highlights how complications—postoperative infections, medication errors, prolonged ICU stays—often generate additional billable services. The same hospital that caused the harm may be paid more to treat it.
This creates a perverse equilibrium:
Preventing harm reduces future revenue.
Treating harm is reimbursable and coded as complexity.
Transparency is resisted because it threatens high-margin service lines.

Example 3: Drug and Device Lock-In
Rosenthal describes how hospitals sign long-term contracts with device manufacturers and pharmaceutical suppliers. Once locked in, clinicians are subtly steered toward using those products—even when cheaper or safer alternatives exist—because switching disrupts supply agreements and rebate structures.
Clinical “preference” is often downstream of procurement economics
What makes these behaviors durable is not greed, but structural reinforcement.
Doctors are trained in environments where:
High utilization is normalized.
Defensive medicine is rewarded.
Time spent not intervening is rarely compensated.
Hospitals operate in environments where:
Fixed costs are enormous.
Margins depend on volume and coding intensity.
Transparency threatens negotiated price dispersion.
Managed care organizations sit on top of this system, attempting to modulate it—but rarely dismantle it—because they rely on the same provider networks and political goodwill to function.
The Uncomfortable Technical Truth
The American healthcare system is not optimized to save the most lives at the lowest cost. It is optimized to keep the system solvent under its own complexity.
That complexity is now self-reinforcing:
Financial incentives shape clinical norms.
Clinical norms justify payment structures.
Payment structures entrench infrastructure.
This is why incremental reform dominates and wholesale change stalls.
Managed care did not create these incentives—but it operates within them, constrained by the same forces that make the system so difficult to unwind.
That, ultimately, is the technical reality of the sector:
a system designed to function, not to heal—because functioning is what keeps it alive.
References
OECD, Health at a Glance 2025: United States — U.S. health spending ~17.2% of GDP and ~$14,885 per capita, compared to OECD averages. OECD
https://www.oecd.org/en/publications/health-at-a-glance-2025_15a55280-en/united-states_3517f35e-en.htmlOECD, Health at a Glance 2025: Prices in the health sector — healthcare prices in the U.S. among the highest in OECD. OECD
https://www.oecd.org/en/publications/health-at-a-glance-2025_8f9e3f98-en/full-report/prices-in-the-health-sector_962656ec.htmlCMS National Health Expenditure Data — total U.S. healthcare expenditures reached about $4.87 trillion in 2023. Health of Health Index -https://www.healthofhealth.org/
PubMed: Hospital administrative costs represent ~17–18.9% of total hospital expenses, a major inefficiency. PubMed
https://pubmed.ncbi.nlm.nih.gov/40406498/American Hospital Association (AHA) Costs of Caring 2024 — hospitals face rising administrative burdens due to insurer practices. American Hospital Association
https://www.aha.org/guidesreports/2025-04-28-2024-costs-caringAHA report on burdensome insurer policies — administrative costs now >40% of total hospital expenses. American Hospital Association
https://www.aha.org/guidesreports/2024-09-10-skyrocketing-hospital-administrative-costs-burdensome-commercial-insurer-policies-are-impactingPubMed review, Waste in the US Health Care System: Estimated Costs and Potential for Savings — total waste estimated across domains (care delivery, pricing, low‑value care, fraud, administrative complexity). PubMed
https://pubmed.ncbi.nlm.nih.gov/31589283/25% of U.S. healthcare spending is waste, summarizing JAMA review on U.S. health spending inefficiency categories. acdis.org
https://acdis.org/articles/news-25-us-healthcare-spending-wasted-jama-study-findsInstitute for Health Metrics and Evaluation (IHME) study on U.S. county health spending variation. Health Data
https://www.healthdata.org/news-events/newsroom/news-releases/new-analysis-shows-over-3000-different-health-systems-operatingKFF Medicaid Managed Care Tracker — data on state Medicaid managed care enrollment and plan prevalence.
(searchable under “Medicaid Managed Care Tracker” on kff.org)KFF A Look at Medicaid Enrollment and Finances of the Five Largest Medicaid Managed Care Plans — overview of major players in Medicaid MCO market.
(searchable under kff.org/medicaid)AHA Skyrocketing Hospital Administrative Costs report highlights insurer administrative burden. American Hospital Association
https://www.aha.org/guidesreports/2024-09-10-skyrocketing-hospital-administrative-costs-burdensome-commercial-insurer-policies-are-impactingHealth expenditure by financing scheme, OECD Health at a Glance 2025 — financing breakdown of health spending, including public vs private. OECD
https://www.oecd.org/en/publications/2025/11/health-at-a-glance-2025_a894f72e/full-report/health-expenditure-by-financing-scheme_074bead0.htmlArmstrong, David, An American Sickness: How Healthcare Became Big Business and How You Can Take It Back (2017).
(book — Amazon/Wikipedia search)Makary, Marty, Unaccountable: What Hospitals Won’t Tell You and How Transparency Can Revolutionize Health Care (2012).
https://en.wikipedia.org/wiki/Marty_MakaryMakary, Marty, The Price We Pay: What Broke American Health Care — And How to Fix It (2019).
https://slmms.org/wp-content/uploads/2019/12/SLMM_December_2019.pdfKumar, Sanjaya, Fatal Care: Survive in the U.S. Health System (2008).
https://en.wikipedia.org/wiki/Fatal_CareWikipedia, Healthcare Reforms Proposed During the Obama Administration.
https://en.wikipedia.org/wiki/Healthcare_reforms_proposed_during_the_Obama_administrationCommonwealth Fund, U.S. Health Care in a Global Perspective 2022 — international comparison of outcomes and spending.
https://www.commonwealthfund.org/publications/issue-briefs/2023/jan/us-health-care-global-perspective-2022Institute for Health Metrics and Evaluation, 2025 release on county health spending patterns. Health Data
https://www.healthdata.org/news-events/newsroom/news-releases/new-analysis-shows-over-3000-different-health-systems-operatingUnitedHealth Group, Advancing Value-Based Care in the U.S. Health Care System (2025 Executive Summary) — OECD & CMS spending context. UnitedHealth Group
https://www.unitedhealthgroup.com/content/dam/UHG/PDF/2025/2025-10-value-based-care-exec-sum.pdfHealth of Health Index — CMS NHE historical tables showing spending trends across payers including Medicaid & Medicare. Health of Health Index https://www.healthofhealth.org/
American Hospital Association 2024 Costs of Caring administrative expense analysis. American Hospital Association
https://www.aha.org/guidesreports/2025-04-28-2024-costs-caringHealth expenditure on prevention and primary healthcare (OECD Health at a Glance 2025). OECD
https://www.oecd.org/en/publications/2025/11/health-at-a-glance-2025_a894f72e/full-report/health-expenditure-on-prevention-and-primary-healthcare_e65bf24a.htmlAdditional KFF data on MLR trends in Medicaid managed care plans.
(searchable under “KFF Medicaid managed care MLR trends”)