
Moats and Competitive Edge
USPs (Unique Selling Propositions) are associated to what munger and buffet deemed as “moat” to the company. These Moat/s tend to either be
1. Efficiency based (which is cost based) e.g. Walmart
2. Differentiated based (which allow for a higher premium typically due to branding) e.g. LVMH
The Core To All Moats
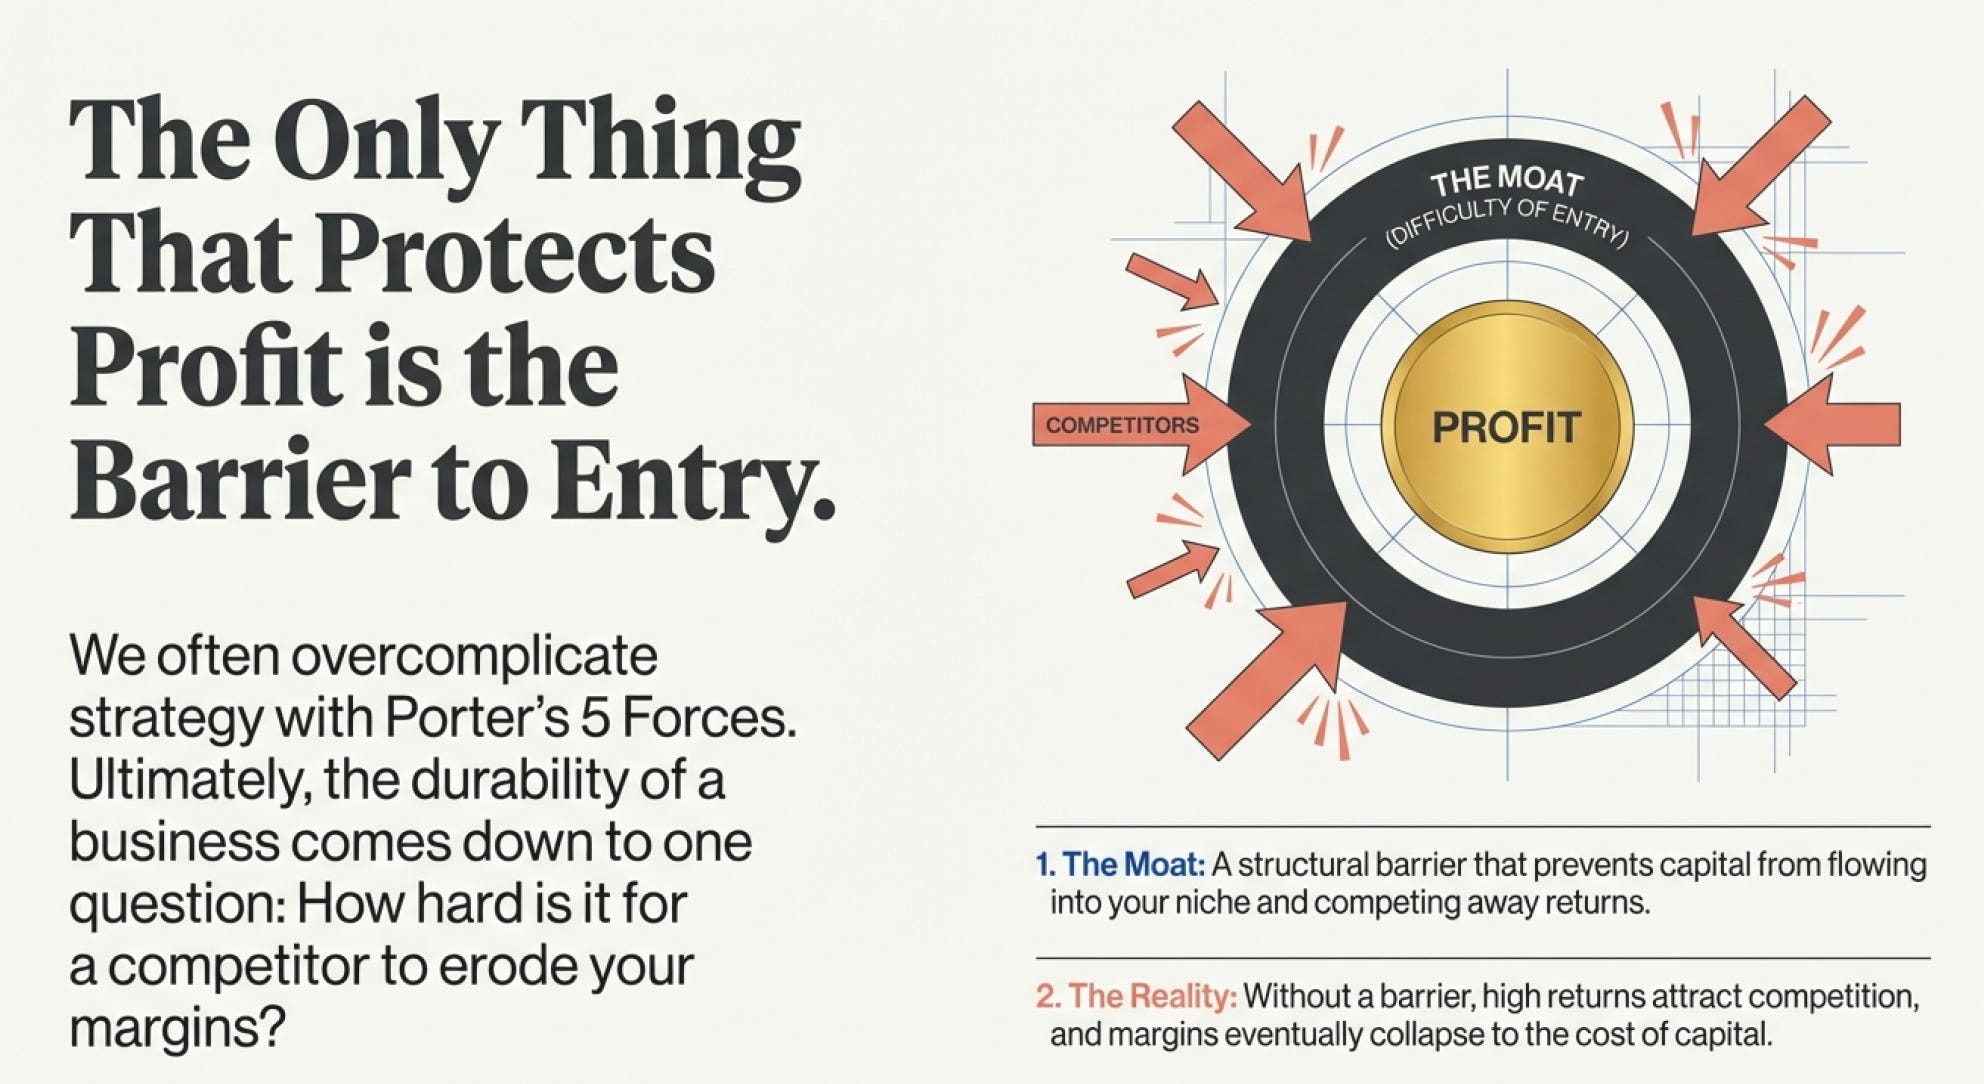
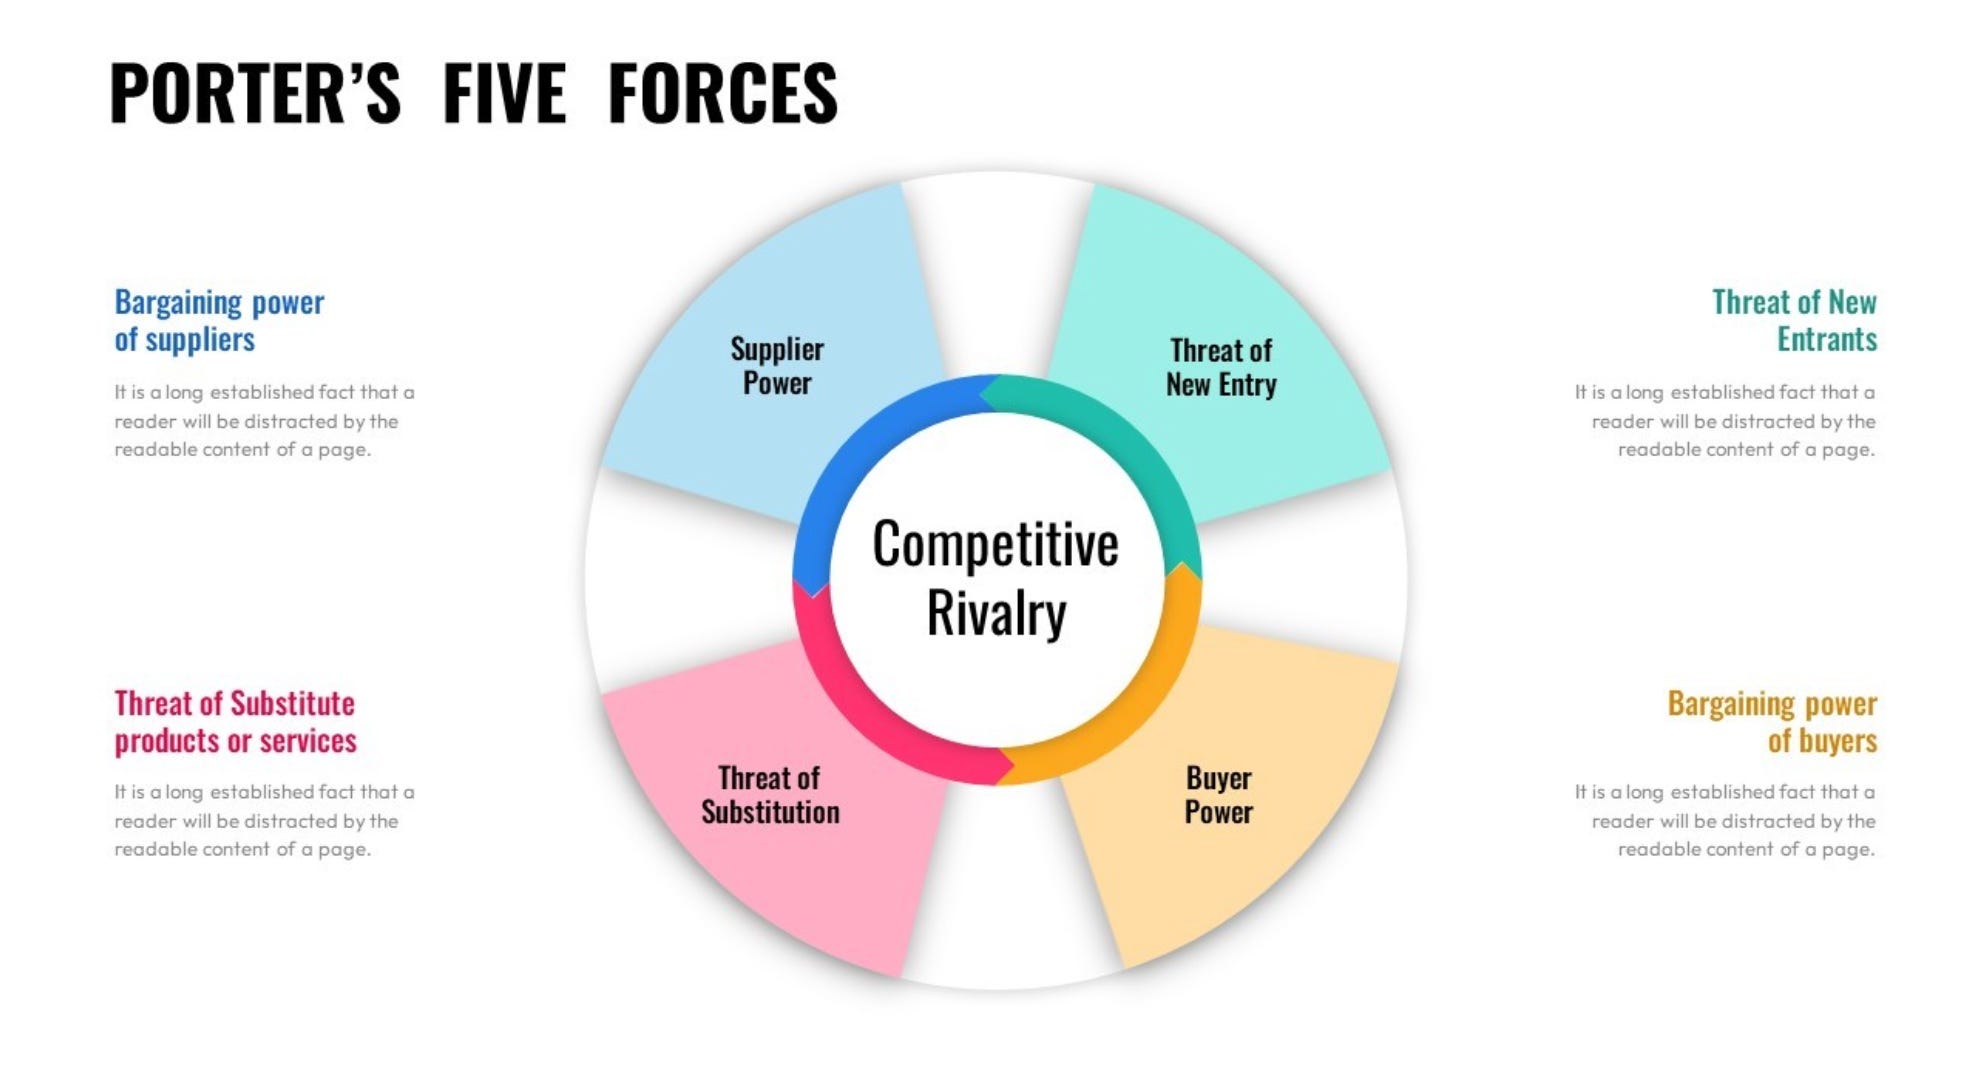
Let’s be honest, all of us have heard about the Porter 5 forces but not everyone knows how to utilize it properly. At the end of the day, the only thing that truly protects profits is how hard it is for competitors to enter your market and erode your margins - therefore, all Moats tend to be associated to being barriers of entry. And most of the time, the barriers are further associated to having the lowest cost (relative to their market) in 3 forms 👇
From the demand side (low cost to acquire demand) e.g. due to customer habits they come back repeatedly hence general stores with 2% profit margins can be great businesses because despite their 2% margins their CLV is huge and they do not bare customer acquisition cost
From the supply side (low cost to acquire raw materials) e.g. Privileged access to crucial inputs/ raw materials or government offers
From both the demand + supply side resulting in what people deemed as “Economies of scale” (significant marginal cost reduction due to volume). And note: volume specific to a local market)

By “local” market, we are referring to specific “niche” markets.e.g. Females 60-70 years of age who have trouble hearing and living in Texas. Usually achieved through combination of demand captivity AND supply to a “local” aspect. - NOT volume or just purely by being “big” e.g. Walmart dominated in south central US before expansion, southwest airlines dominated in Texas and surrounding before expansion.
The Real “Economies of Scale”
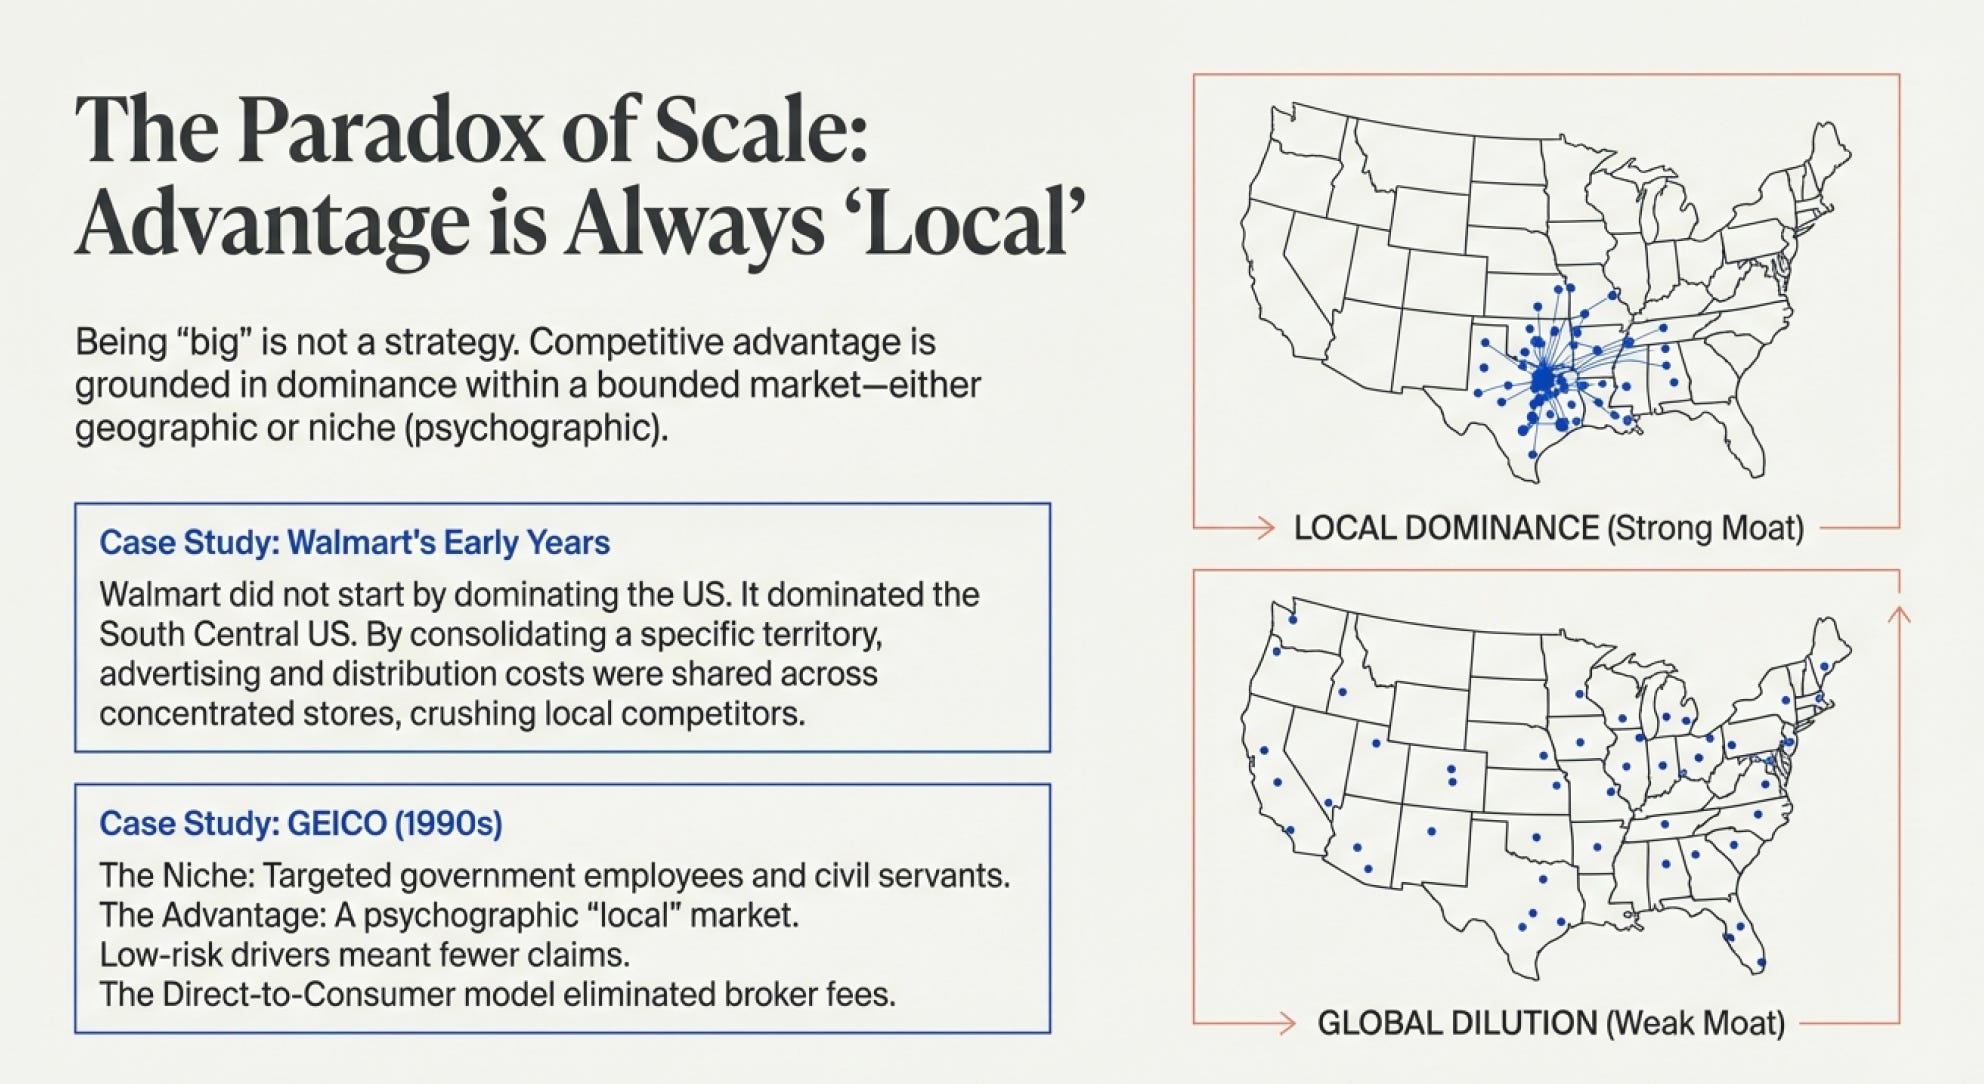
A1990s GEICO example......
From the demand side: GEICO operated as a D2C structure, enabling them to serve customers directly without middleman/ brokers. The utilisation of website SEO helped them reduce CAC (customer acquisition cost) significantly (refer to our previous section of LTGP:CAC).

This significantly changed the playing field as other insurance companies were still unable to detach from “sticky” brokers that were helping them to acquire customers.
My guess for this is that they need highly personalized advice from brokers to be able to covert a customer due to the huge diversity of insurance policies they are selling.
On the other hand, GEICO focuses on specific auto insurance policies to government employees, working professionals, and civil servants. This allowed their policies to resonate and address customer’s pain points much more. As a result, no personalization through agents were required to convert clients.
This allowed GEICO to utilize a D2C model through web sales and significantly cut their CAC relative to “competitors” (other auto insurance providers).
Lastly, these customer segments tend to have greater brand loyalty and lower churn rates (increasing LTGP) - GEICO could thus acquire a customer once, and profit off them for a long time.
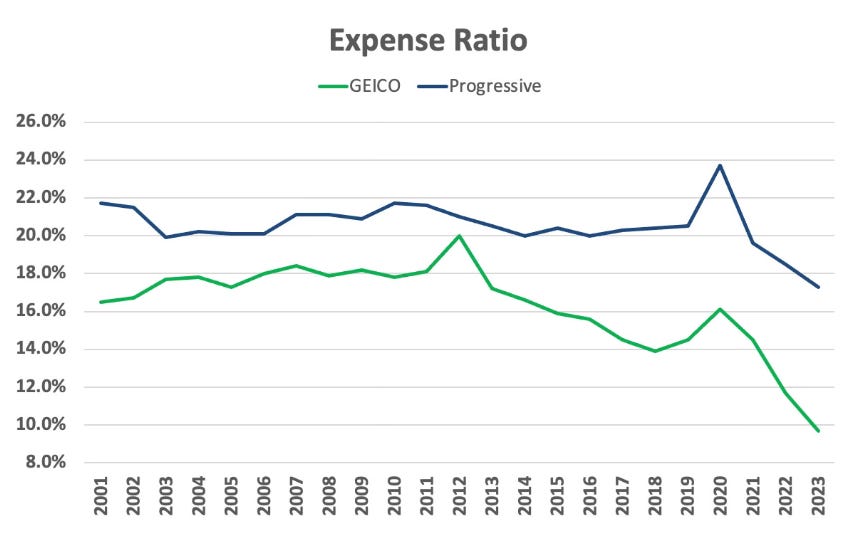
From the supply side: Insurance policies are heavily regulated by the government. Very little companies can offer the policies. Secondly, GEICO distinguished itself through a direct-to-consumer model that attracted lower-risk drivers, such as government employees, working professionals, and civil servants. This strategic focus resulted in fewer claims per policy and lower expense ratios, hence significantly lower “supply” costs compared to competitors.
Why Internet Companies Are Horrible
Internet companies usually do not provide any economies of scale as there is low barrier of entry due to low fixed cost/ minimal required investment. Simultaneously, information and data is widely accessible to almost anyone, bringing down the barrier of entry. Due to these 2 elements, it is very easy for someone to start a tech company today. And with such a huge wave of competition, it is a wonder why many are struggling (of-course this is subjective and can be reversed with some business model engineering).
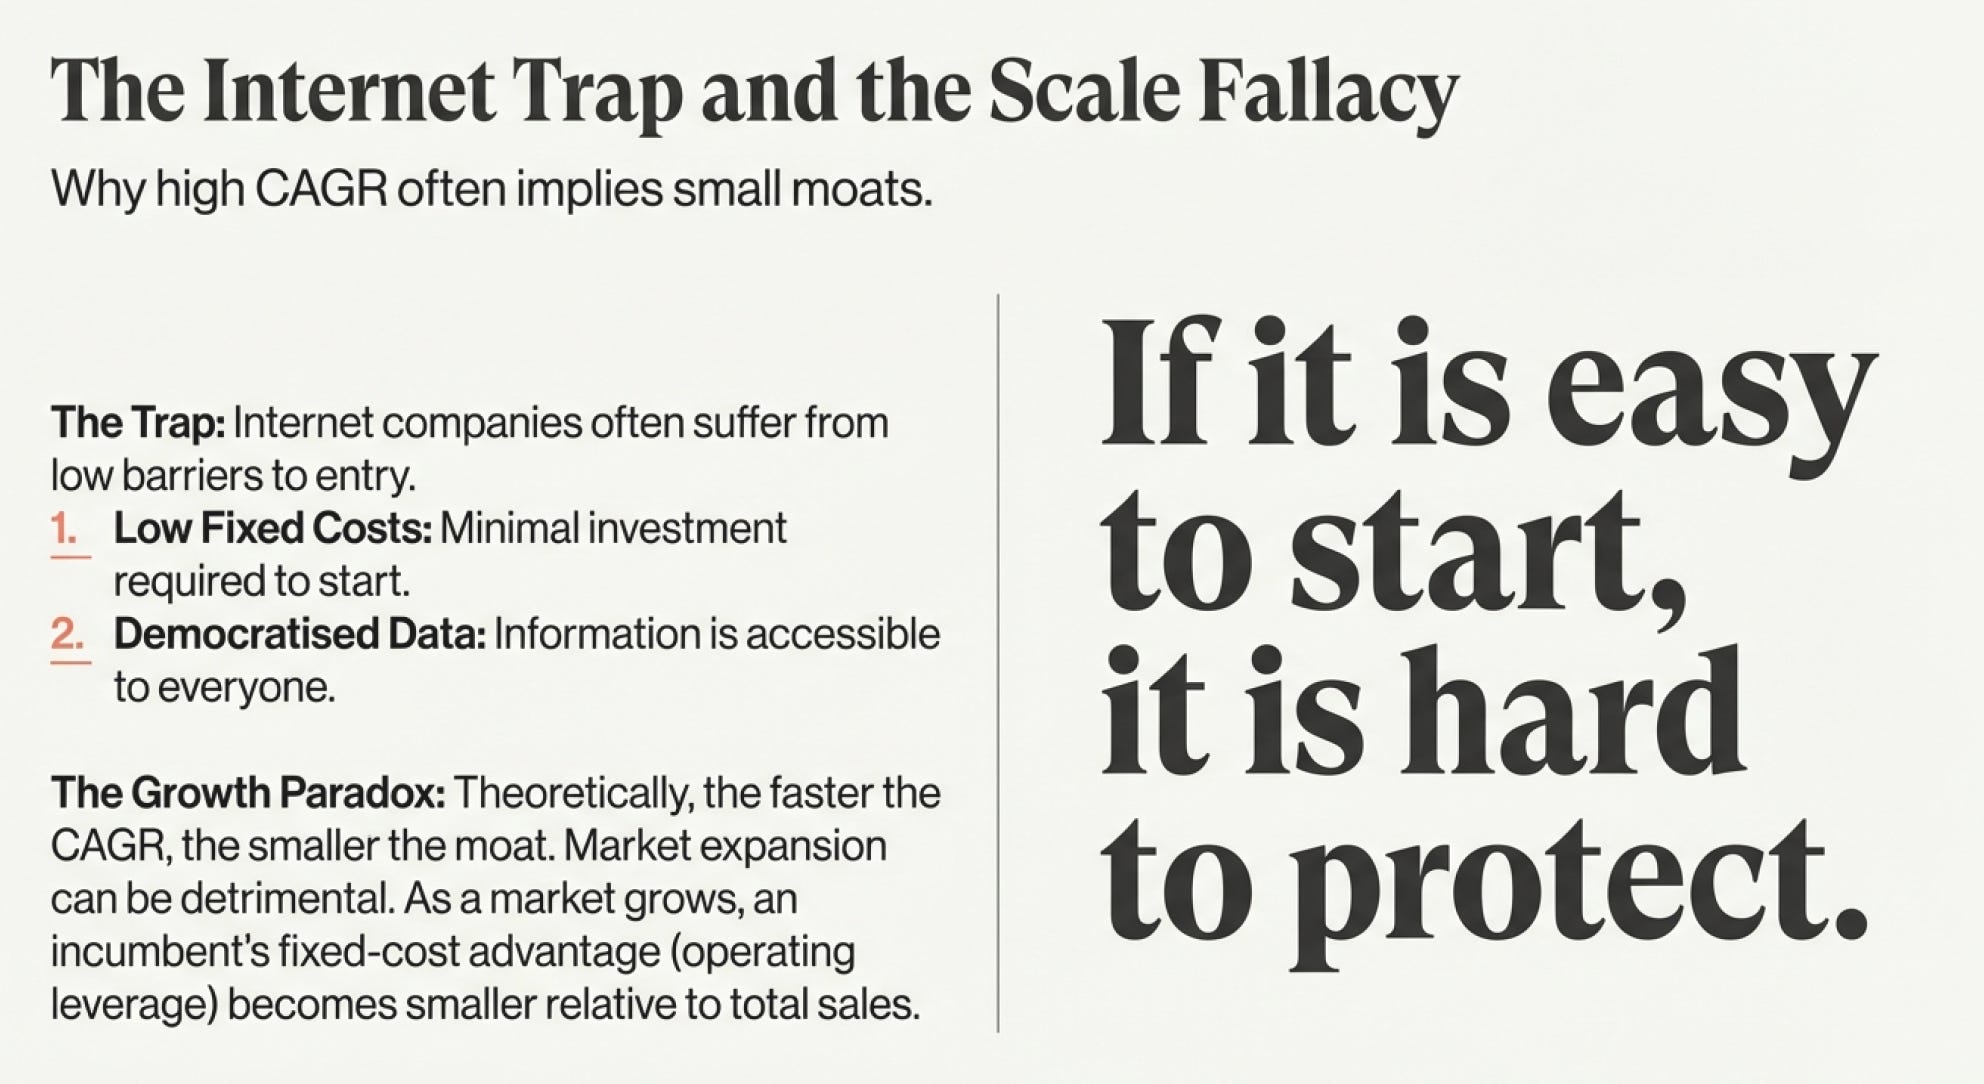
Theoretically speaking, the faster the CAGR of a company, the smaller the moat. Market expansion is DETRIMENTAL to competitive advantages - because at times, it is at the cost of losing a competitive edge. As mentioned above, when there is a low barrier, it is easy for there to be competition. e.g. IBM giving away business to Microsoft and Intel by opening up a market using Microsoft & Intel’s proprietary software/ device.

An incumbent firm with a competitive advantage in fixed cost due to economies of scale is seen to lost its fixed cost advantage as the market grows
e.g. In the original market, the incumbent (you) have 16% lower fixed cost than competitors. But in a larger market where fixed cost is smaller relative to sales, the “High operating leverage” advantage is removed
Competitive Advantage Are Always Grounded in “LOCAL” Circumstances - Bounded Either Demographic or Psychographic
This is because more value is realised by being able to address/ cater more to the customer’s pain points through a “LOCAL” approach.
e.g. Wal-Mart began as a small and regionally focused discounter in a part of the country where it had little competition. It expanded incrementally outward from this geographic base, adding new stores and distribution centers at the periphery of its existing territory. The market that it dominated in was not discount retailing in the United States, but discount retailing within a clearly circumscribed region. As it pushed the boundaries of this region outward, it consolidated its position in the newly entered territory before continuing its expansion. As we observe, when it moved too far beyond its base, its results started deteriorating.
🛡️ Types of Competitive Advantage
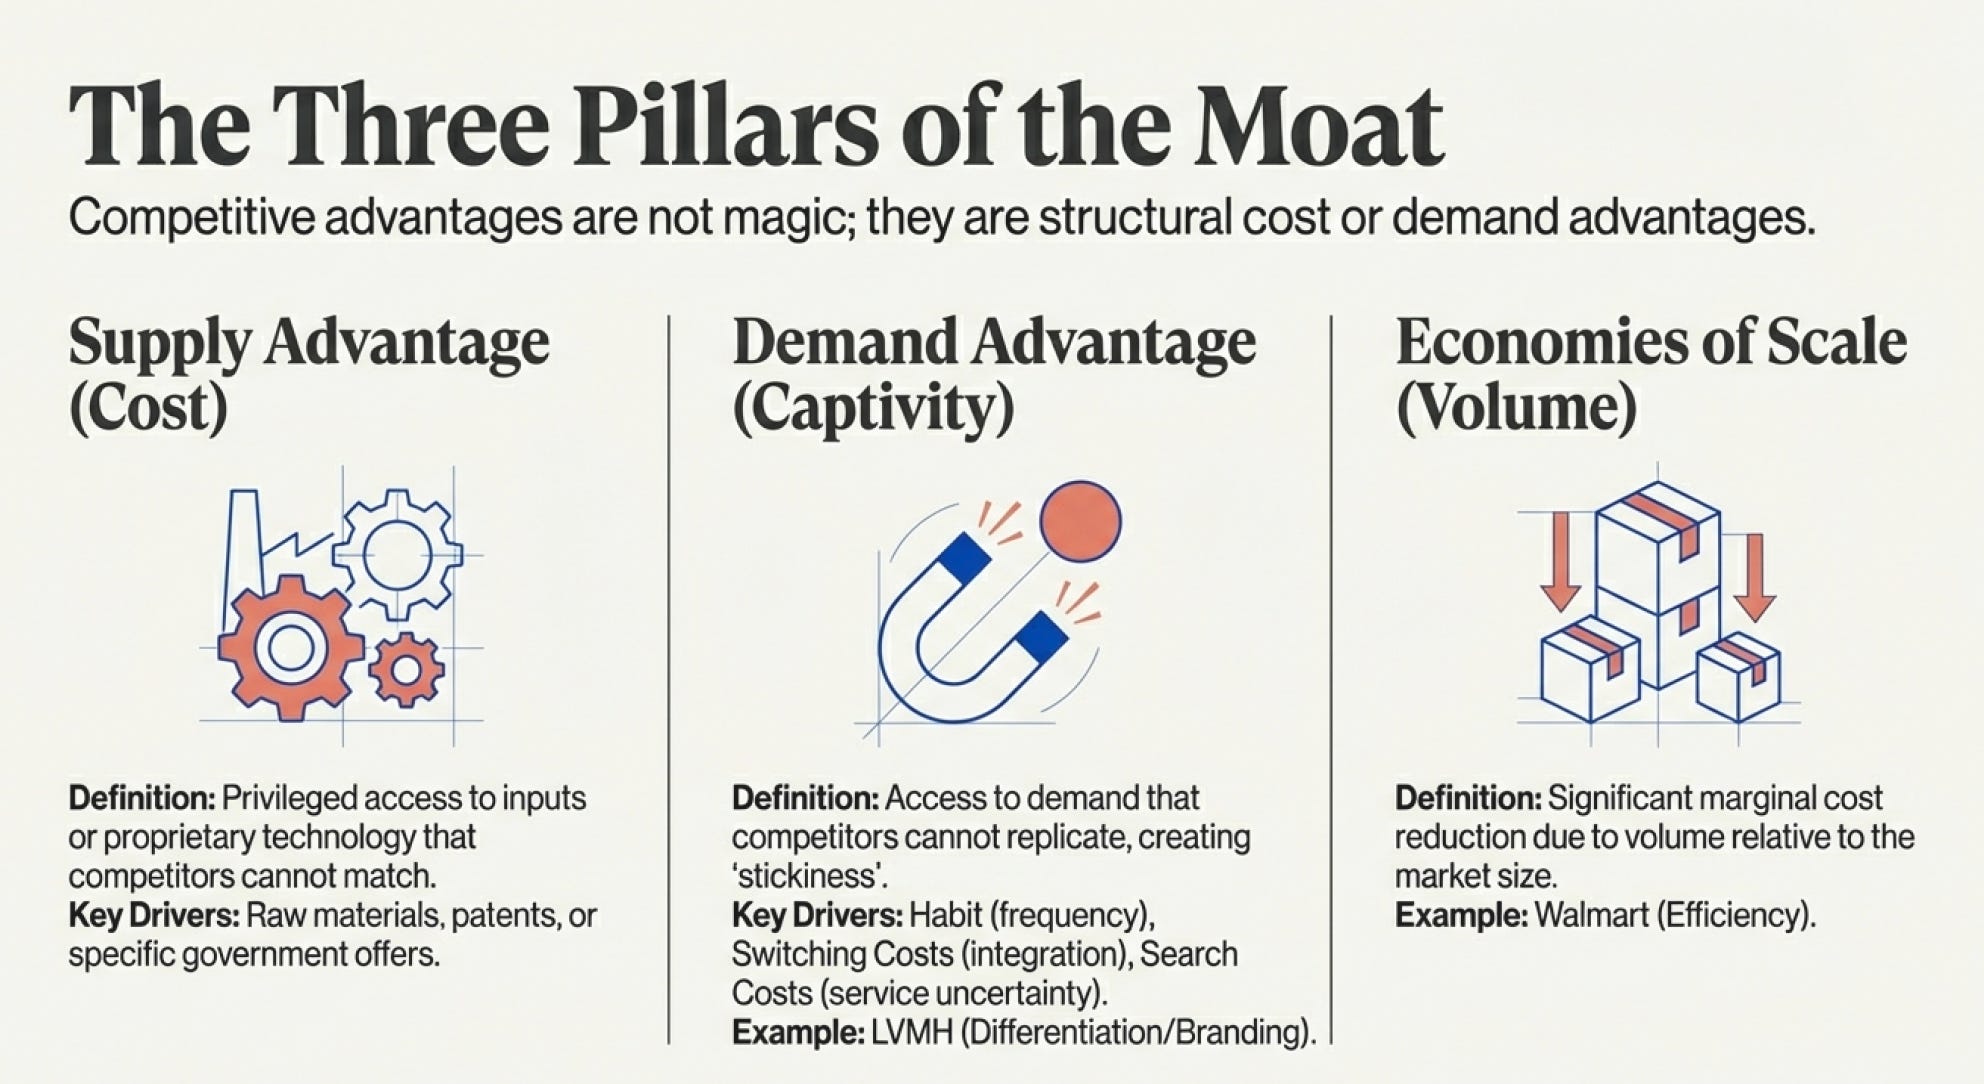
We have roughly summarised this in the section above. However, i wanted to give an even more in-depth explanation of this as it is a key foundation. When looking at a competitive edge, you need to ask yourself “Is this barrier only exclusive to the company and not available to existing competitors/ new entrants” - even if they try to emulate practices or spend huge amount of capital to acquire this advantage?
Supply advantage
Supply advantage is defined as cost advantage that allows a company to produce and deliver its products/ services more cheaply than its competitors. Some examples include
Privileged access to crucial inputs/ raw materials e.g. aluminium ore, information, specialised data
Proprietary technology protected by patents or experience & know-how’s (not preferred unless of an element that prevent others from possessing the same)
Government intervention/ offers
Demand advantage
Demand advantage related to any access to demand that competitors cannot match. Usually by extending or deepening the services offered. They often capture customers not just through product differentiation and branding, but by;
Customer’s habits (advantages from brands stem from habits)
Cost of switching (usually due to customisation/ personalisation from information of the incumbent) e.g. difficulties/ expenses in switching to substitute products - seen especially in software that are built-to use for enterprises, loyalty programs, subscription & non reflective purchases
Search costs; especially for services (in the service line it is hard for someone to find a similar service quality without putting in the effort to experience it)
Economies of scale
As volume increases, cost per unit decreases. And because fixed costs makes up a majority of the total cost, the firm operating at a larger scale will acquire a cost advantage. This advantage tend to last longer than demand & supply advantage
Usually achieved through combination of demand captivity and supply in a “local” aspect (demographic/ psychographic) - NOT volume or just purely by being “big” e.g. Walmart dominated in south central US before expansion, southwest airlines dominated in Texas and surrounding before expansion.
Internet companies usually do not provide any economies of scale as there is low barrier to entry due to low fixed cost/ minimal required investment. Information and data is widely accessible to almost anyone, bringing down the barrier of entry
🤔 Assessing Competitive Advantage
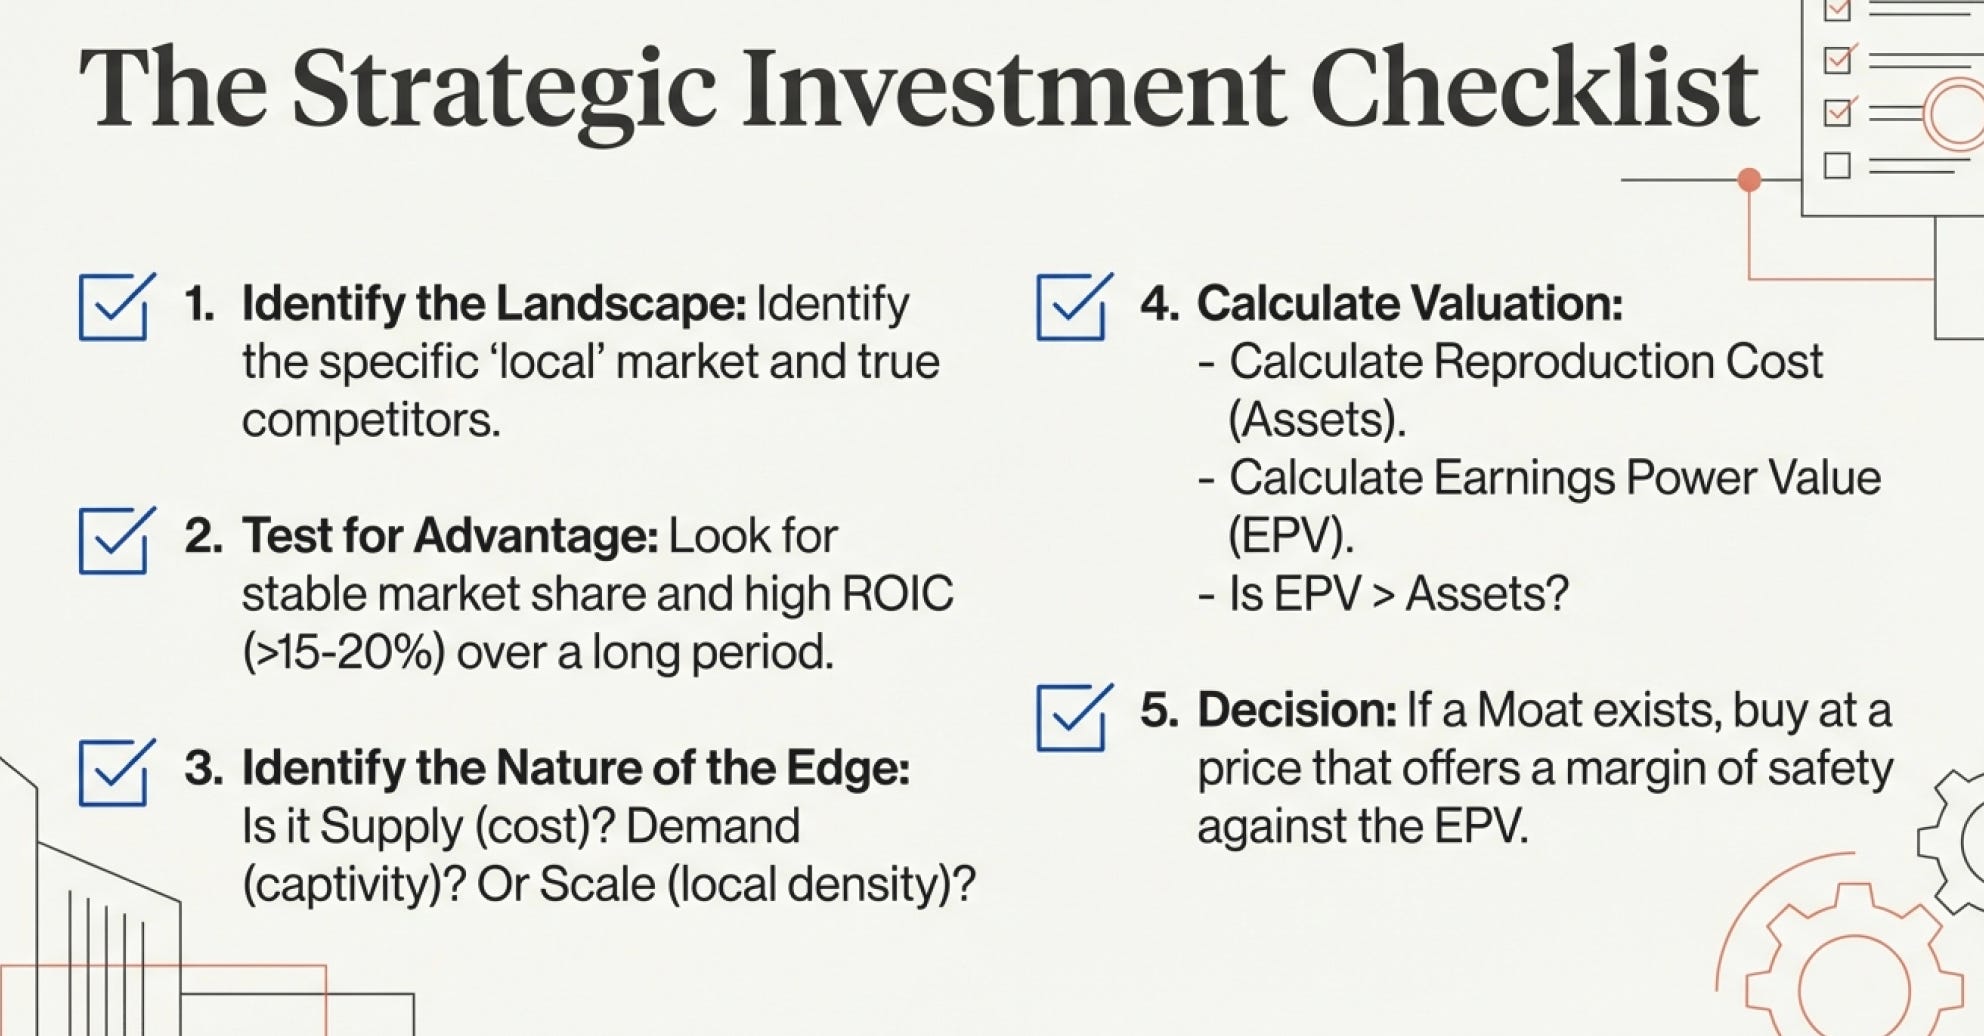
Step 1: Identify the landscape in which the firm operates
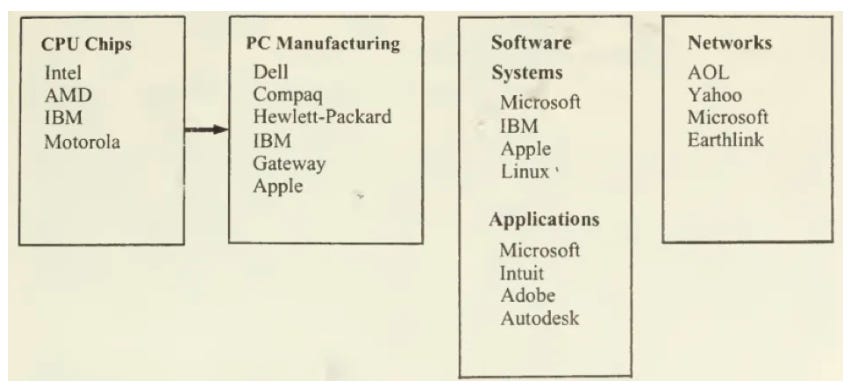
Which market is it really in? Who are its competitors in each one? e.g. Map of the personal computer industry 👇

Step 2: Test for the existence of competitive advantages in each market:
Do incumbent firms maintain stable market shares over long periods? Are they exceptionally profitable over a substantial period (e.g. >15-28% ROIC)?
Step 3: Identify the likely nature of any competitive advantage that exists:
Do the incumbents have proprietary technologies or captive customers? Are there economies of scale or regulatory hurdles which they can benefit from? What is their EXACT competitive edge based on
Supply advantage
Demand advantage
Economies of scale
e.g. Microsoft’s dominance of the software segment is even more pro-nounced than Intel’s position in microprocessors. IBM’s open architecture for the PC allowed many other companies to become manufacturers, but the operating system was standardized on Microsoft’s MS-DOS.
e.g. Walmart’s competitive advantage lies in 3 aspects due to its “locality” and concentration
Supply advantage: Because warehouses are located within 300miles radius of supply stores + they have their own fleets, supply and transportation costs from suppliers are reduced.
Economies of scale: For retailers, advertising is usually local. However, because Walmart has more concentrated stores within the location, acquisition costs per customers is reduce significantly compared to competitors e.g. an ad on a television station in that area cost the same weather there is 1 or 3 Walmart stores there
Demand advantage: Because of the Economies of scale, Walmart is able to get exposure to more audience in the local area, also resulting in high advocacy (and lower customer acquisition costs) after a threshold brand resonance level
Mergers and Acquisition Synergists
The only benefit that comes out of Mergers and acquisitions is theoretically cost savings
Customer captivity (in demand advantage) is not possible to be transferred or overlapped with another company. Demand captivity advantages are idiosyncratic and they don’t overlap because the mechanisms that create them — trust, habit, integration, personal investment — are unique to the relationship between that customer and that company.
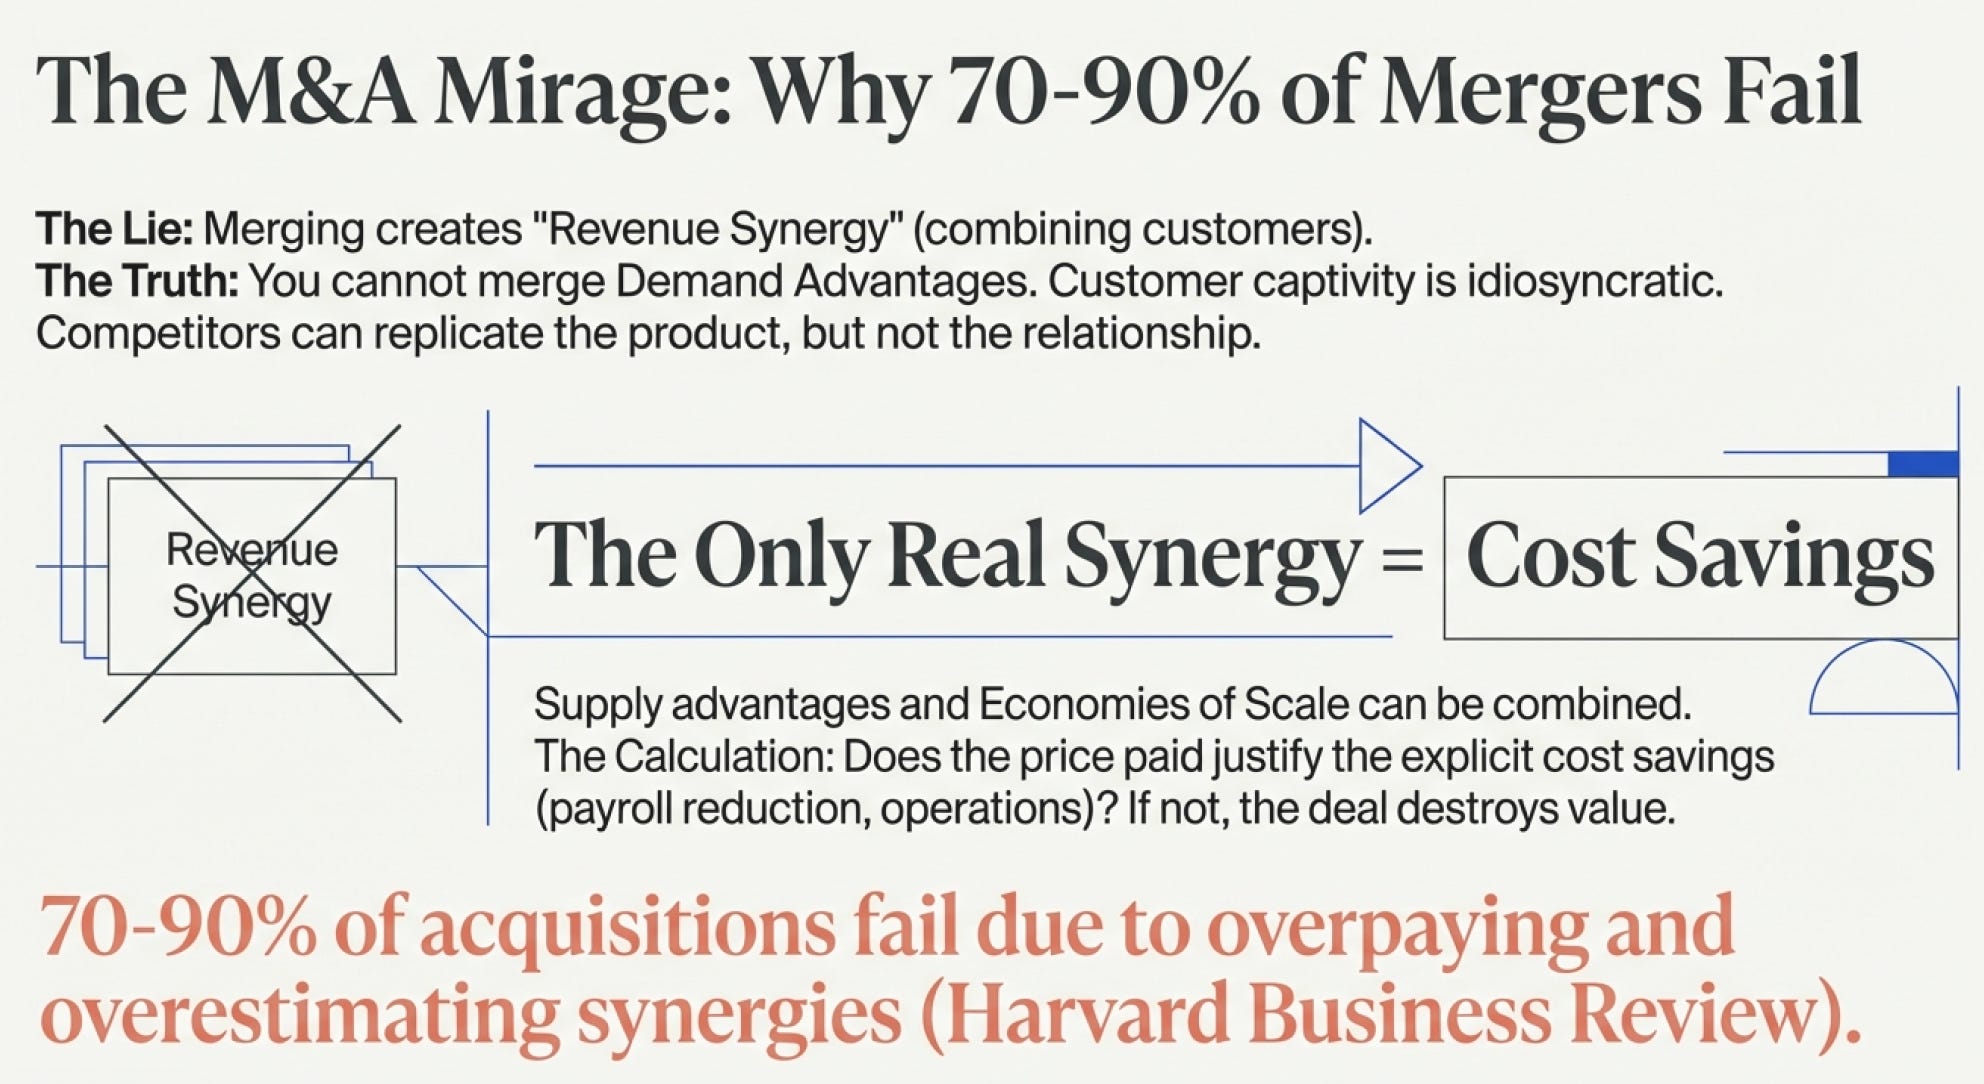
Competitors can try to replicate the offering, but they can’t replicate the relationship.. Hence, that leaves the only type of advantage from “supply advantage” and “economies of scale” (both resulting in a cost advantage).
The appropriate measure of the benefits of an acquisition is thus the size of the anticipated cost savings - will they be large enough to offset the premium paid for the transaction
The justification of ANY transaction is therefore; does the price paid justify the cost savings received from the company at the end of the day
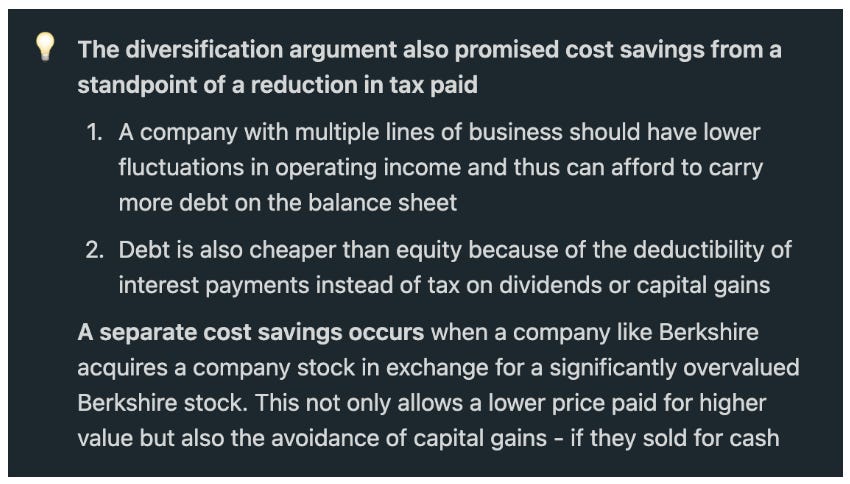
Many mergers & acquisitions are also justified by the claims of superior management that reduces costs
Payroll costs will be lowered: inferior management of the target company will be gotten rid of and managers from the acquiring company will take up these jobs without an increase in pay - resulting in more task handled at lower cost of employment e.g. refer to the book outsiders
Improved operations in the target firm will reduce cost: however, benefits from better management will largely be confined to making the operations better and does not apply to marketing costs. This is because marketing expertise tends to be industry and sector specific (unless you re-engineer and operate in a slightly different segment of the industry)
These all looks good until we start studying the M&A industry. According to Harvard Business Reviews, between 70% - 90% of acquisitions fail. That is HUGE! Quoting some common reasons of failure are; overpaying, overestimating synergies, integration issues, and poor communication. Other than the price paid, we can see here that the main problem always results for the issue to integrate culture
In the book “The Outsiders: Eight Unconventional CEOs and Their Radically Rational Blueprint for Success - by William N. Thorndike”, 7 out of 8 of the CEOs profiled (that outperformed the S&P 500 by over 20x on average during their tenures) grew shareholder value primarily through highly disciplined capital allocation — and in many cases, this was driven by acquisitions.
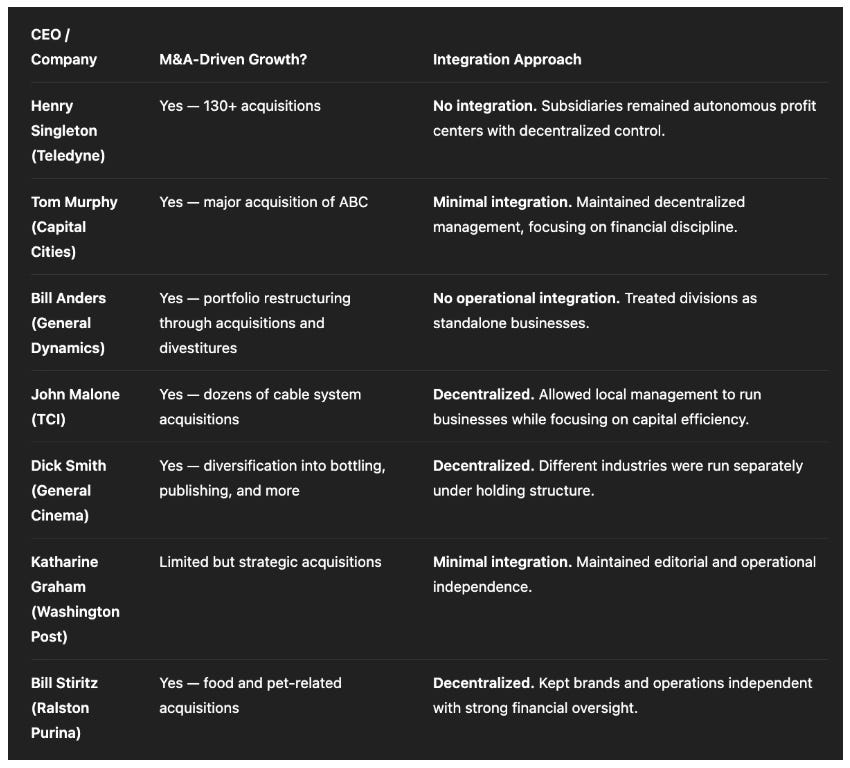
But what’s striking is that:
The vast majority of these CEOs deliberately avoided integrating the companies they acquired.
Instead, they left them decentralized, independent, and operationally autonomous.
Now that we have understood, what creates a competitive edge, how to navigate competition, and how amazing companies operate, it is time to take a look at how to really value a company. Not through unreliable means like the financial industry does, but like real businesses...
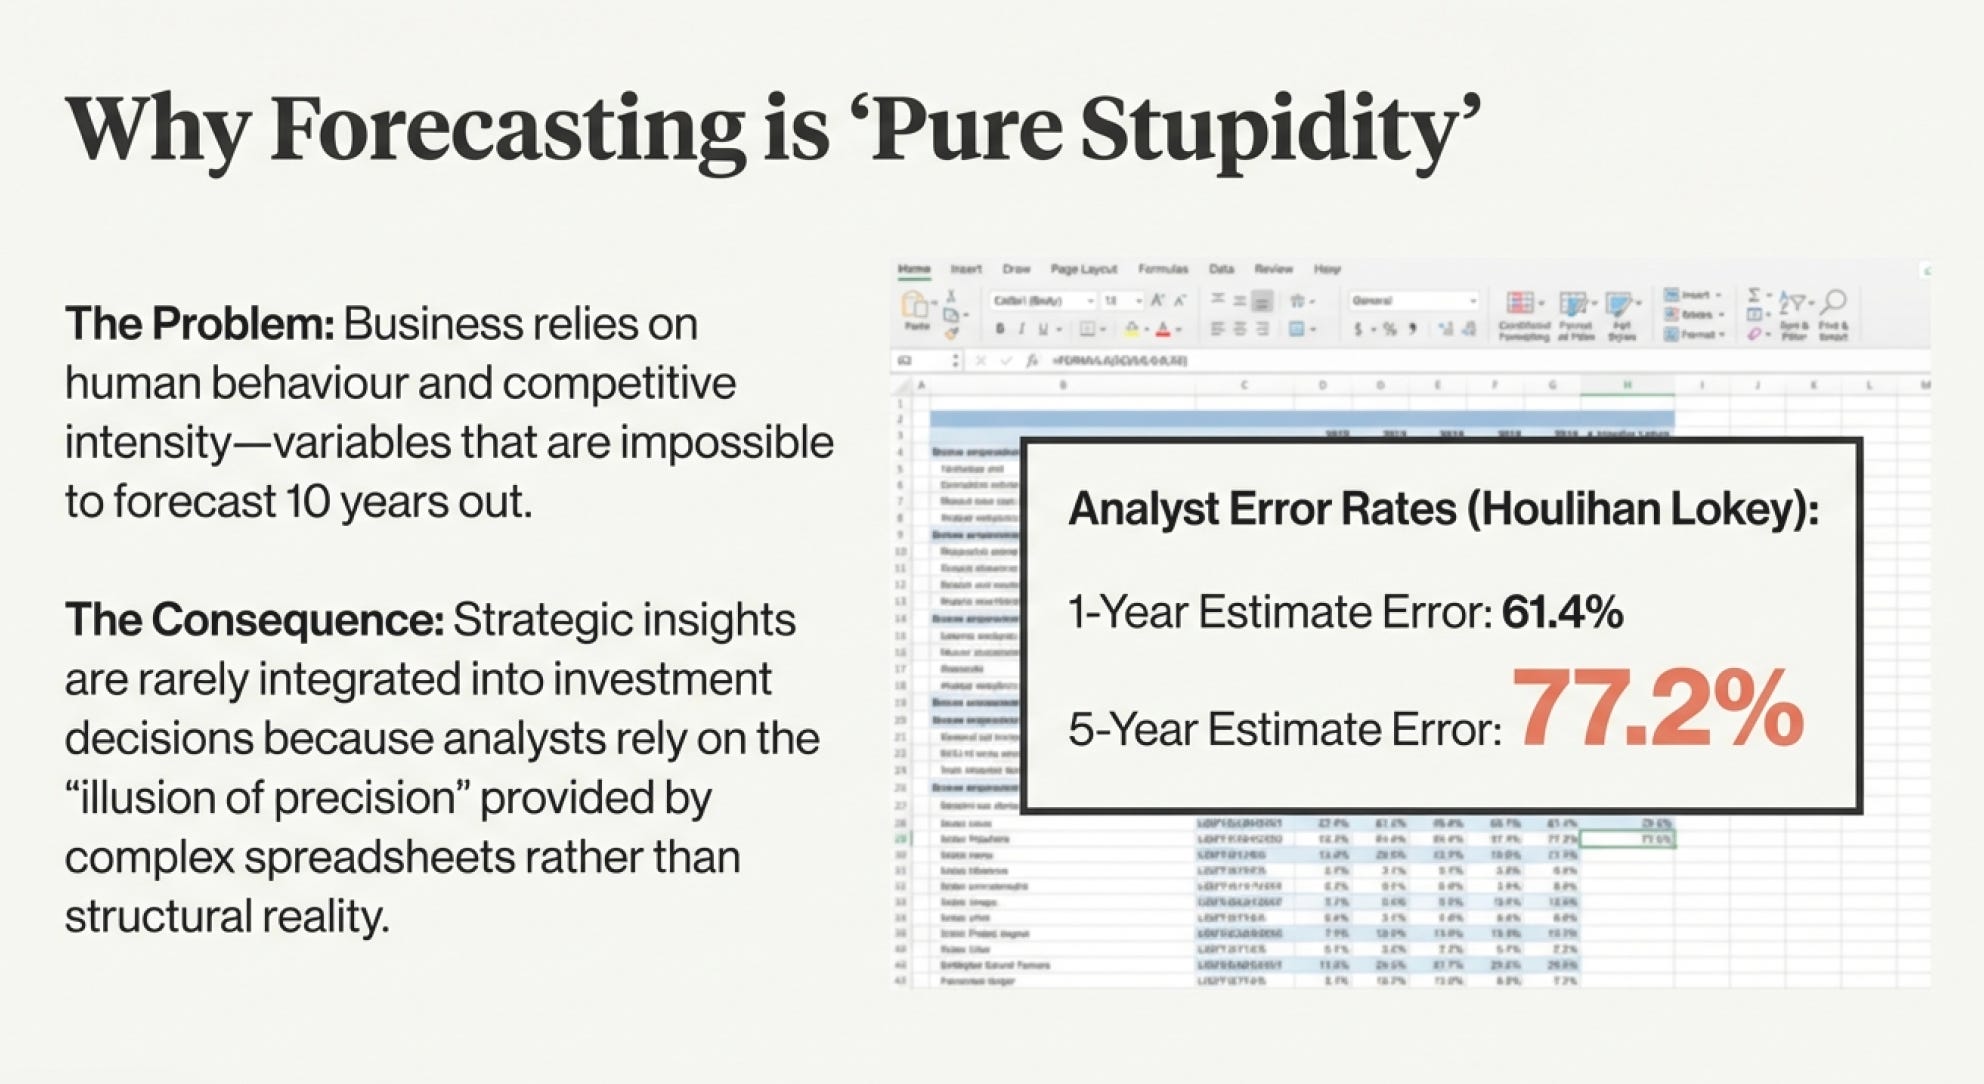
This is Why Forecasting is Pure Stupidity
In business, many variables will depend on the intensity of future competition and human behaviour (hence behavioural finance).
Both of which, carry an impact to competition which is VERY difficult to forecast. Given these difficulties, it is not surprising that strategic insights are rarely integrated effectively into investment decisions - human tendency coupled with the “man with a hammer syndrome” results in oversimplification of risk. Investment analysis with the DCF model (that the majority of the finance industry uses) is massively flawed, yet commonly used. Based on a report by Houlihan Lokey “1-year analyst earnings estimates for FY 2023 have a weighted average % error of 61.4%. The average 1-year weighted % error is 77.2% over the past 5 years“
Valuation From a Strategic Perspective
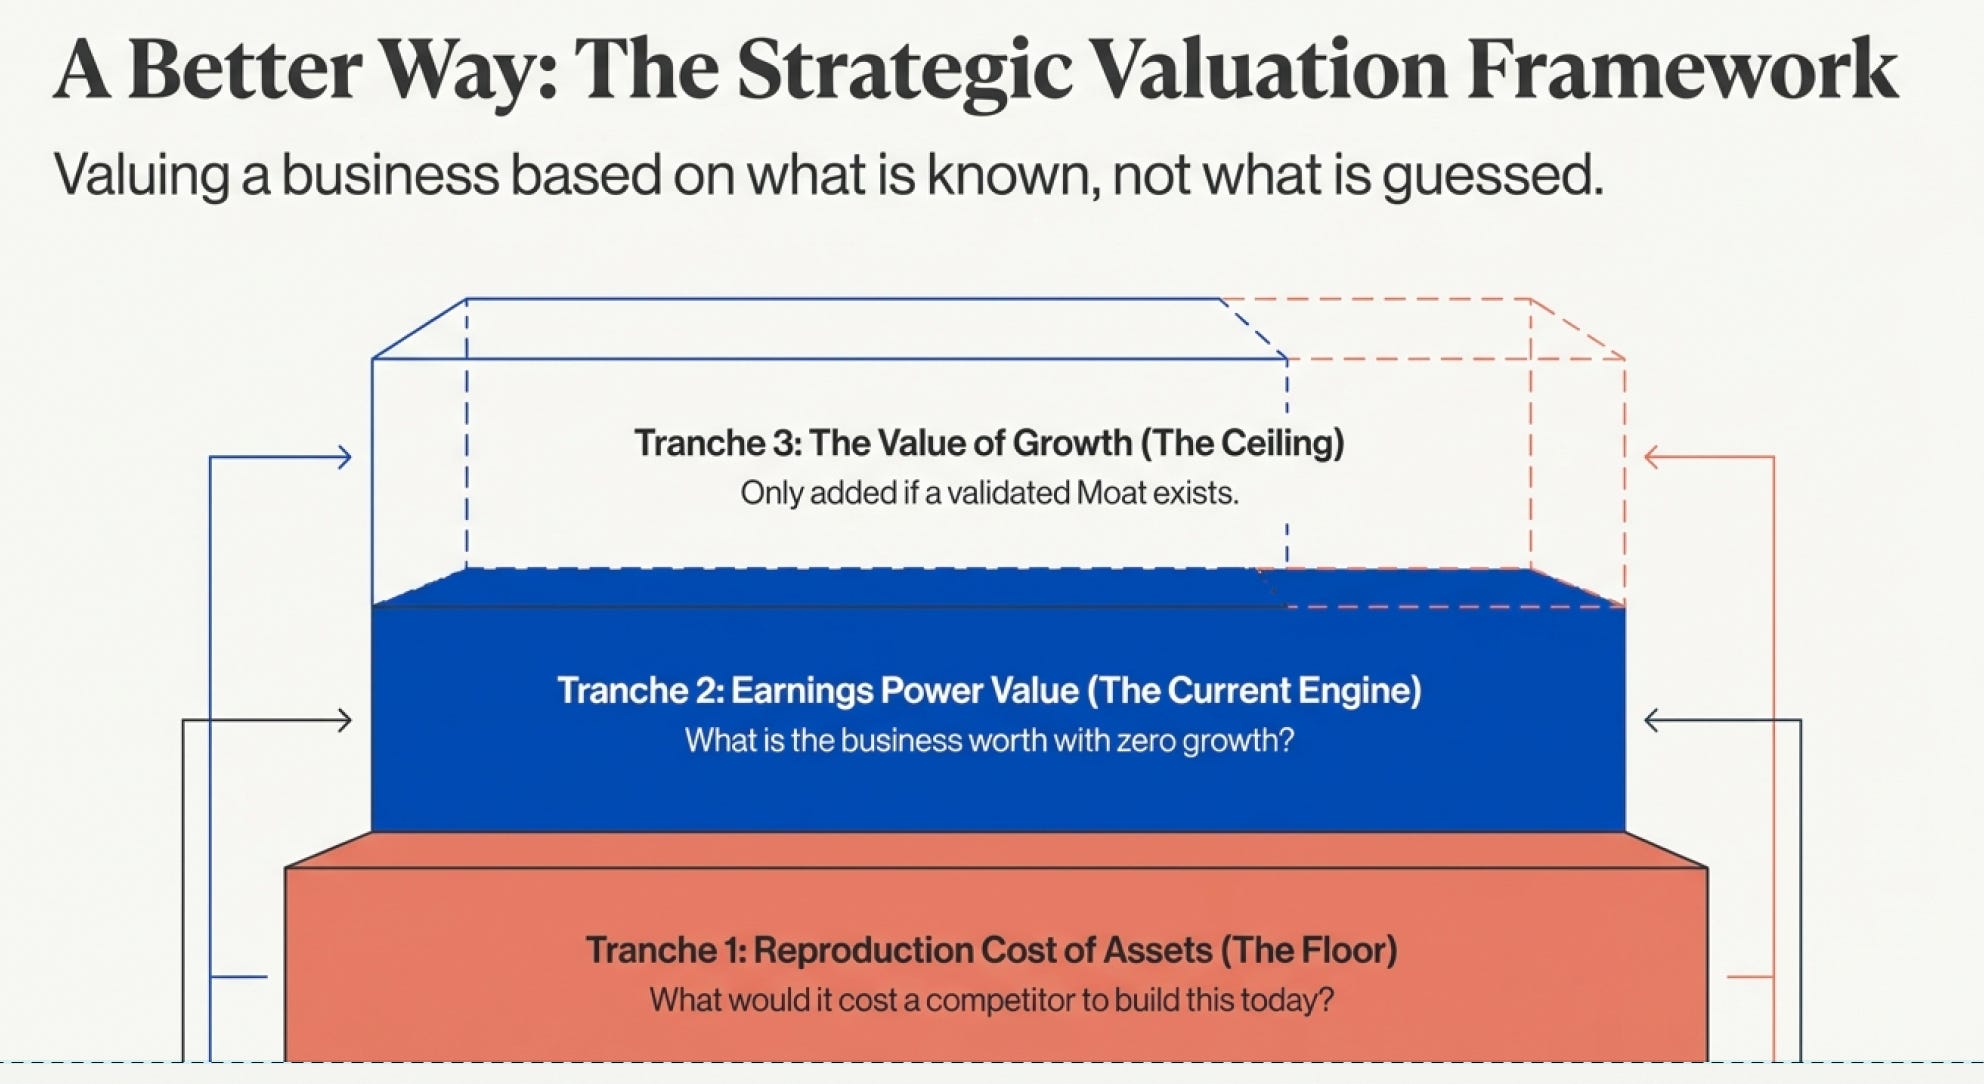
Generally, the industry is built around projections of cashflows from both the investing period and harvesting period. The cashflows are derived from sales, profit margins, tax rate, capital expenditure requirements, and cost of capital which are based on predictions of market size growth rate, attainable market shares, gross margins during forecast period, overhead expenses, working and fixed capital, debt-equity ratio, costs of debt, and costs of equity.
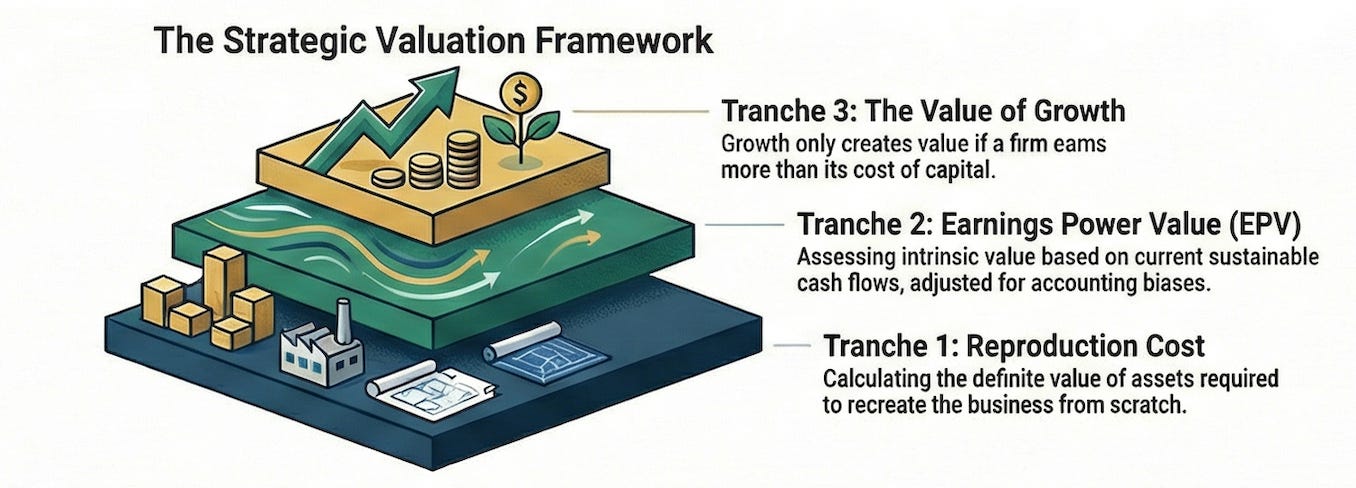
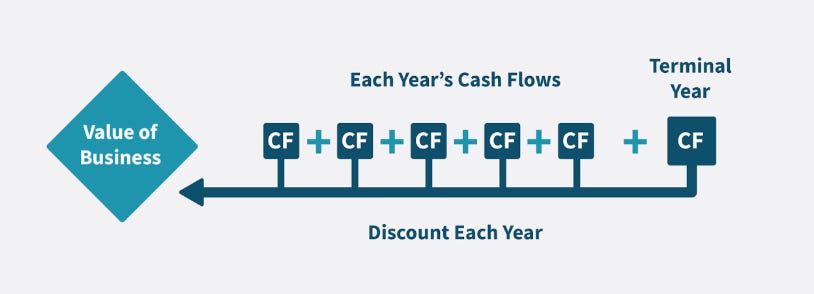
They are then discounted by an appropriate cost of capital and added all together to produce the Net Present Value - this is called the Discounted Cash Flow model. Highly complex with lots of variables involved ain’t it? What’s worse is that business involves human psychology and you never know what will happen next. Let’s not even get started on the Modern Portfolio Theory model or the Capital Asset Pricing Model - if you haven’t heard of it that’s great, just continue to assume they never exist ☺️
3 Fundamental shortcomings of DCF
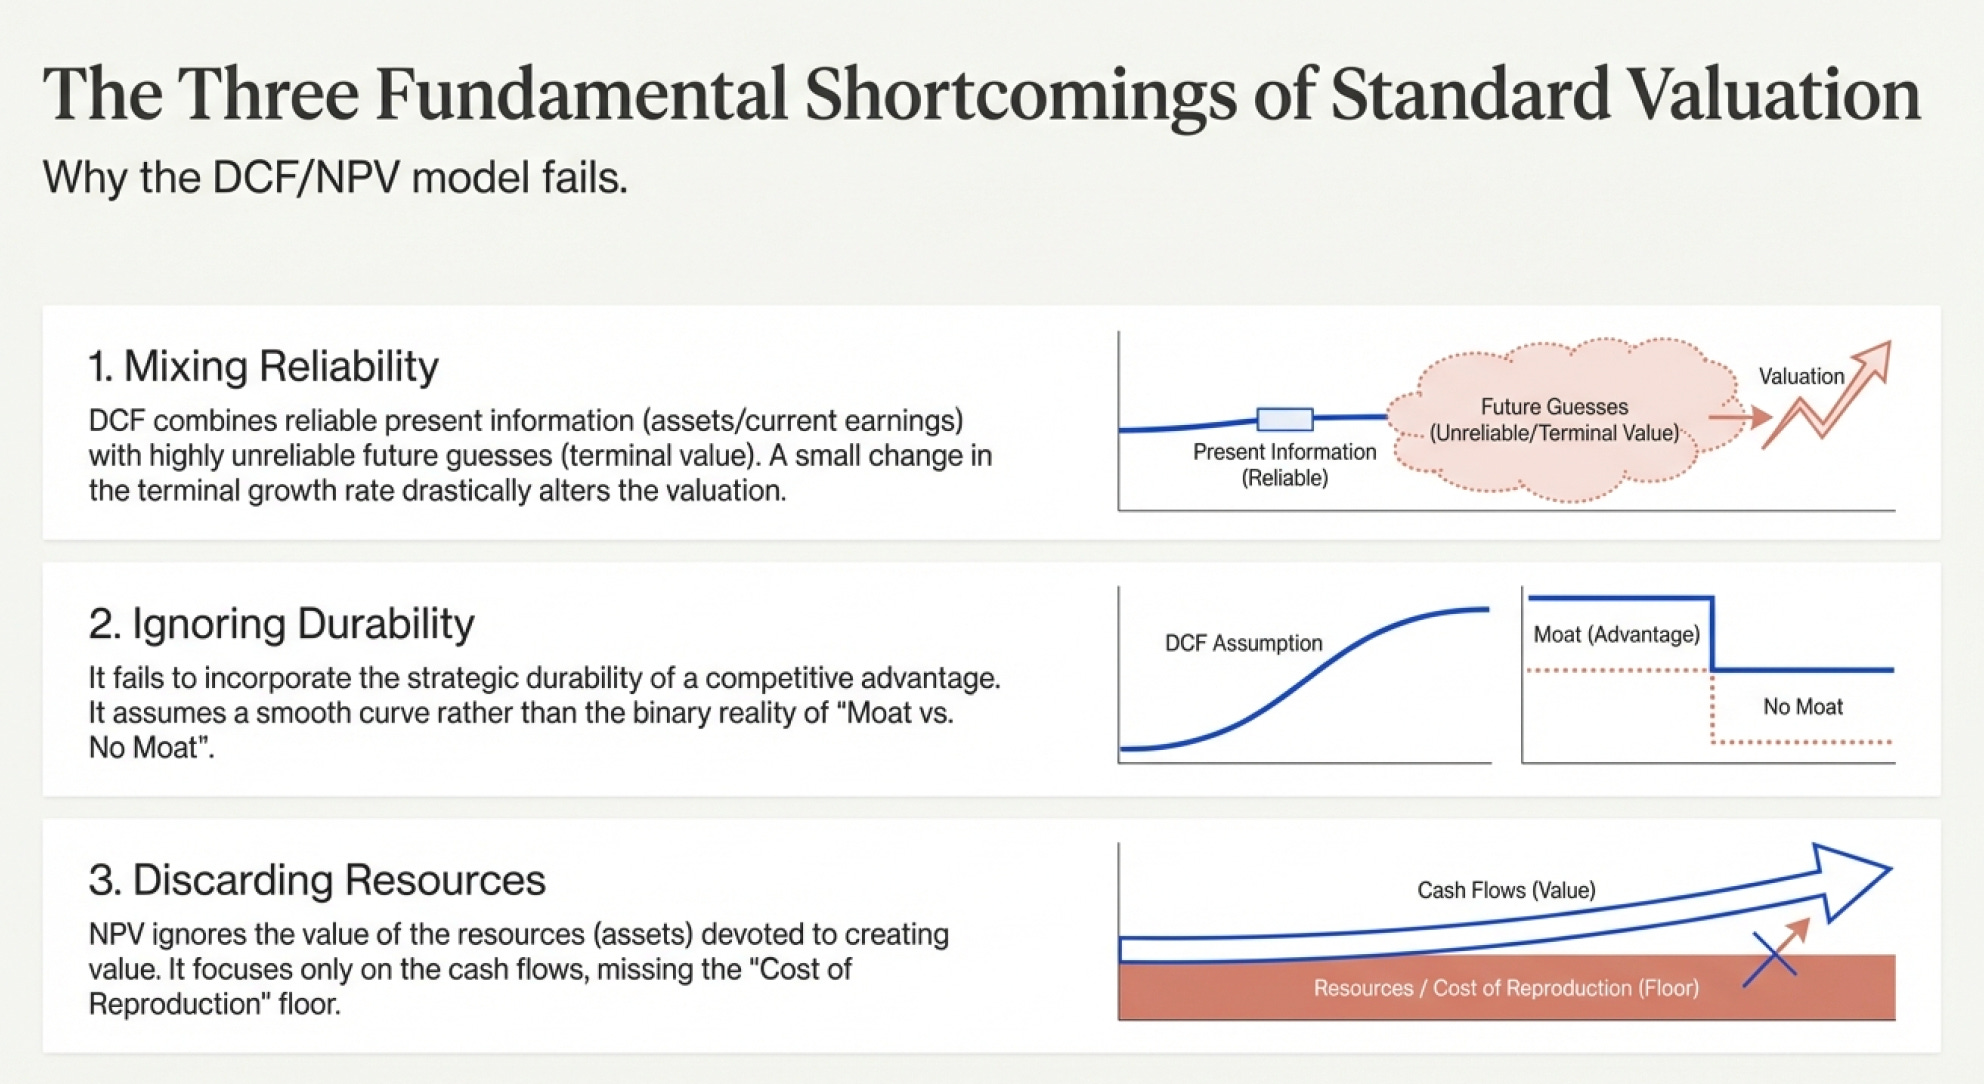
Shortcoming 1: Does not segregate reliable information (present) from unreliable information (future business characteristics)
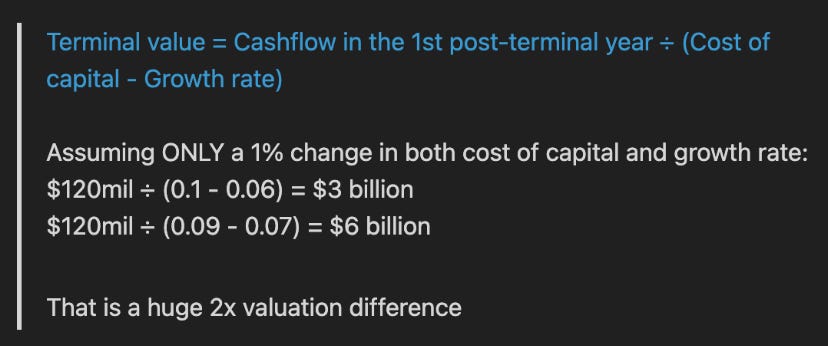
A common method for calculating the terminal value is by multiplying earnings by a factor that represents a value that represents an appropriate ratio of value to earnings e.g. P/E
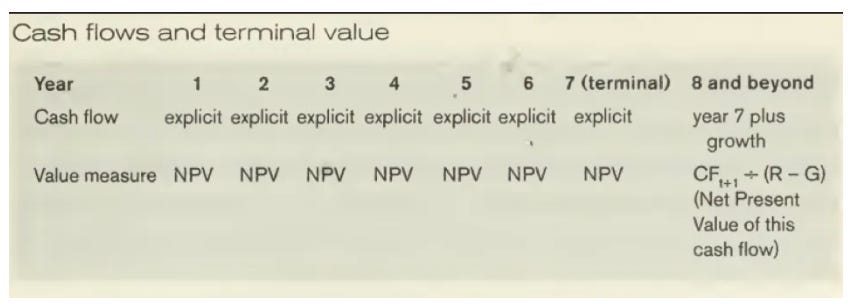
Note: terminal period forecasts for how much the company is able to sell for at the end of the “project” - this value is called the Terminal value
However, a slight change in the Terminal value factor can be very sensitive and result in very inaccurate valuation - especially when the terminal value accounts for most of the NPV. Let’s take a look at an example:
Shortcoming 2: Accurate strategic assumptions about competitive advantage is not incorporated into how the DCF is derived
We can tell if automobile industry is still viable 20 years from now, we can also tell if Ford is able to maintain its competitive advantage 20 years from now, we can also think reasonably if Microsoft is able to maintain its competitive advantage in the next 20 years.
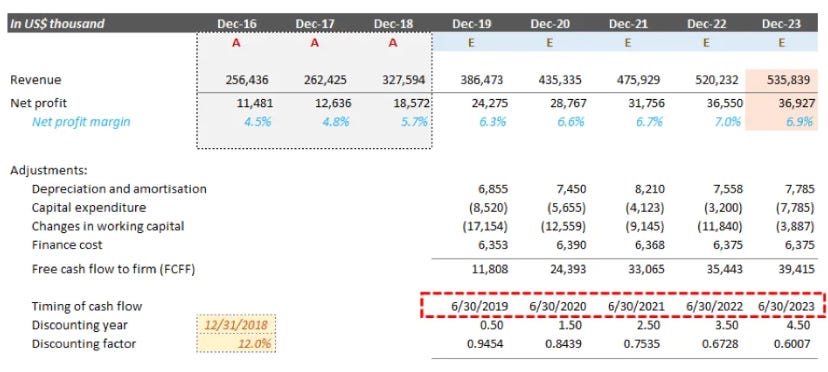
BUT, it is hard to forecast how fast Ford sales will grow, and their profit margins for the next decade - especially if the company is growing fast and introducing many new products with new margins. DCF utilizes many assumptions that are very uncertain.
Shortcoming 3: NPV discards much information relevant to the economic value of a company
There are 2 parts to value creation:
Resource (e.g. assets) devoted to the value creation process
Distributed cashflows created by investing these “Resources”
However, the DCF model only focusses on the 2nd part; “cashflows created by investing the resources”. This is why its flawed.
The 1st part on resources should be considered, because, by knowing about the resources devoted to the value creation, investors will be able to tell how future cashflows will roughly look like. Do however, note that some firms will be able to generate better cashflows than others if provided with the same resources
A Strategic Approach to Valuation
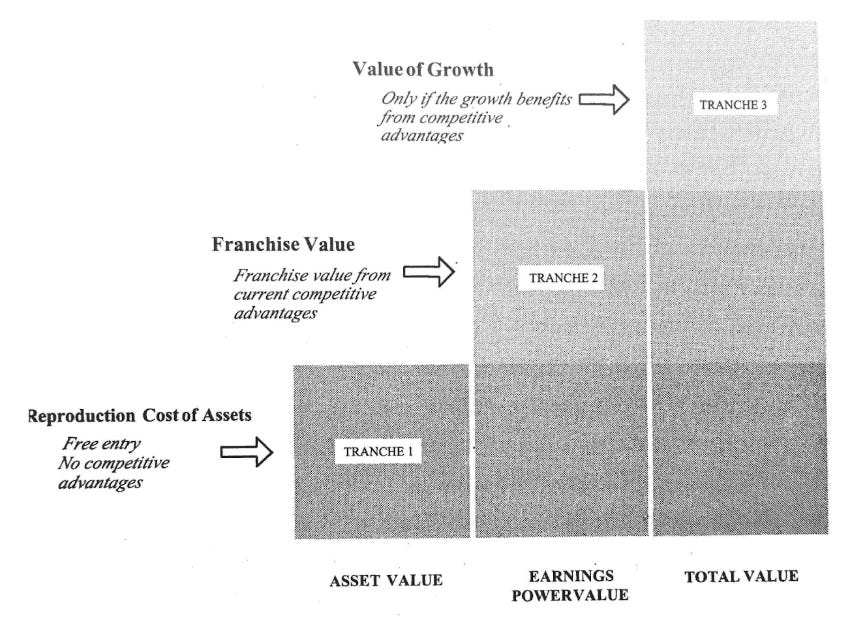

1️⃣ First Tranche: Reproduction cost of assets
Some items have no uncertainty on their worth: These items are definite and we need not doubt its value. e.g. cash & marketable securities on the asset side. Short-term debt on the liabilities side
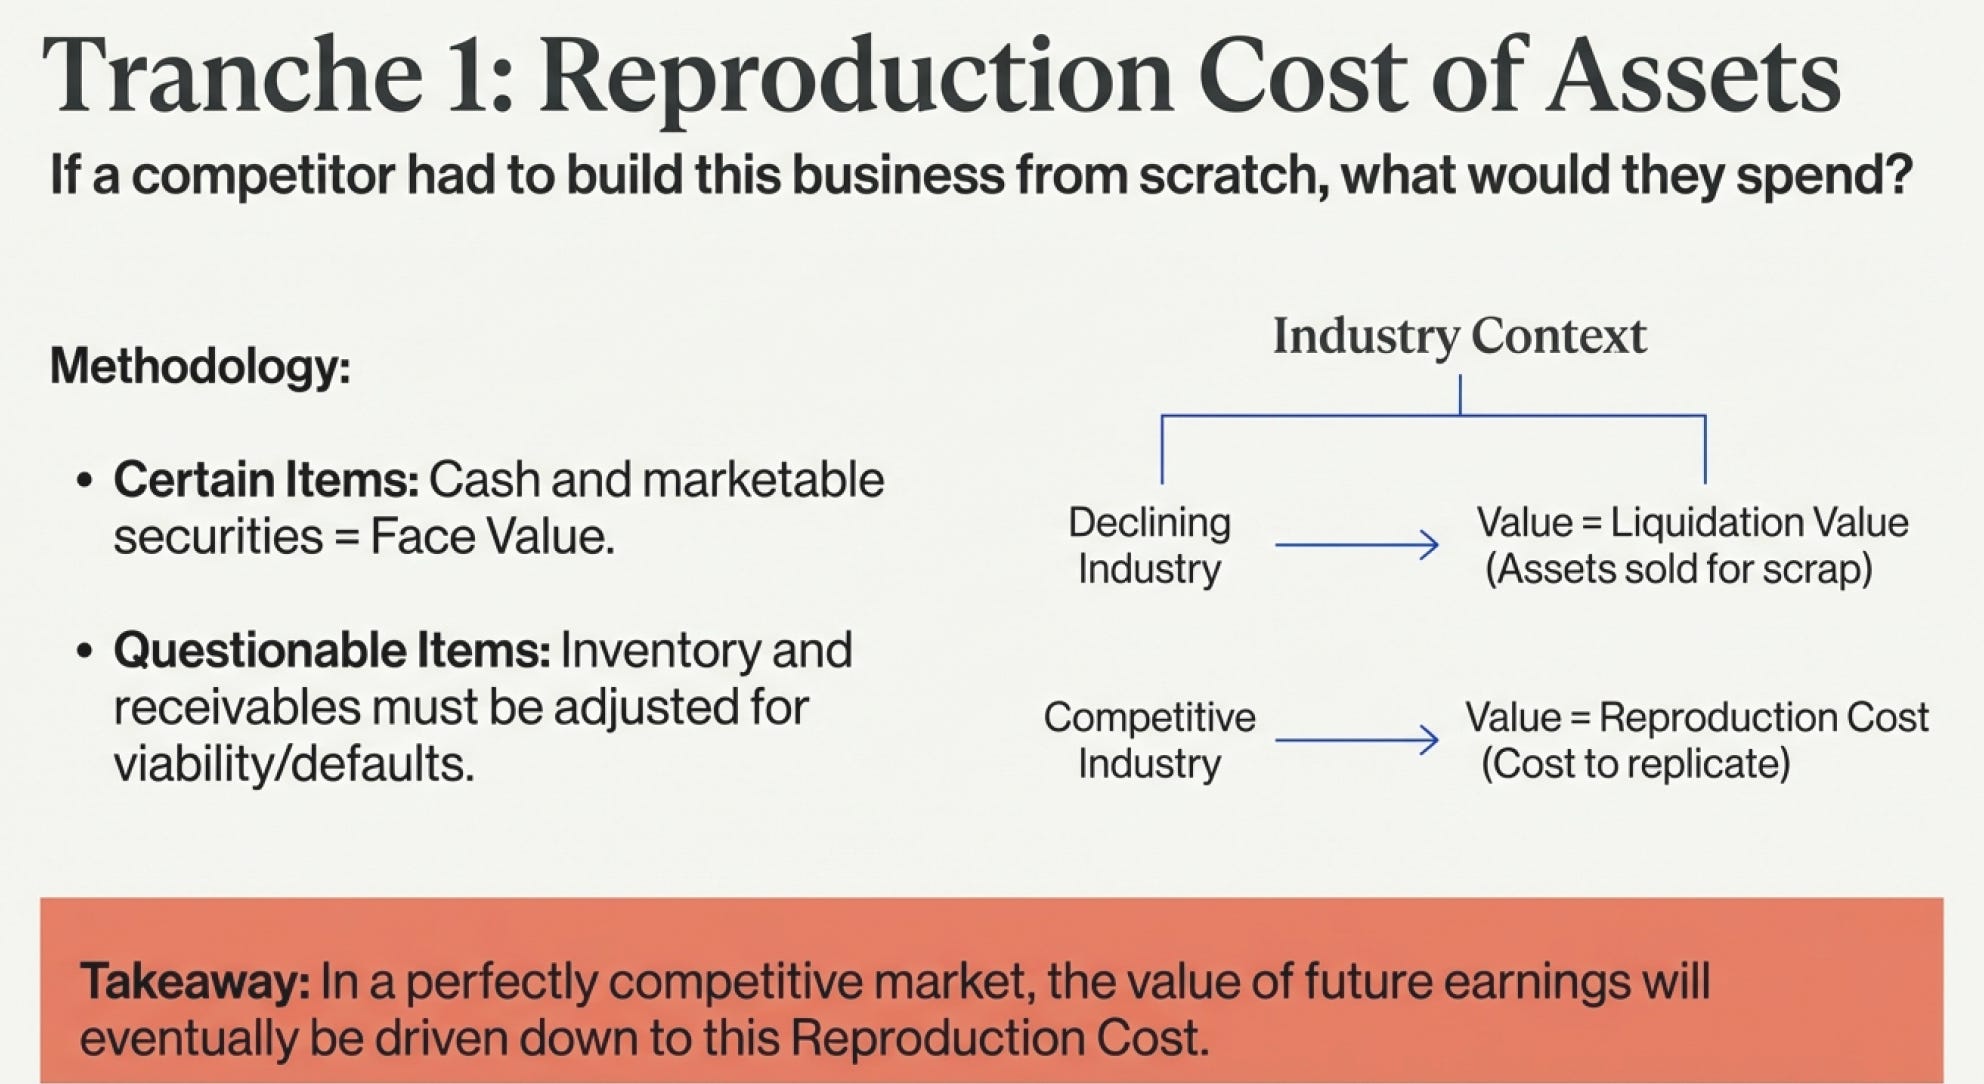
Some items have questionable worth: Will inventory cost still stay the same? Will accounts receivables get paid or will purchasers default?
When assessing assets we have to as ourselves: Will the product market still be economically viable going forward?
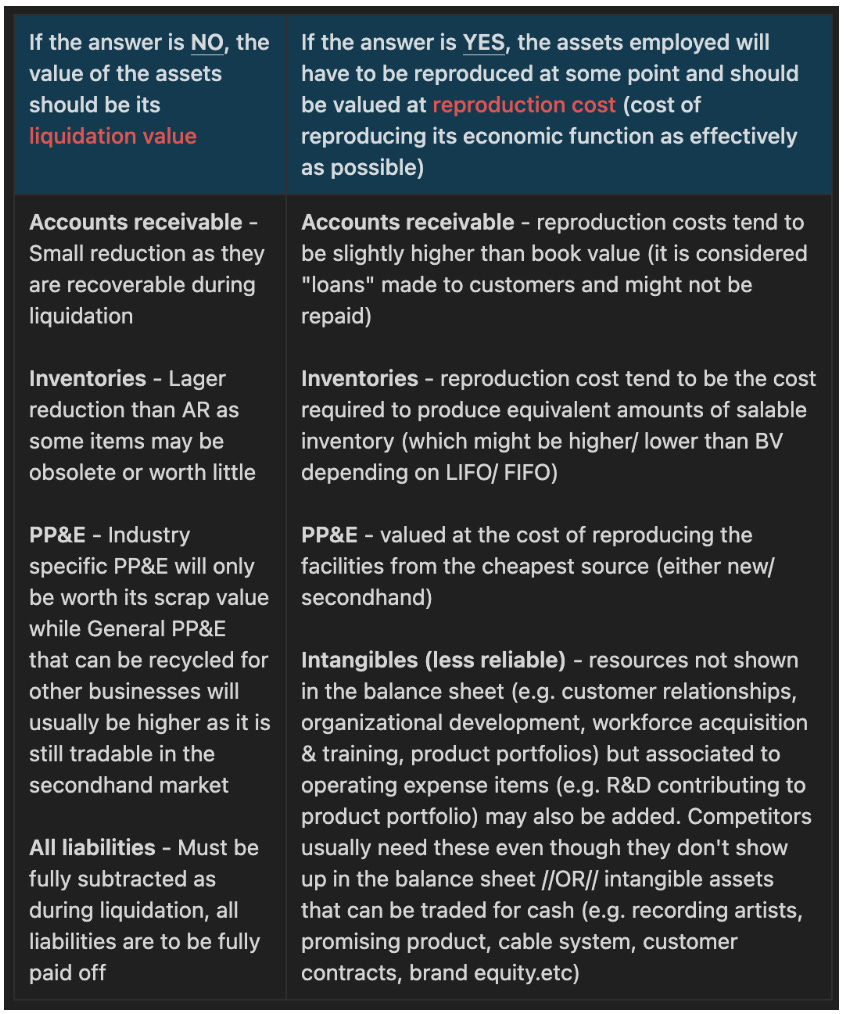
In a declining industry, the value of future earnings will be driven down to reproduction cost. Only when this happens, will the industry stabilize and new entrants reduce dramatically.
In highly competitive industries (with no barriers to entry), competition will eventually make the reproduction value of assets equal to future earnings. This is where we use earnings power for valuation...
2️⃣ Second Tranche: Franchise value (the difference between EPV & Asset value above)
In order to find the franchise value, we must first determine the Earning Power Value (EPV). EPV refers to the intrinsic value of a company and it is based on Earnings Power (EP). EP is derived based on the cashflow that the company can distribute in the near term. By comparing EPV to reproduction cost, we can shed some light on the company’s competitive position in the market.
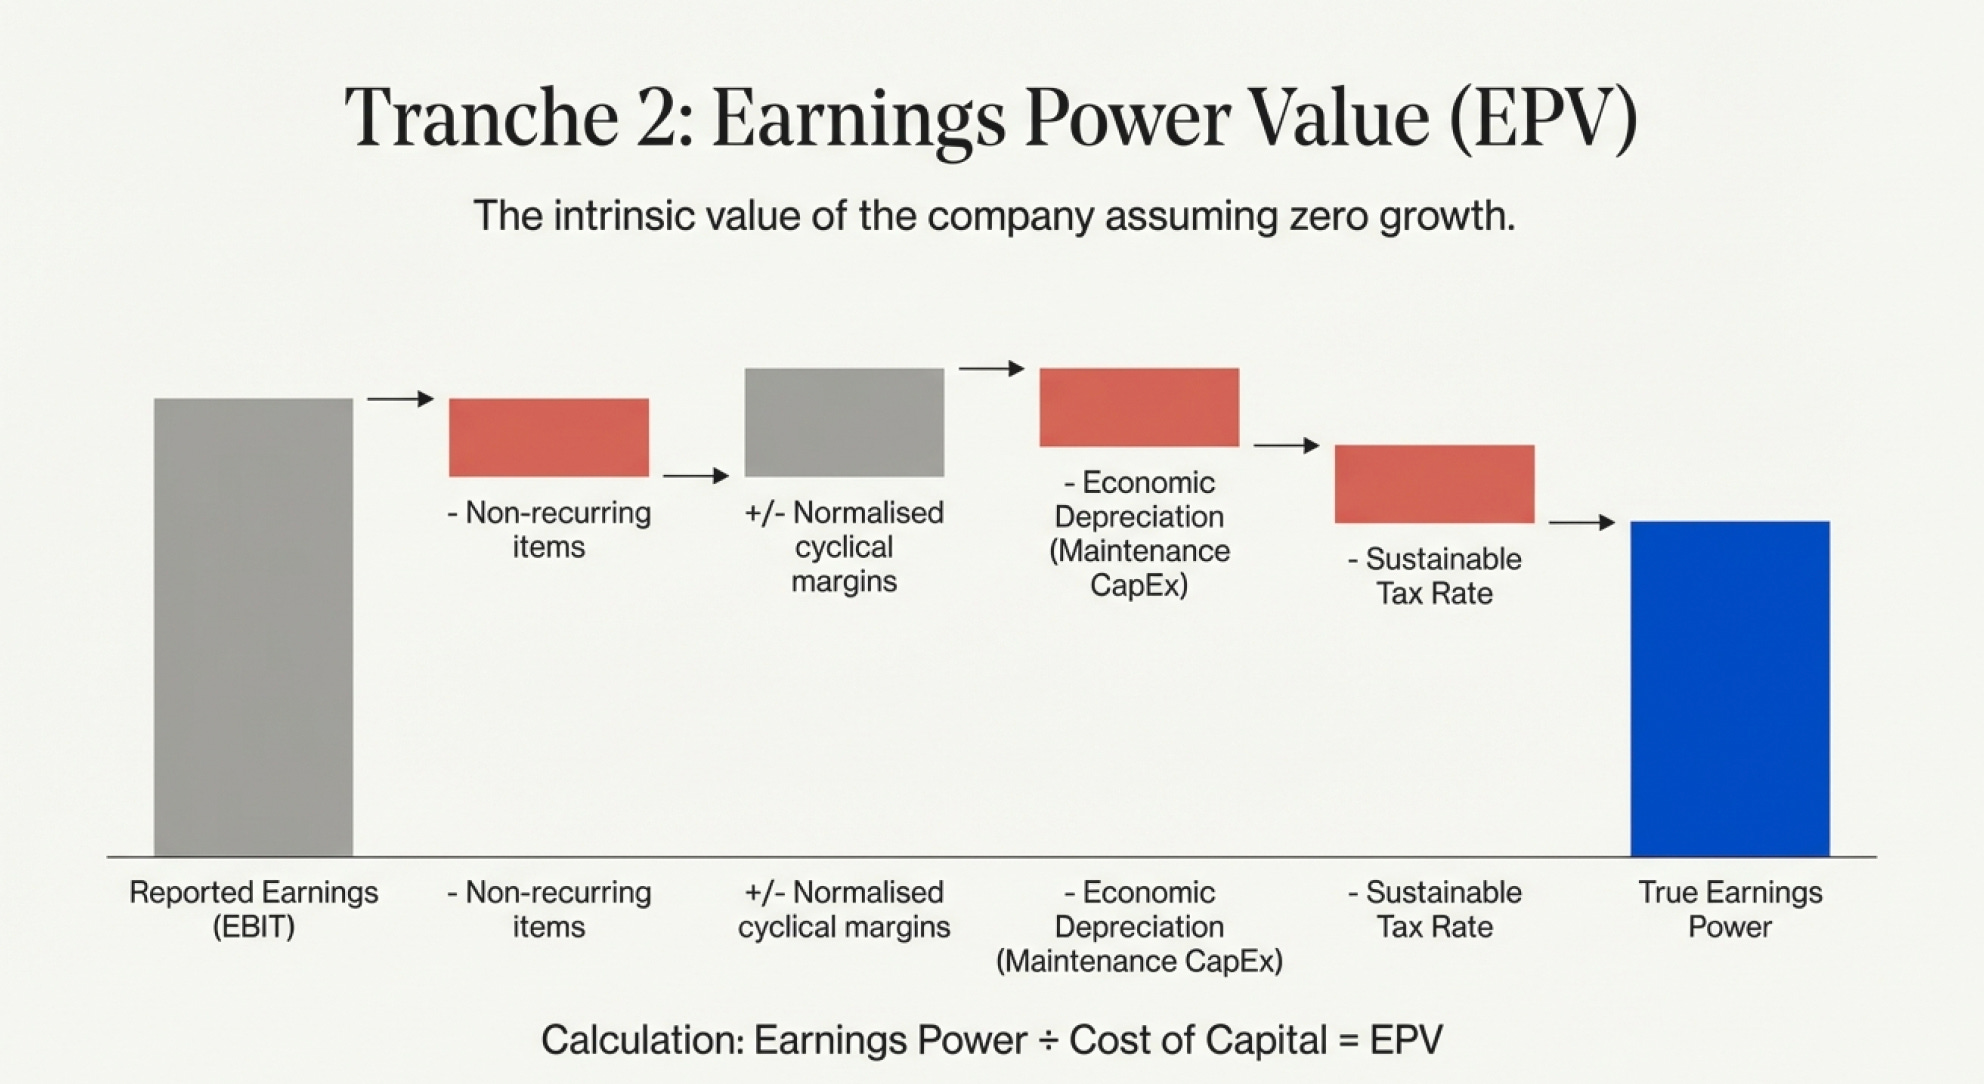
Before calculating the Earnings Power Value (EPV), we will need to adjust reported earnings to (1) remove all accounting biases (2) to have a better idea of the true cashflow. This will be called “Earnings Power”
Start with Operating earnings (EBIT): helps to disregard interest payments & tax benefits from debt
Incorporate non-recurring items (add/ subtract accordingly): This can either be income/ expensed. For incomes some companies attribute non-recurring income as a recurring income to buff up recurring earnings. For expenses some companies cram “incurred losses over the years” into a single year, hence buffing up recurring earnings in years that it was not charged - in such cases total loss incurred over the period shall be subtracted
After eliminating accounting manipulations, current earnings must be adjusted for any cyclical variation: calculate the average Operating Margins over a period of years (preferably 10) and apply that margin to current sales. If sales are also sensitive to the cycle, they should be averaged too
Account for (add) relevant depreciation: economic depreciation should equal the amount that needs to be spent to return a firm’s capital stock at the end of the year to where it was at the start of the year. Since equipment prices decline and accounting depreciation usually overstates the rate at which the asset wear out, depreciation will typically exceed the actual expense used to maintain the capital stock.
Special circumstances that call for adjustments: (a) money losing operation that may be closed down, increasing earnings (b) management insensitive to pricing opportunities that might potentially be triggered to increase earnings (c) a consolidated subsidiary may be reporting equity earnings only instead of cashflow earnings, this reduces actual earnings as no real cash is collected
Tax adjustments: taxes may vary, so use a average sustainable tax rate
Now that we have gotten the Earnings Power, we can calculate EPV by including the Cost of Capital (both equity and debt)
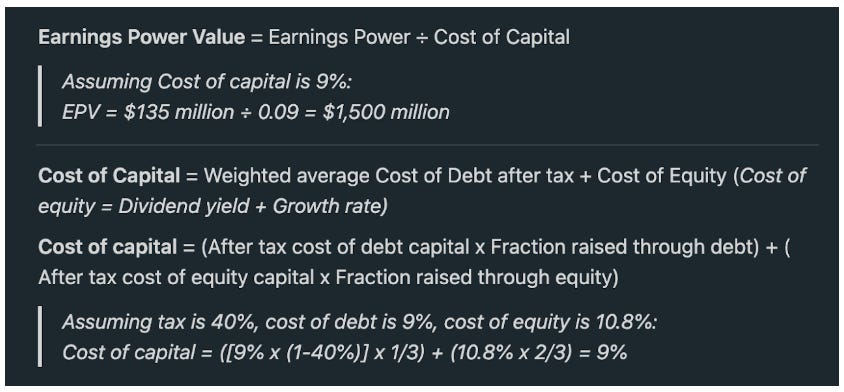
A sustainable debt-equity is the lower of the 2 options below
Amount of debt the firm can carry on average without impairing its operating performance (⭐️ preferred because debt financing generally has a lower cost than equity due to tax)
Historical average debt level
Now that we have gotten both the EPV and Asset value from the first tranche, we can calculate the Franchise value
Leaving aside growth, Assets & EPV are the 2 MOST distinct ways to estimate the value of a company. A comparison between them can result in three different scenarios
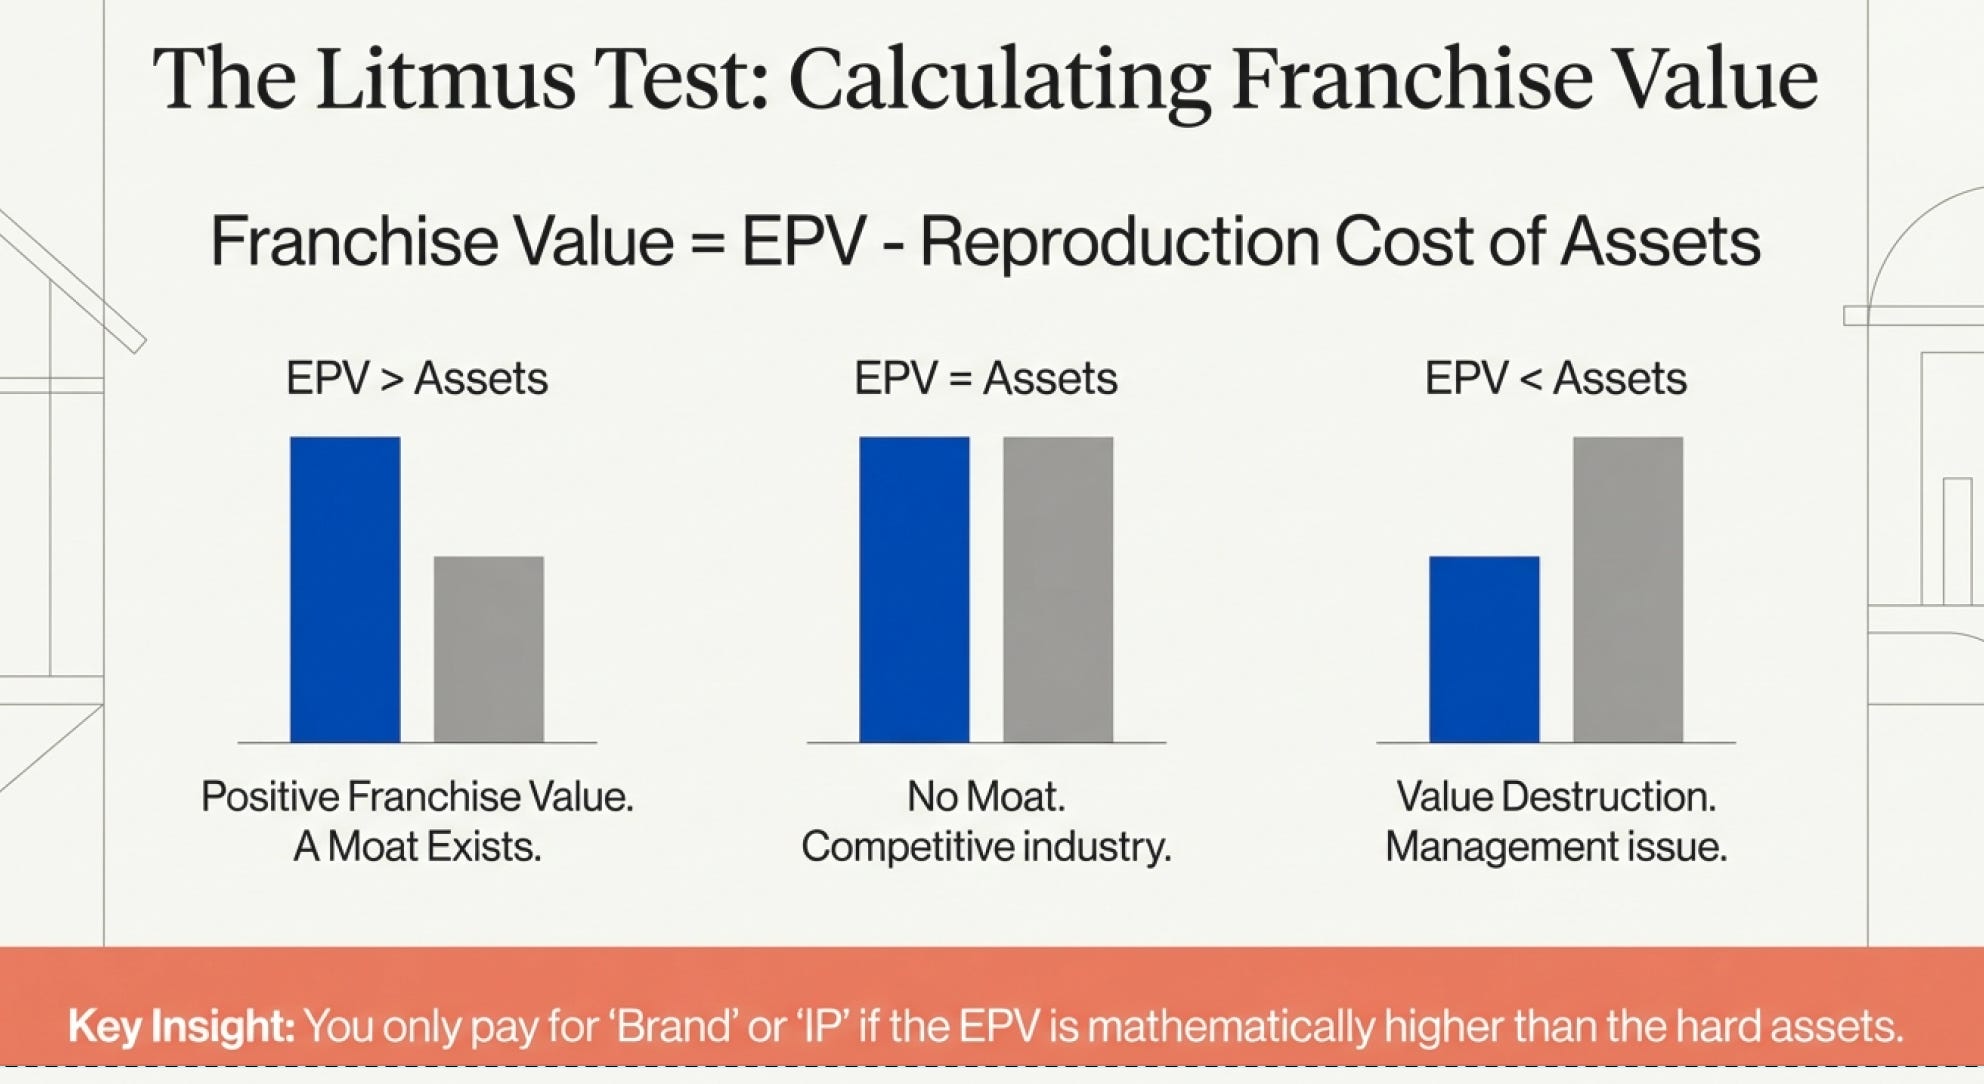
Scenario 1: EPV exceeds asset value
Current earnings power is creating value in excess to the reproduction cost of the assets. Only a enterprise with a significant barriers to entry can sustainably maintain EPV over assets value. In other words, franchise value is a value to quantify a firm’s moat/ competitive edge
Scenario 2: EPV equals Asset value
This would be seen when there is no prominent competitive advantage. In this case market share would be unstable and no firms would be earning extraordinary returns on capital
Scenario 3: Asset value exceeds EPV
With reference to “first cut: assets” if the correct valuation method was used (liquidation value/ reproduction cost) and Assets value exceeds EPV, the only reason for this would be deficient management; the management is not producing returns corresponding to the assets put to work. This is the playing field of deep value stocks and activists, where NPV is not likely to touch.
An Important Note:
The only scenario that makes sense to value a company via its earnings power is when its earnings power is able to outperform its asset value (regardless of liquidation or replacement) - in other words; when a company has a strong durable moat. Simultaneously, we need not make valuation of earnings power so complicated. It can be done simply using the P/E ratio (relative valuation) since markets are always based off a “willing buyer, willing seller” principle.
Remember that - as with all things, valuation is subjective as well.
3️⃣ Third Tranche: Value of growth
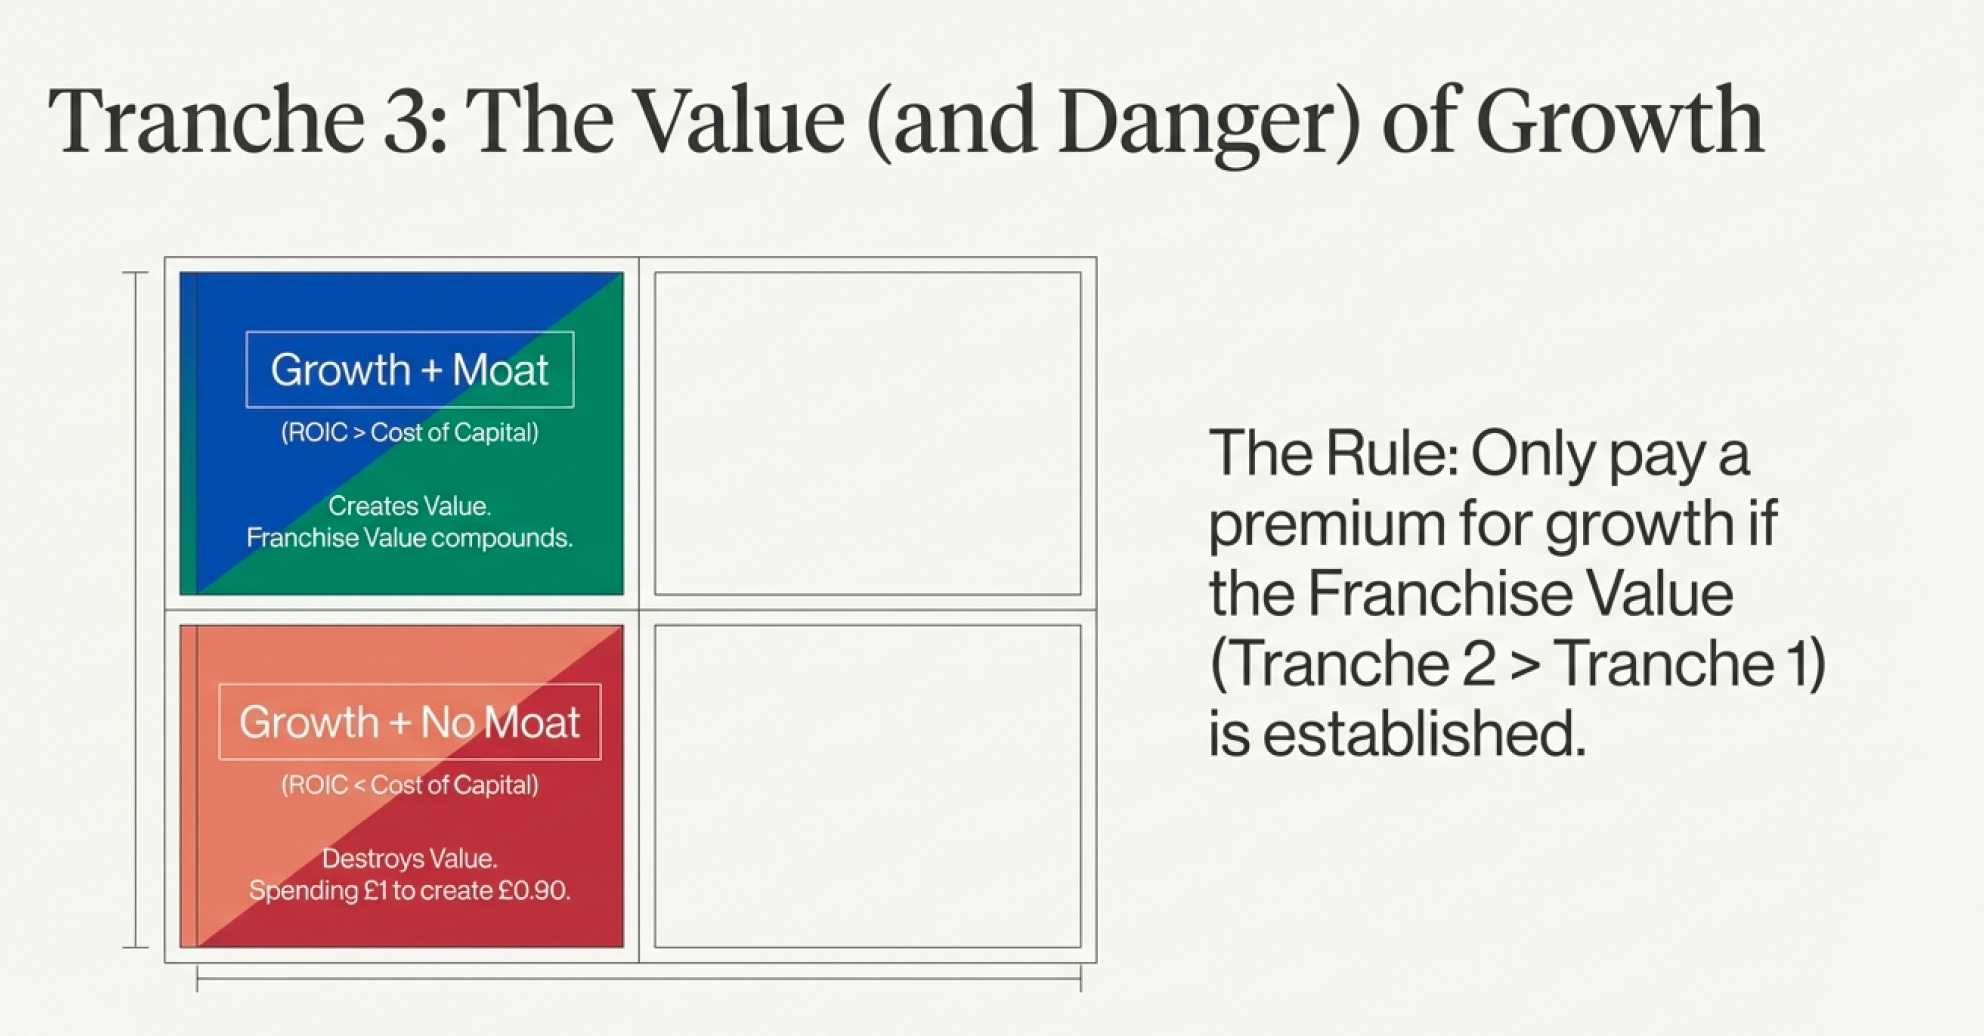
When growth is bad
Suppose that Cost of capital is 10% and management earns below the Cost of capital (8%) based on past performance. In this case, growth destroys value due to either
Poor management
A competitive disadvantage
The investor is now at a deficit of -2% because of the high Cost of capital. This is a result from equity cost (due to high industry growth) and low performance (due to competitive pressures on margins).
When growth is good
Only growth in the presence of competitive advantages creates value. This is the equivalent of scenario 1 in the second tranche, where EPV exceeds the Assets value and there is a significant “Franchise value” relative to competitors and other companies you are reviewing due to its Barriers of entry (moat).
When a business does not have a moat (and emphasis on durability of the moat), the asset value will often erode down to its low earnings power.
References
Hormozi, Alex. $100M Offers: How To Make Offers So Good People Feel Stupid Saying No. Acquisition.com Publishing, 2021
Hormozi, Alex. $100M Leads. Acquisition.com Publishing, 2023. ASIN: B0CFDR3TYV.
Brunson, Russell. DotCom Secrets: The Underground Playbook for Growing Your Company Online. Morgan James Publishing, 2015. ISBN: 9781630474775.
Koch, Charles G. Good Profit: How Creating Value for Others Built One of the World’s Most Successful Companies. Crown Business, 2015. ISBN: 9780804189323.
Sullivan, Dan, and Hardy, Benjamin. The Laws of Lifetime Growth: Always Make Your Future Bigger Than Your Past. Berrett-Koehler Publishers, 2006.
Munger, Charles T., edited by Peter D. Kaufman. Poor Charlie’s Almanack: The Wit and Wisdom of Charles T. Munger. Donning Company Publishers, 2005.
Priestley, Daniel. 24 Assets: Create a Digital, Scalable, Valuable and Fun Business That Will Thrive in a Fast Changing World. Rethink Press, 2016.
Collins, Jim. Good to Great: Why Some Companies Make the Leap... and Others Don’t. HarperBusiness, 2001.
Godin, Seth. Purple Cow: Transform Your Business by Being Remarkable. Portfolio, 2003.
Godin, Seth. This is Marketing: You Can’t Be Seen Until You Learn to See. Portfolio, 2018.
Suby, Sabri. Sell Like Crazy: How to Get As Many Clients, Customers and Sales As You Can Possibly Handle. King Kong, 2019.
Priestley, Daniel. Oversubscribed: How to Get People Lining Up to Do Business with You. Capstone, 2015.
Greenwald, Bruce, and Judd Kahn. Competition Demystified: A Radically Simplified Approach to Business Strategy. Portfolio, 2005.
Slow Ventures. “Franchising Thesis - Why Venture Should Care About Franchises.” DocSend, accessed May 7, 2025. https://docsend.com/view/68uxgs3jawk2szrv