
🔑 Introduction
In November 2023, I stumbled upon what appeared to be a classic value investment opportunity: Imperial Petroleum (IMPP), a small-cap shipping company trading at what seemed like a significant discount to its intrinsic value. The setup was compelling—a massive cash pile, an aging global tanker fleet creating supply constraints, and an insider, Harry Vafias, who controlled nearly 66% of the company through various ownership structures.
The investment thesis rested on several converging factors. First, the company was essentially a net-net, trading below its liquidation value with substantial cash relative to its market cap. Second, the global shipping environment was favorable—vessel shortages in 2023 had spiked tanker rates in 2024, and the orderbook for new ships suggested this dynamic would persist until at least 2027. Third, management had announced plans to more than double the fleet size, which should translate directly into higher earnings that the market would eventually recognize.
The Analysis
My research process was methodical. I started by dissecting Imperial Petroleum’s complex capital structure—34 million shares of common stock, nearly 800,000 shares of preferred stock with liquidation preferences, and five separate classes of warrants (A through E) with strike prices ranging from $2.00 to $24.00. I modeled the worst-case dilution scenario, calculating that if every warrant was exercised, the company would have approximately 40.5 million shares outstanding.
I then performed a liquidation value analysis, applying recovery rates of: 100% for cash, 80% for receivables, and 90% for vessels (though I subsequently realised that vessel recovery actually ranges anywhere from 15% to 69% depending on market conditions).
Despite so, under stress scenarios, the company still appeared to have meaningful asset backing. I examined various earnings scenarios based on historical Time Charter Equivalent (TCE) rates. Using 2016 rates—the lowest in recent memory—the company could generate approximately $18 million in annual net profit, or $0.40 EPS. With the fleet’s estimated 13 years of remaining useful life, this suggested a conservative valuation of $5.20 per share. In the best case scenario - using the prevailing market rates at the time at the time of analysis, pointed toward price closer to $10 per share.
But liquidation value was just the floor. The real opportunity lay in the earnings potential. I analyzed the company’s fleet composition—seven MR product tankers, two Suezmax tankers, three Handysize dry-bulk carriers, five Supramax dry-bulk carriers, and two Kamsarmax dry-bulk carriers. The company had also contracted to acquire three additional dry-bulk vessels for delivery by August 2026.
The Shipping Fundamentals
The macro backdrop appeared supportive. The global tanker fleet was aging because too few young ships had been ordered, tanker demolitions had collapsed after 2022, and sanctions had given very old ships a new lease on life. Meanwhile, crude oil demand was showing growth, OPEC was signaling increased supply to regain market share (potentially boosting shipping volumes), and new LNG projects were coming online that could benefit IMPP’s fleet mix.
The timing consideration was the orderbook—new vessel supply would likely hit the market around 2027, decreasing tanker rates. But through 2026, the supply-demand dynamics appeared favorable, particularly as the expanded fleet came online.
Why This Opportunity Existed
In a move that blindsided investors, Harry Vafias—the very insider whose massive stake was supposed to align him with shareholders—executed multiple direct offering and warrant dilution of up to c.$60 million. This wasn’t just dilutive; it was devastatingly so. In summary, the factors that contributed in the massive pressure in downward stock price are:
Complexity: The capital structure was Byzantine—five classes of warrants, preferred shares, and the need to model full dilution deterred casual investors
Small-cap obscurity: With a market cap under $200 million, IMPP flew beneath most institutional radars
Shipping skepticism: The sector had burned investors before with cyclical busts and value traps
Execution risk: Management’s plan to double the fleet required flawless execution and favorable financing
However, when we took a closer look, the downside appeared protected by asset value, while the upside was driven by a straightforward catalyst: fleet expansion leading to higher earnings that the market would eventually recognize.
As this is a deep value analysis, i will focus delivering my points via 3 sections
How many birds are in the bush
How sure are you
How fast till you get them out
🔑 How Many Birds Are in the Bush?
When I evaluate any investment opportunity, I need to answer a fundamental question: what’s the intrinsic value?
The Conservative Case: $5.20 Per Share
My most conservative valuation anchored on the absolute worst shipping rates in recent history—2016 levels. This wasn’t about predicting another 2016; it was about understanding the floor. If IMPP’s fleet had to operate in truly depressed conditions, what would it earn?
Working through the math:
7 MR product tankers at $14,500 TCE/day each = $101,500 daily
2 Suezmax tankers at $27,000 TCE/day each = $54,000 daily
3 Handysize dry-bulk at $5,000/day each = $15,000 daily
5 Supramax dry-bulk at $5,000/day each = $25,000 daily
2 Kamsarmax dry-bulk at $5,000/day each = $10,000 daily
Total daily fleet revenue: $205,500
Based on its past operating performance, we use a 80% utilization (292 operating days per year), which translated to approximately $60 million in annual revenue. With shipping economics typically yielding 30% net profit margins, that meant roughly $18 million in net profit, or $0.40 earnings per share based on the fully diluted share count.
Here’s where the fleet’s remaining useful life became relevant. With vessels averaging about 13 years of service left (assuming a 30-year lifespan and average fleet age), I could apply a simple multiple: $0.40 × 13 years = $5.20 per share.
This represented a 49% upside from the $3.50 entry price, even in a worst-case scenario. Not spectacular, but a solid margin of safety.
The Current Rate Case: $10 Per Share
The more interesting picture emerged when I applied the prevailing November 2023 charter rates:
7 MR product tankers at $25,000 TCE/day each = $175,000 daily
2 Suezmax tankers at $38,900 TCE/day each = $77,800 daily
3 Handysize dry-bulk at $12,000/day each = $36,000 daily
5 Supramax dry-bulk at $10,000/day each = $50,000 daily
2 Kamsarmax dry-bulk at $14,000/day each = $28,000 daily
Total daily fleet revenue: $366,800
At 292 operating days annually, this produced roughly $107 million in revenue and $32 million in net profit—translating to $0.80 EPS. Using the same 13-year fleet life multiple yielded a valuation around $10 per share.
This represented a 186% upside from the entry price. If the market eventually recognized IMPP’s earning power at prevailing rates, the returns could be substantial.
The Liquidation Value Floor: Asset Protection
Beyond earnings, I wanted to understand the asset backing. What if everything went wrong and the company had to liquidate?
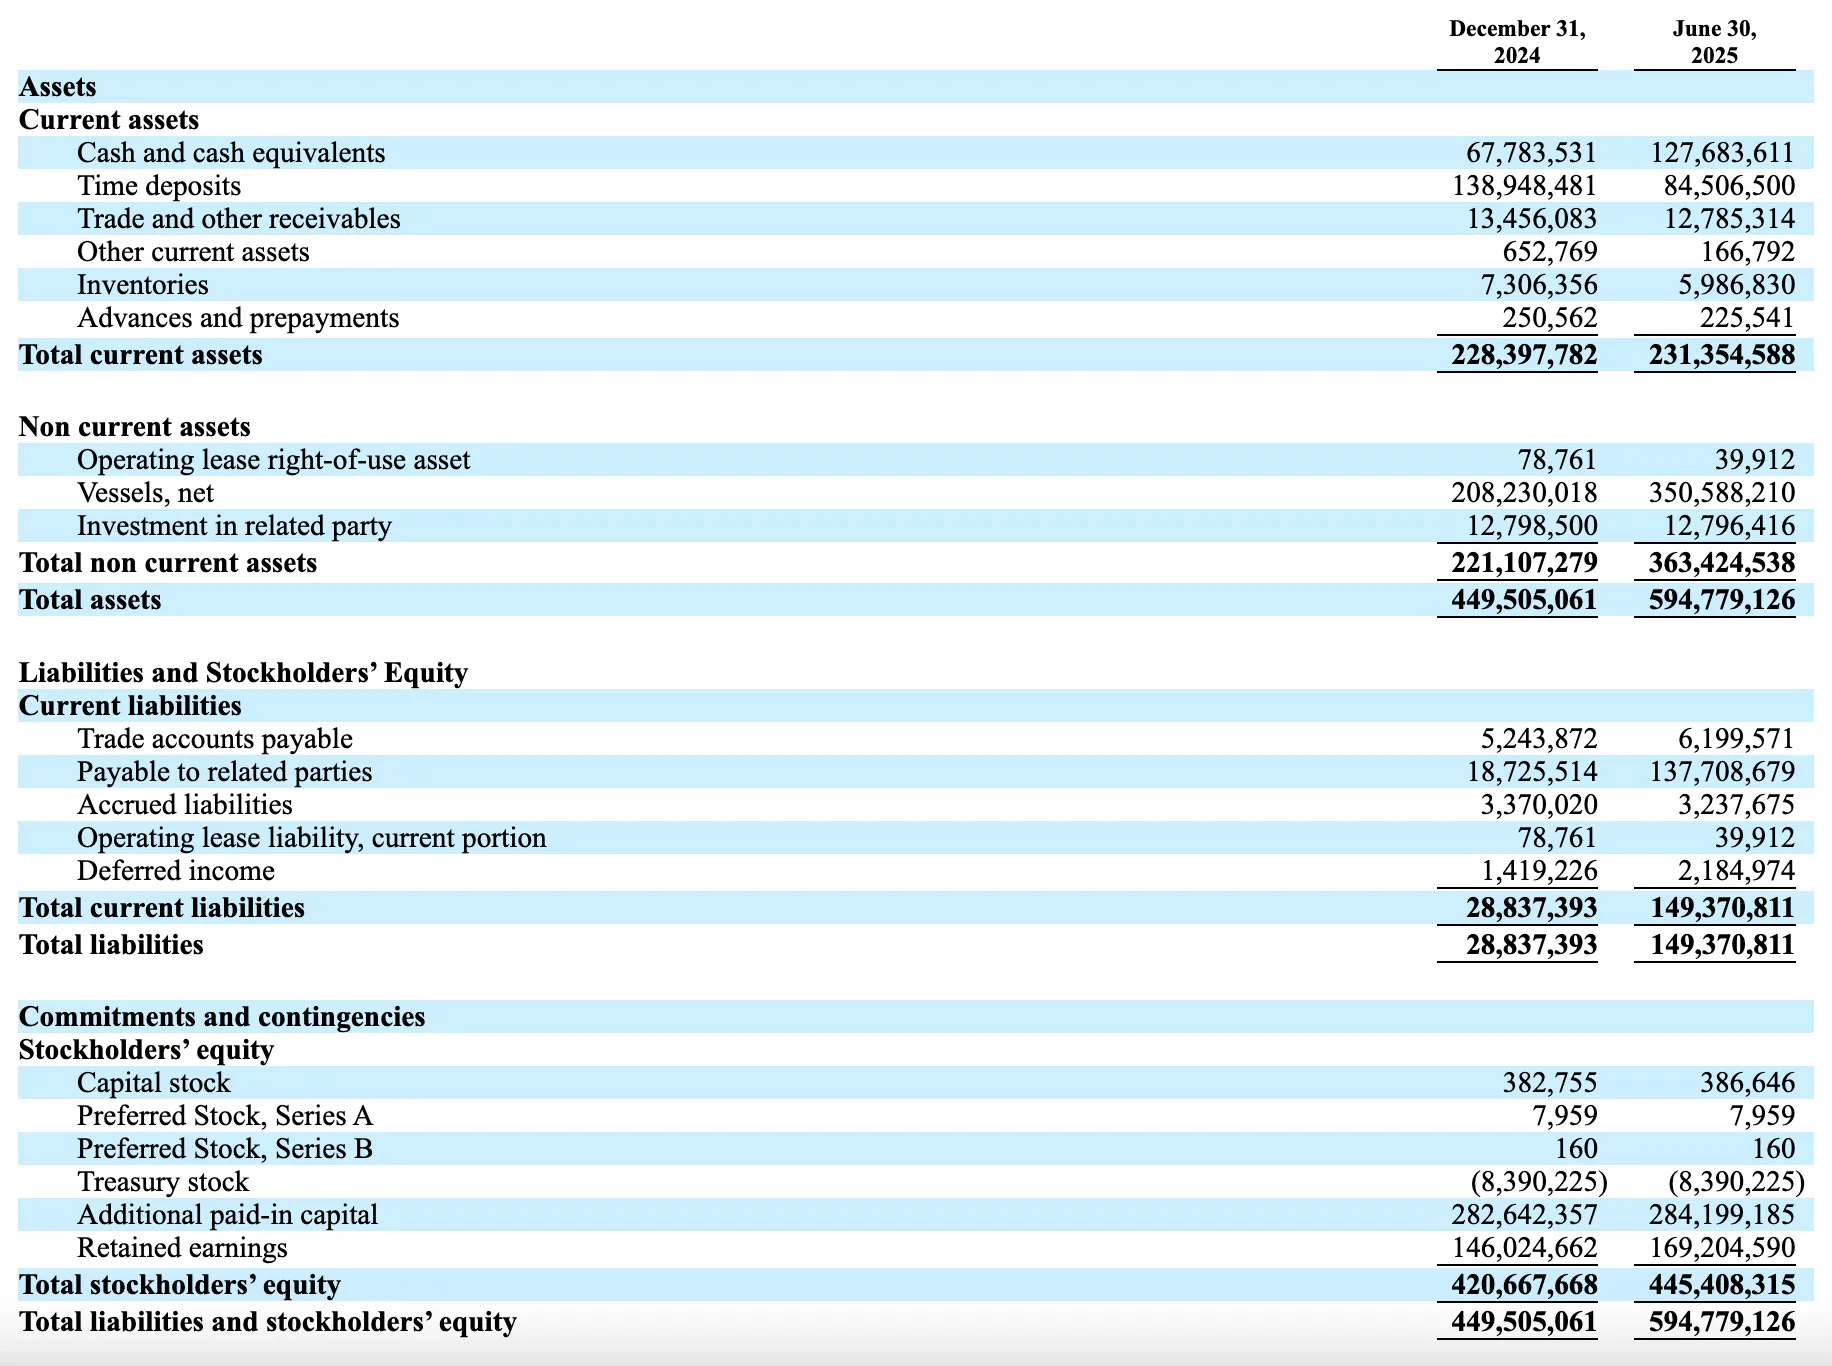
As of December 31, 2024, IMPP’s balance sheet showed:
$67.7 million in cash
$16.8 million in receivables (applying 80% recovery = $13.4 million)
$231 million in vessel book value (applying 90% recovery = $208 million)
Less $28.8 million in total liabilities
Less $19.9 million for Series A preferred liquidation preference
This gave a liquidation value of approximately $240 million, or roughly $5.90 per fully diluted share—comfortably above the $3.50 market price.
I noted that vessel recovery rates were highly uncertain. Academic literature suggested ranges from 15% to 69% depending on market conditions, asset specificity, and whether there was a ready market. At 90%, I was being optimistic, but even at 50% recovery, the liquidation value would still provide meaningful downside protection.
By September 2025 (as noted in my updates), the picture had improved further:
Market cap: $160.6 million
Estimated liquidated value: $127.6 million cash + $12.7 million (80% of receivables) + $315 million (90% of $350 million vessel value) - $19.9 million liquidated preference = approximately $435 million
Excluding vessels entirely, there was still $11 million in liquidation value from cash and receivables alone
The math seemed straightforward: buying at $3.50 offered a floor around $5.20 (depression-era rates) and upside to $10 (prevailing rates), with tangible asset backing providing downside protection.
🔑 How Sure Are You?
Intrinsic value is meaningless without understanding the probability of it achieving its intrinsic value. One of the most important question in any investment isn’t “how much can I make?” but “how likely am I to make it?” With IMPP, I needed to assess multiple layers of confidence.
The Screening Process: Finding the Opportunity
I didn’t stumble upon IMPP randomly. It emerged from a systematic screening checklist which i utilised to identify deep value situations:
✓ Primary listing - yes
✓ Market cap < $10B USD
✓ EV < $0 USD (enterprise value negative, meaning cash exceeds market cap)
✓ Price/cash < 1 (trading below cash value)
✓ Avg volume 90D > 100k (sufficient liquidity)
✓ Symbol type - common stock
✓ Operating cash flow per share FY > $1 USD
✓ Positive OCF for past 7 years
✓ P/E and P/B ratios falling relative to historical average (indicating value)
✓ P/E and P/B ratios significantly lower than competitor average
✓ Incentives against dilution (insider ownership structure - which apparently proved to be wrong)
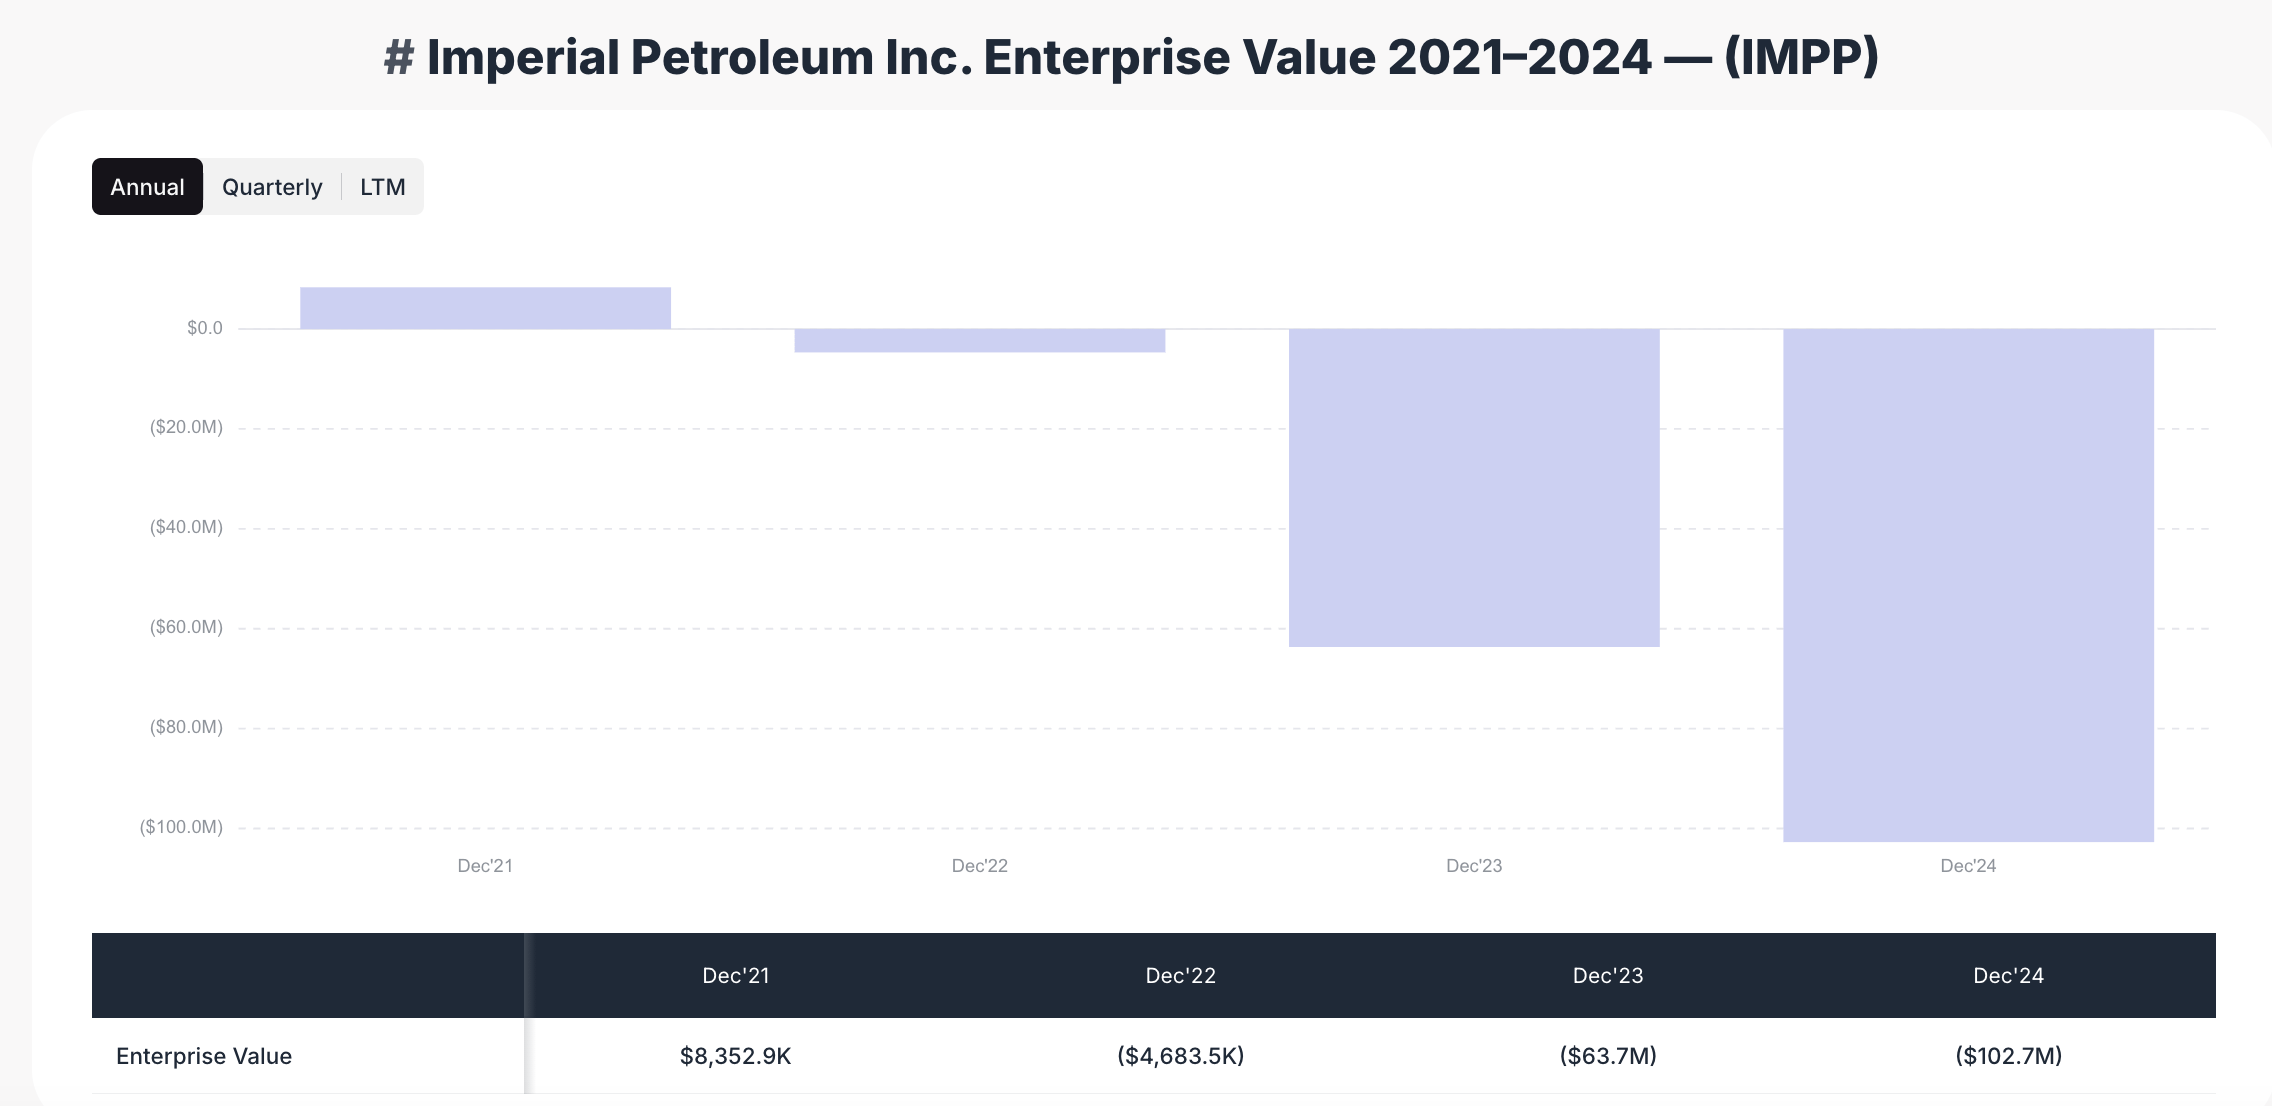
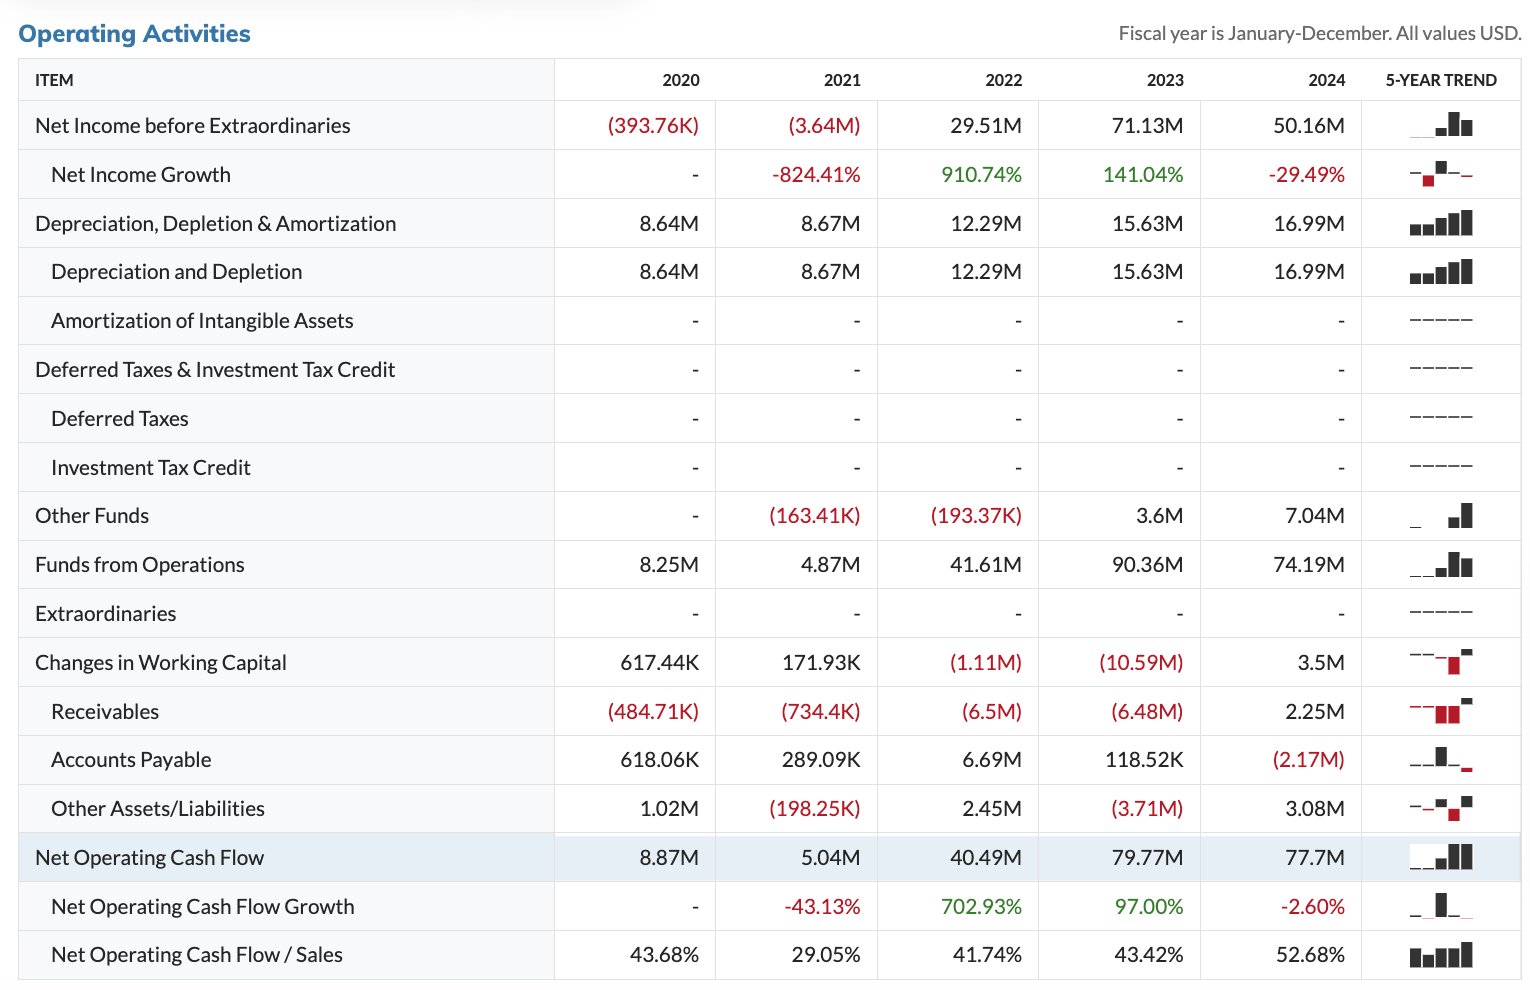
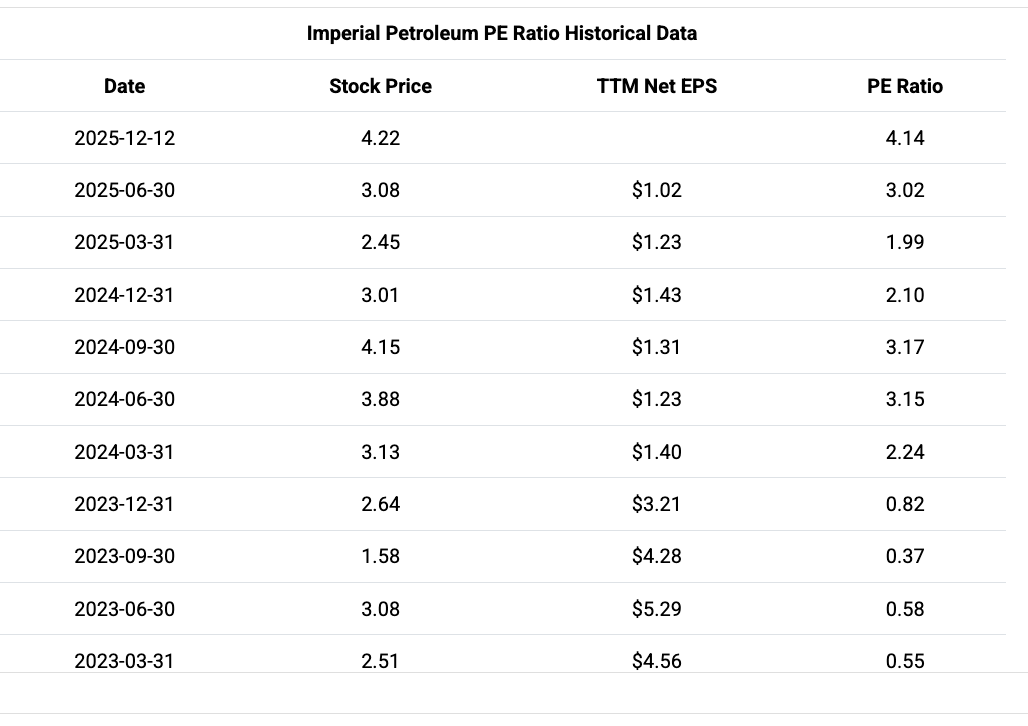
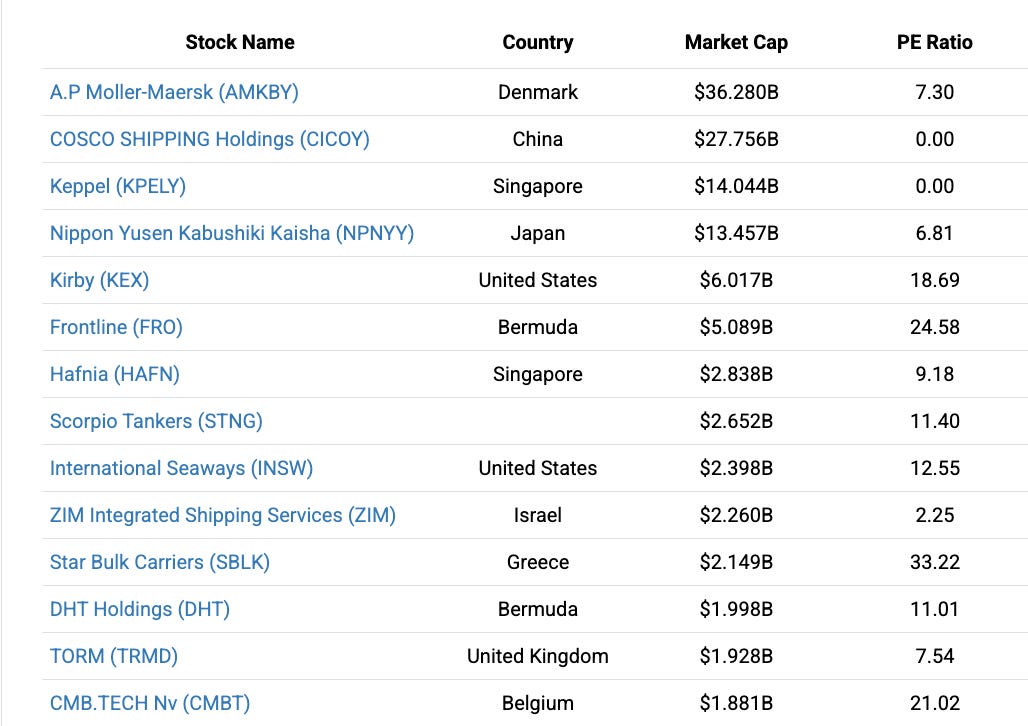
IMPP checked every box. This wasn’t a random micro-cap stock—it was a statistically cheap company that met rigorous quantitative criteria.
The Capital Structure: Dilution Risk
One of my primary concerns was dilution. IMPP’s capital structure was complex, and I needed to understand the worst-case scenario if every warrant holder exercised their rights.
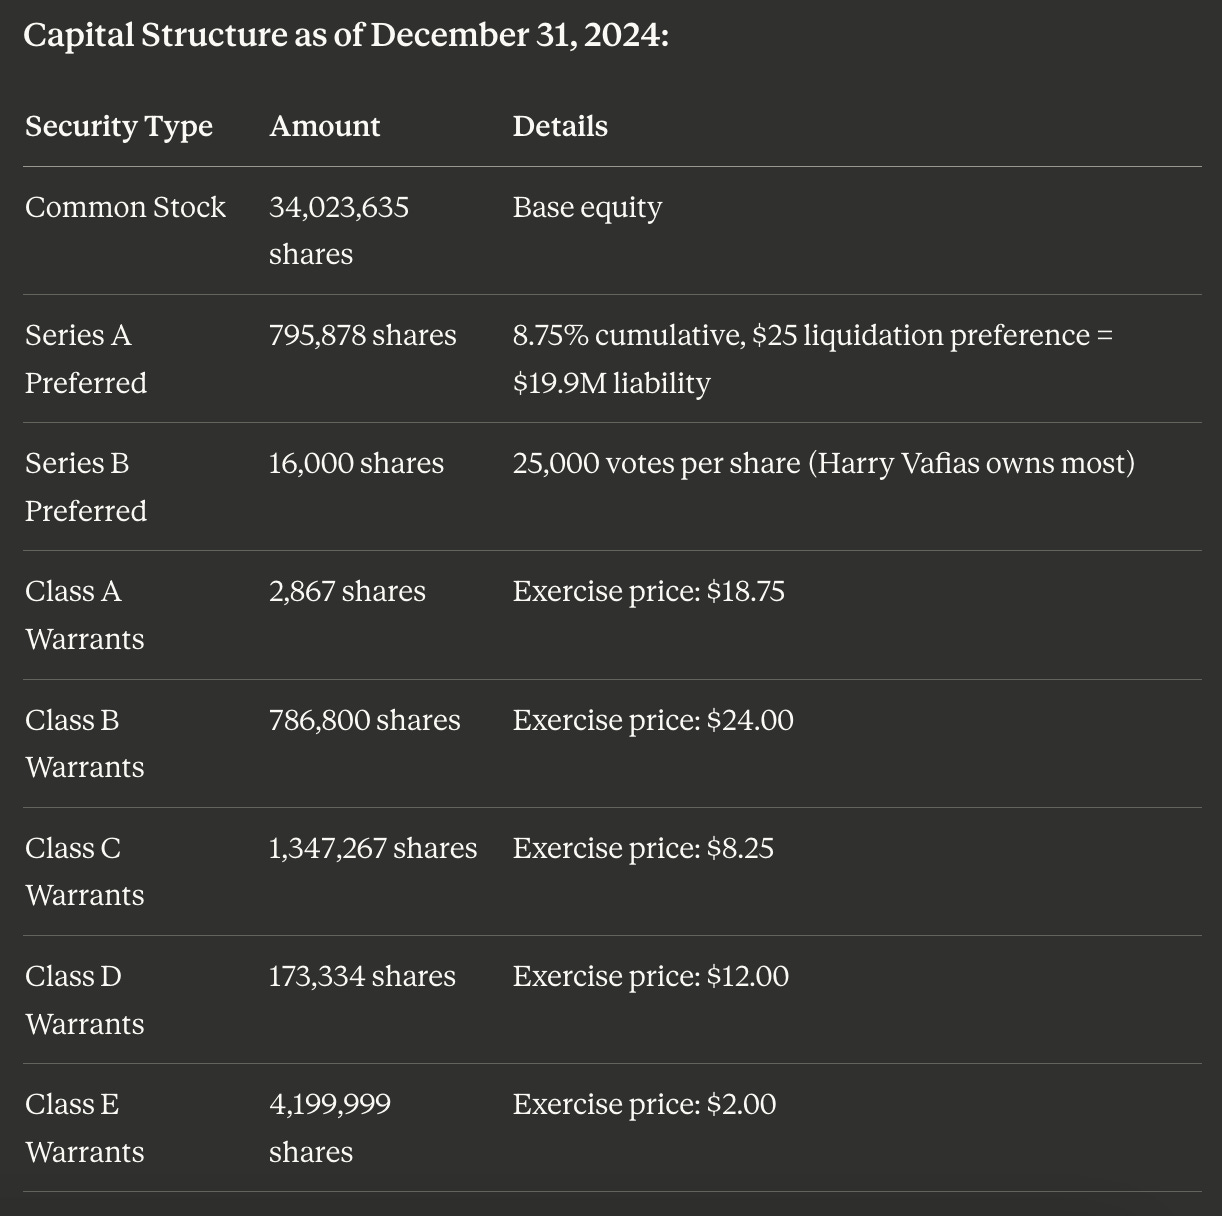
Worst-Case Dilution Calculation:
If every warrant was exercised, the total liquidation proceeds would be:
$67.7M cash + $13.4M (80% receivables) + $208M (90% vessels) - $28.8M liabilities - $19.9M Series A liquidation preference
Plus warrant exercise proceeds: ($18.75 × 2,867) + ($24 × 786,800) + ($8.25 × 1,347,267) + ($12 × 173,334) + ($2 × 4,199,999) = $40.5M
Total liquidation value: $280.9M
Total fully diluted shares: 40,533,902
Value per share even after full dilution: $6.93
This was reassuring. Even if every warrant holder exercised—which would only happen if the stock price rose significantly—the per-share value would still exceed my entry price of $3.50. The dilution risk was real but manageable.
Insider Alignment: Harry Vafias’s Stake
Perhaps the most compelling confidence factor was the ownership structure. By September 2025, the beneficial ownership looked like this:
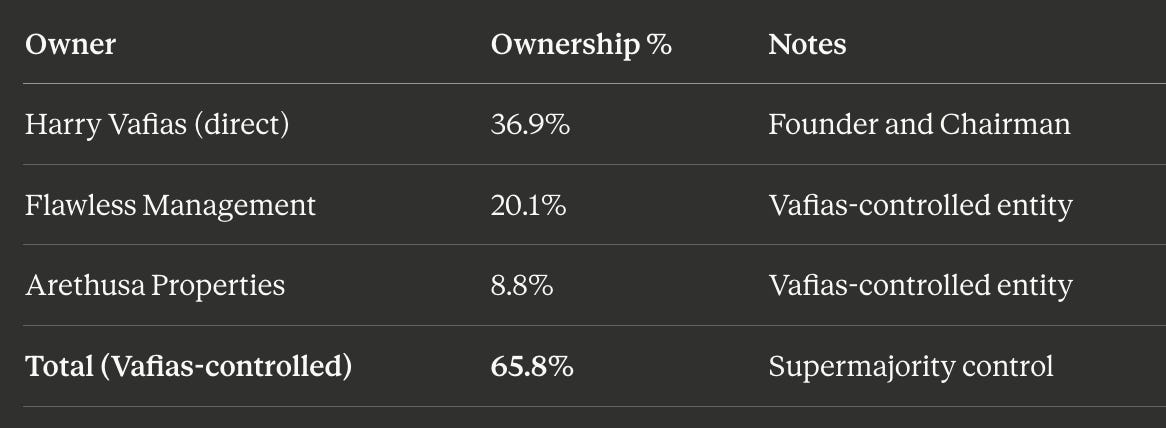
Harry Vafias wasn’t just the CEO—he effectively controlled nearly two-thirds of the company. Through his Series B Preferred shares (with 25,000 votes per share), he had overwhelming voting control. His economic interests appeared completely aligned with mine. If IMPP succeeded, Vafias would capture the majority of the gains. If it failed, he would bear the majority of the losses.
This wasn’t a hired gun CEO with stock options. This was an owner-operator with generational wealth tied to the company’s success. Or so it seemed (explained why and what happened to this position of mine in the conclusion below).
Market Fundamentals: The Shipping Thesis
Beyond the company-specific factors, I needed confidence in the underlying shipping market. This required understanding supply and demand dynamics across IMPP’s fleet composition.
Fleet Revenue Breakdown by Segment:
IMPP’s fleet wasn’t monolithic. Different vessel types served different markets with different risk profiles:
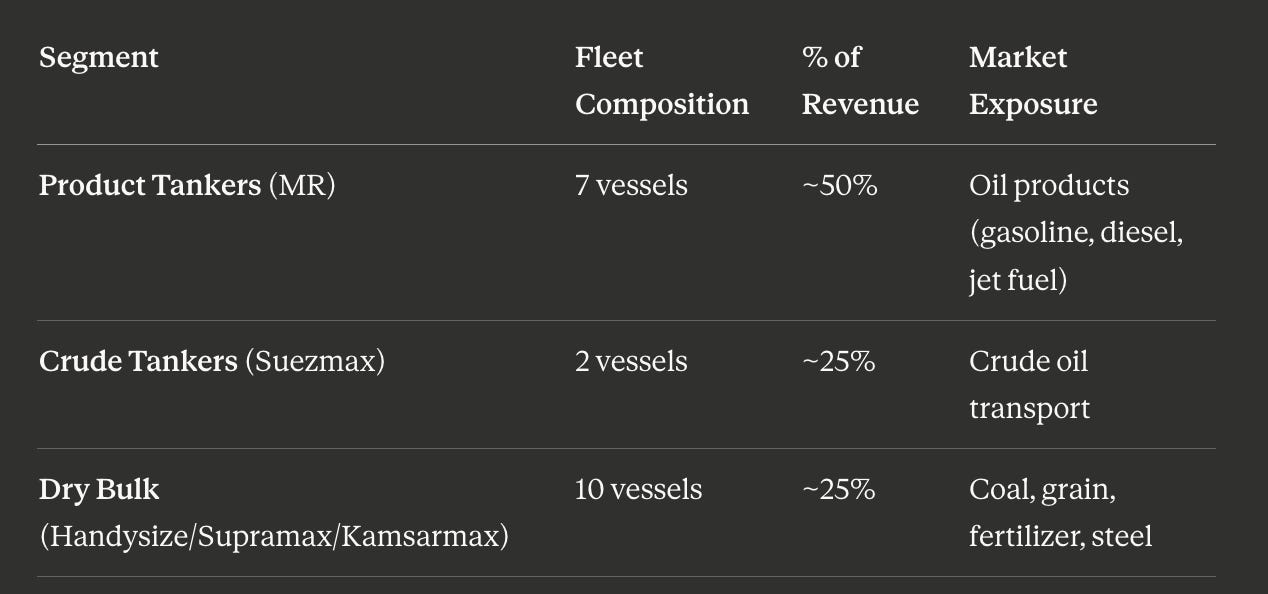
Understanding Each Segment:
Dry Bulk (50% of use cases):
Kamsarmax vessels → Coal, grain, minor bulks (routes: U.S. Gulf→Europe/Asia; ECSA→China)
❌ Assessment: Neutral to demand decline
Coal demand: Near-term plateau, then mild decline. IEA data showed 2026 demand falling back toward 2024 levels, with China as the swing factor. Prices softer than 2023 highs.
Grains (corn/soy/wheat): Broadly neutral-to-negative. USDA data showed larger production and record harvested area for corn, so no structural tightness barring weather shocks.
Supramax vessels → Grain, fertilizer, cement, steel products (routes: Intra-Asia, India→China; Med/Black Sea→Asia)
✅ Assessment: Rates relatively stable
More flexible vessel class serving diverse cargoes and regional trades
Handysize vessels → Grain, steel products, logs, minor bulks (routes: Intra-Asia; Med→N. Africa; Coastal trades)
✅ Assessment: Rates relatively stable
Smallest, most flexible class with diversified cargo options
Crude Oil Tankers (25% of use cases):
Suezmax vessels → Crude oil (routes: Black Sea/Med→Europe; W. Africa→Europe/US)
✅ Benefits from demand
Crude demand was growing at 0.7 mb/d for 2025-26
Long-haul Middle East→Asia and larger flows from West Africa/US→Asia keeping demand strong
VLCCs (long-haul) and Suezmax (mid-haul/Black Sea/West Africa) were primary beneficiaries in the current environment
Regional crude flows similar to MR product tanker patterns
The overall assessment: 25% of revenue was benefiting from growing crude demand, while 50% faced neutral-to-negative pressure from coal and grain markets. However, the Supramax and Handysize segments (the majority of the dry bulk fleet) offered stability through flexibility and diversification.
Supply-Side Dynamics: The Aging Fleet Advantage
The demand picture was mixed, but the supply side told a more compelling story:
Key Supply Constraints:
The global tanker fleet was aging because too few young ships had entered service, tanker demolitions collapsed after 2022, and sanctions gave very old ships a new lease on life. Until scrapping picked up or new vessels arrived, the fleet would keep aging—meaning the tankers available at that time would be the ones relied upon going forward, only older, less efficient, and increasingly concentrated in high-risk brackets.
Shortage of vessels in 2023 caused spike in tanker rates in 2024. The market was experiencing supply constraints that translated directly into pricing power.
Oil prices were dropping and OPEC was set to increase supply to regain market share. Lower oil prices typically meant higher volumes transported (more economical demand) and more trade activity. This increased shipping volumes for IMPP’s tanker fleet.
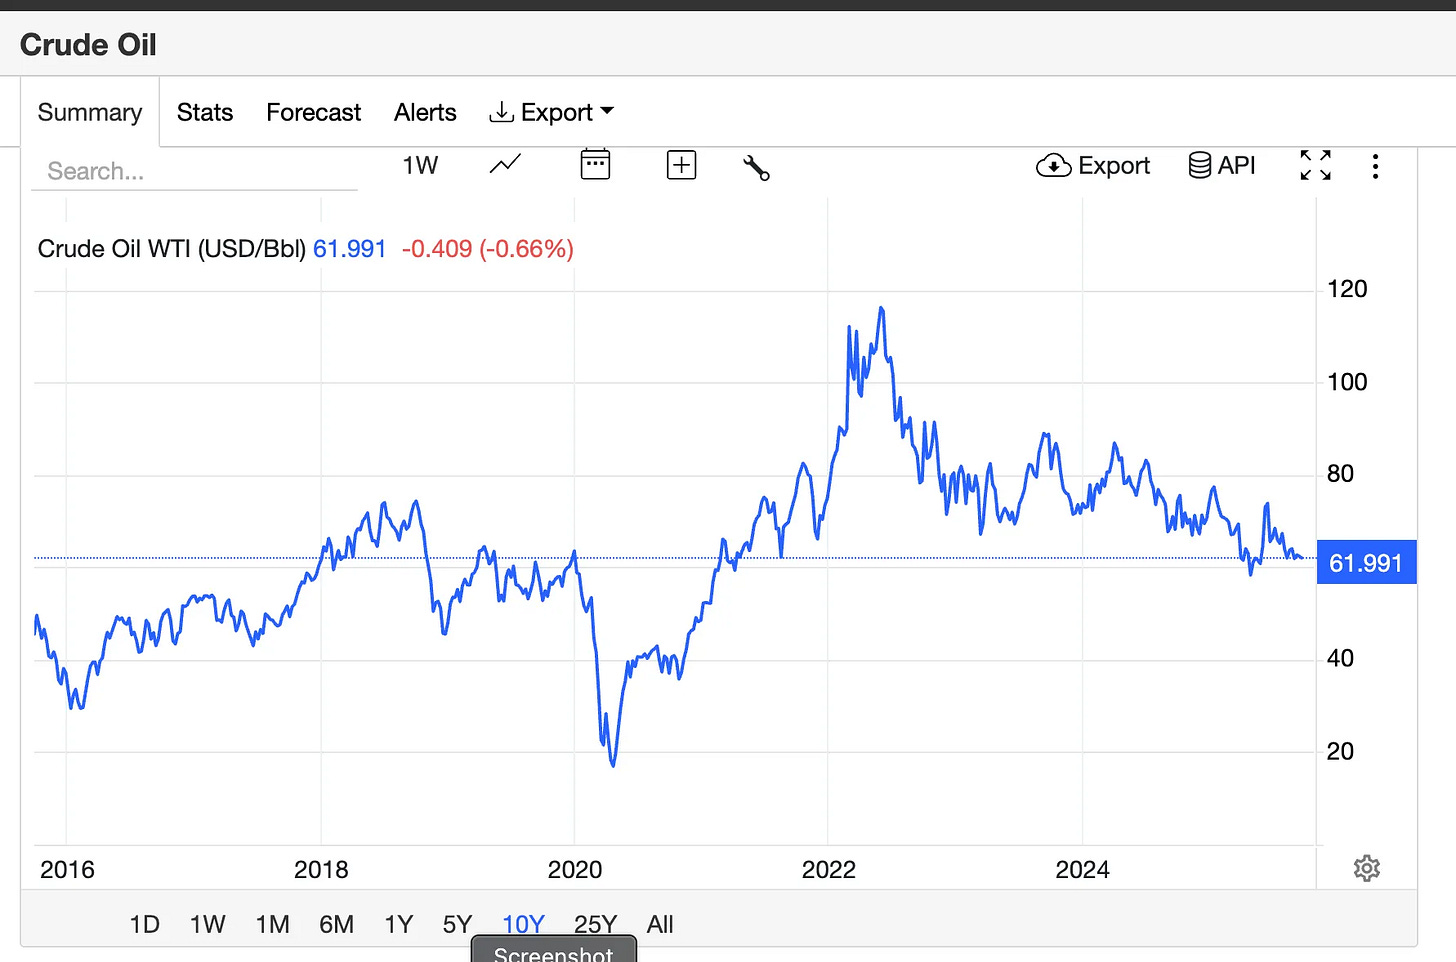
LNG trade growth was accelerating. With projects like Power of Siberia 2 and new facilities coming online in the United States, Canada, and Qatar, global natural gas demand growth was set to accelerate as more LNG supply came to market. This increased seaborne trade volumes.
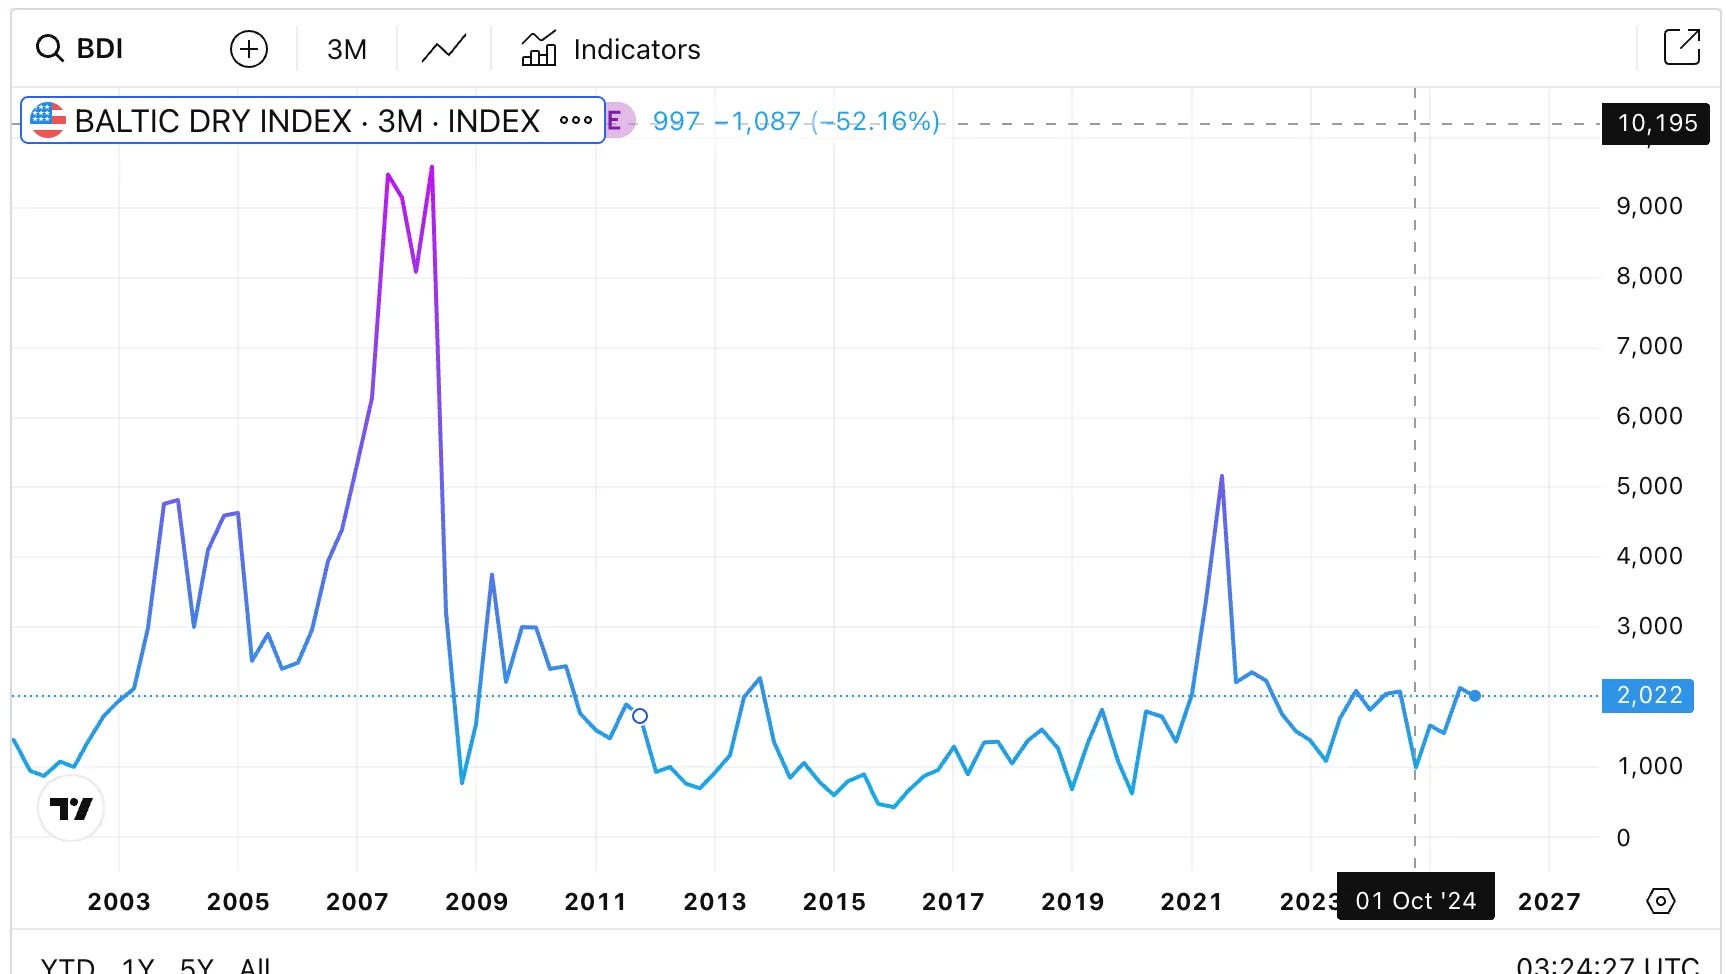
Baltic Dry Index rates were increasing from lows, suggesting the worst of the dry bulk downturn was behind the market.
Ship owners were increasing orders significantly. The data showed a massive uptick in newbuilding orders—indicating shipowners saw strong demand. Higher demand meant higher vessel prices, which supported IMPP’s asset values.
The Critical Timing Window: 2027 Orderbook Risk
But there was a catch. The same orderbook data that validated current tight supply also revealed a looming threat:
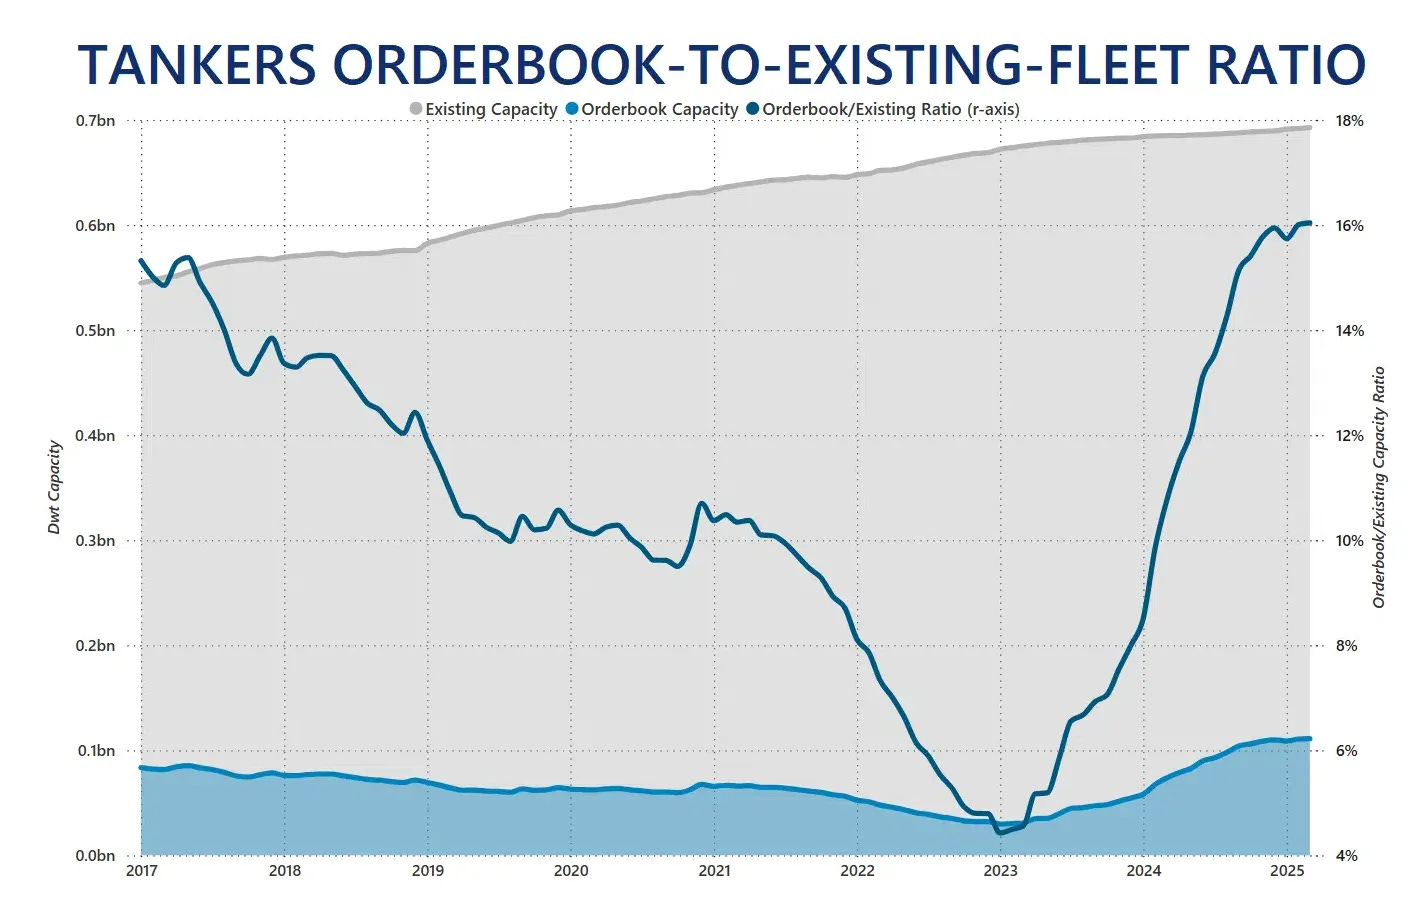
The influx of new supply entering the market. Generally, a new ship order takes 2 to 3 years to deliver. With a huge peak in orders placed in 2025, significant new capacity would hit the market around 2027. Aframax/LR2 tonnage was leading the orderbook, with other segments following at a similar pace.
This created a clear timeline: rates would face pressure once new vessel supply arrived around 2027. The investment had a window until then.
Recent Operating Performance: Reality Check
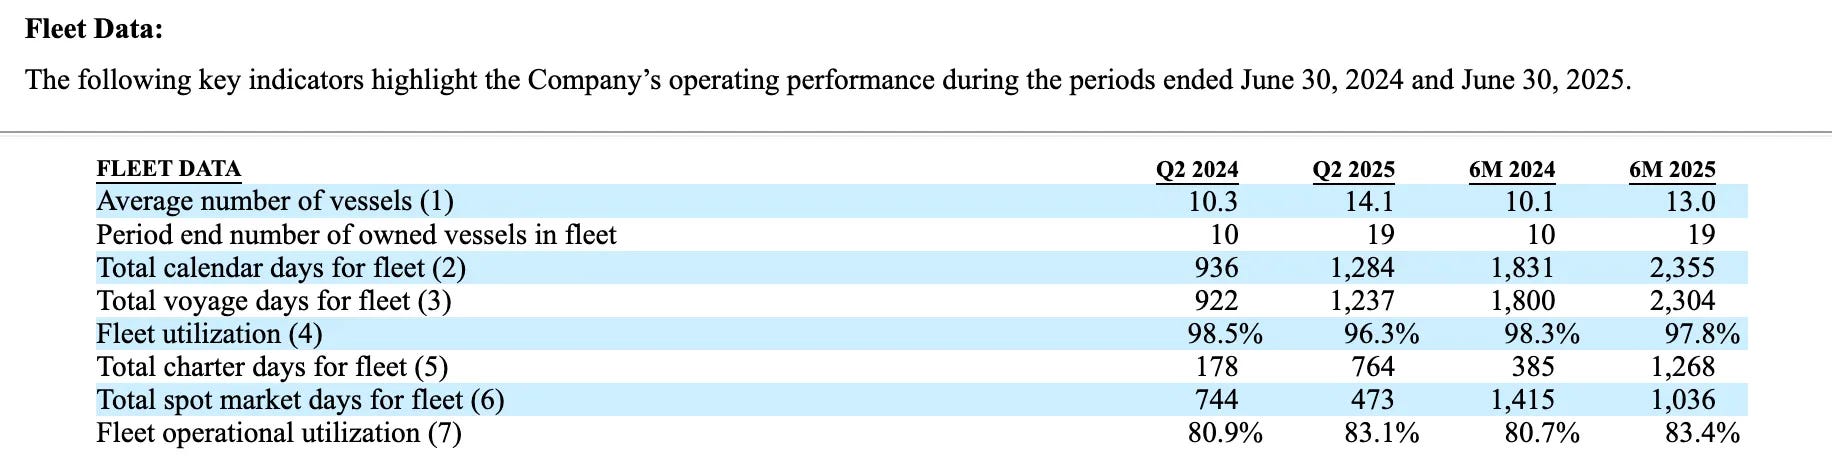
By mid-2025, I could see how the thesis was playing out in real numbers. The company reported:
H1 2025 vs H1 2024 Performance:
Revenues: $68.4M (H1 2025) vs $88.2M (H1 2024) → Down 22.4%
Decline primarily due to year-to-date decline in daily tanker spot and time charter rates
Voyage expenses: $21.2M (H1 2025) vs $30.6M (H1 2024) → Down $9.4M
Decrease mainly attributed to 27% decline in spot days due to rise in time charter activity
Vessel operating expenses: $15.5M (H1 2025) vs $12.5M (H1 2024) → Up $3M
The revenue decline reflected softening spot rates from 2024’s peak. However, the shift toward time charters provided more stable, predictable revenue. The company was adapting to market conditions.
However, note that this is just a check of operating ability, and by no means used to speculate on intrinsic value
Fleet Expansion: The Growth Catalyst
The most important confidence factor for earnings was the fleet expansion. IMPP had contracted to acquire 3 additional dry-bulk carriers (assumed to be Supramax-type based on total DWT of ~164,400), scheduled for delivery by August 2026.
Acquisition Details:
Total cost: $51.6 million
Financing: 90% cash, 10% equity
Impact: Fleet size increasing from 19 to 22 vessels (+16% capacity)
Side note: reference to most recent 2024/2025 reports, however, when this was identified in 2023, the fleet size was expected to double (and indeed it has), except for the fact that value was not realised much due to warrant dilution prior to Vafias owning c.65% of the company
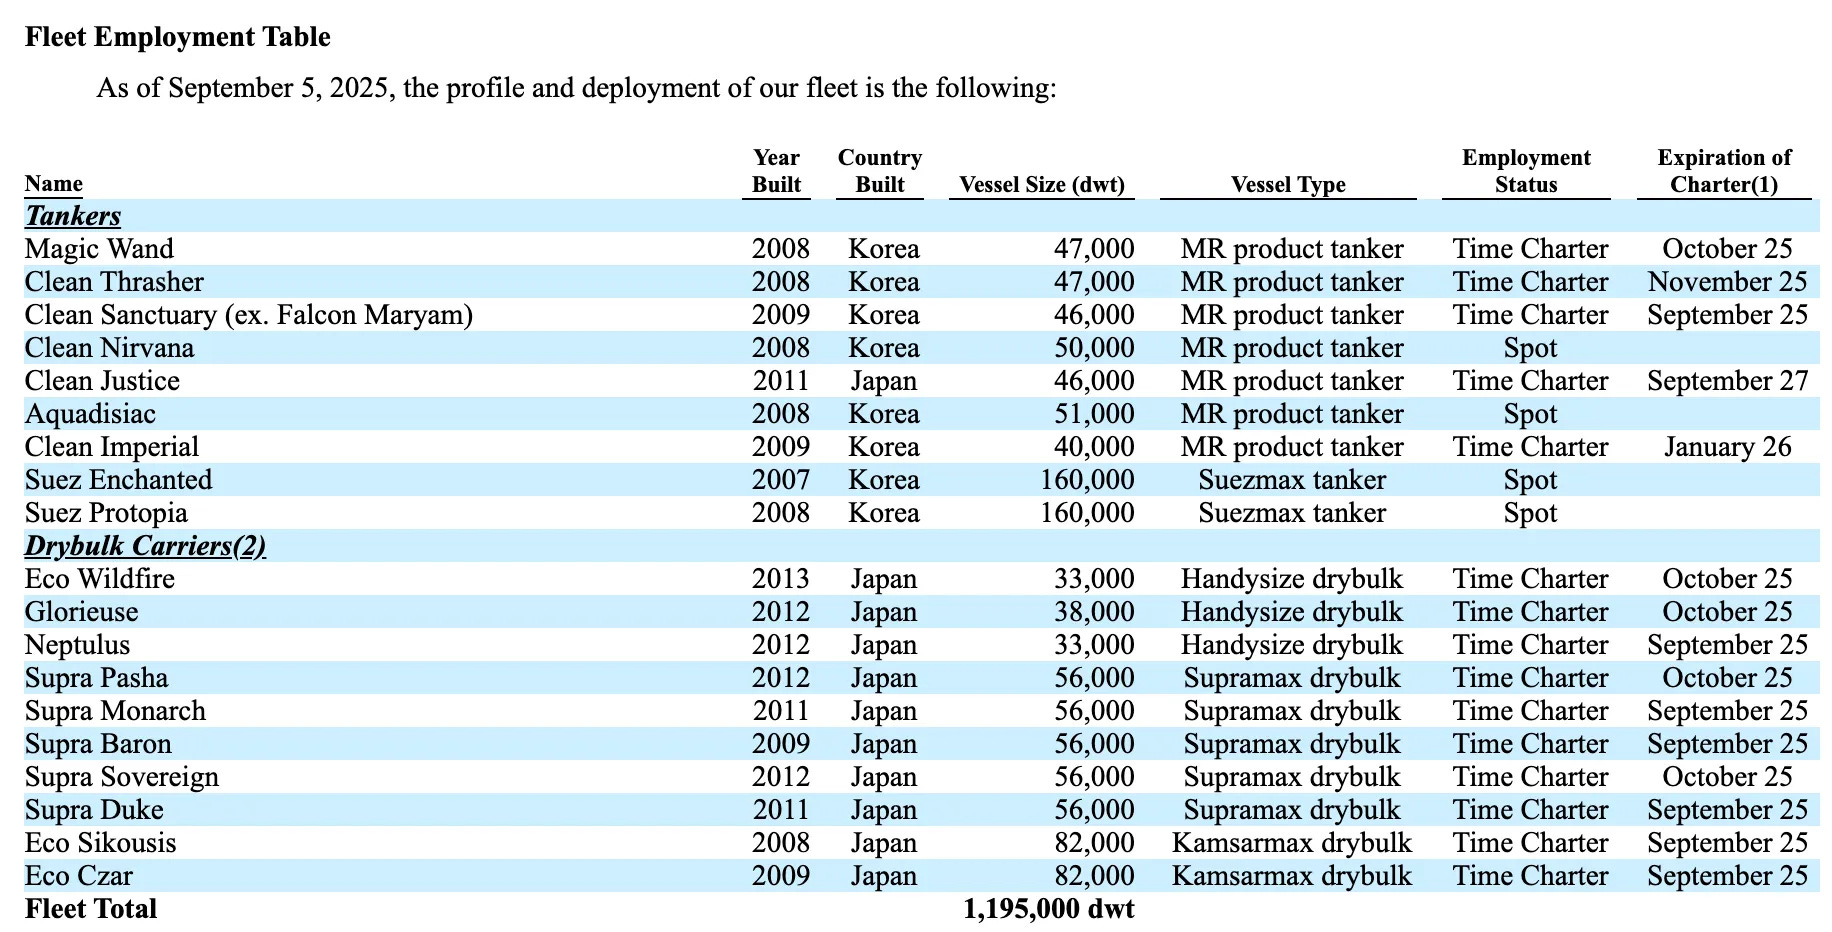
This expansion was critical to the thesis. Even if per-vessel rates remained flat or declined slightly, a 16% increase in fleet size would drive meaningful earnings growth. The market would have concrete evidence of IMPP’s growing earning power once these vessels came online and were reflected in quarterly results.
Market Uncertainty as a Tailwind
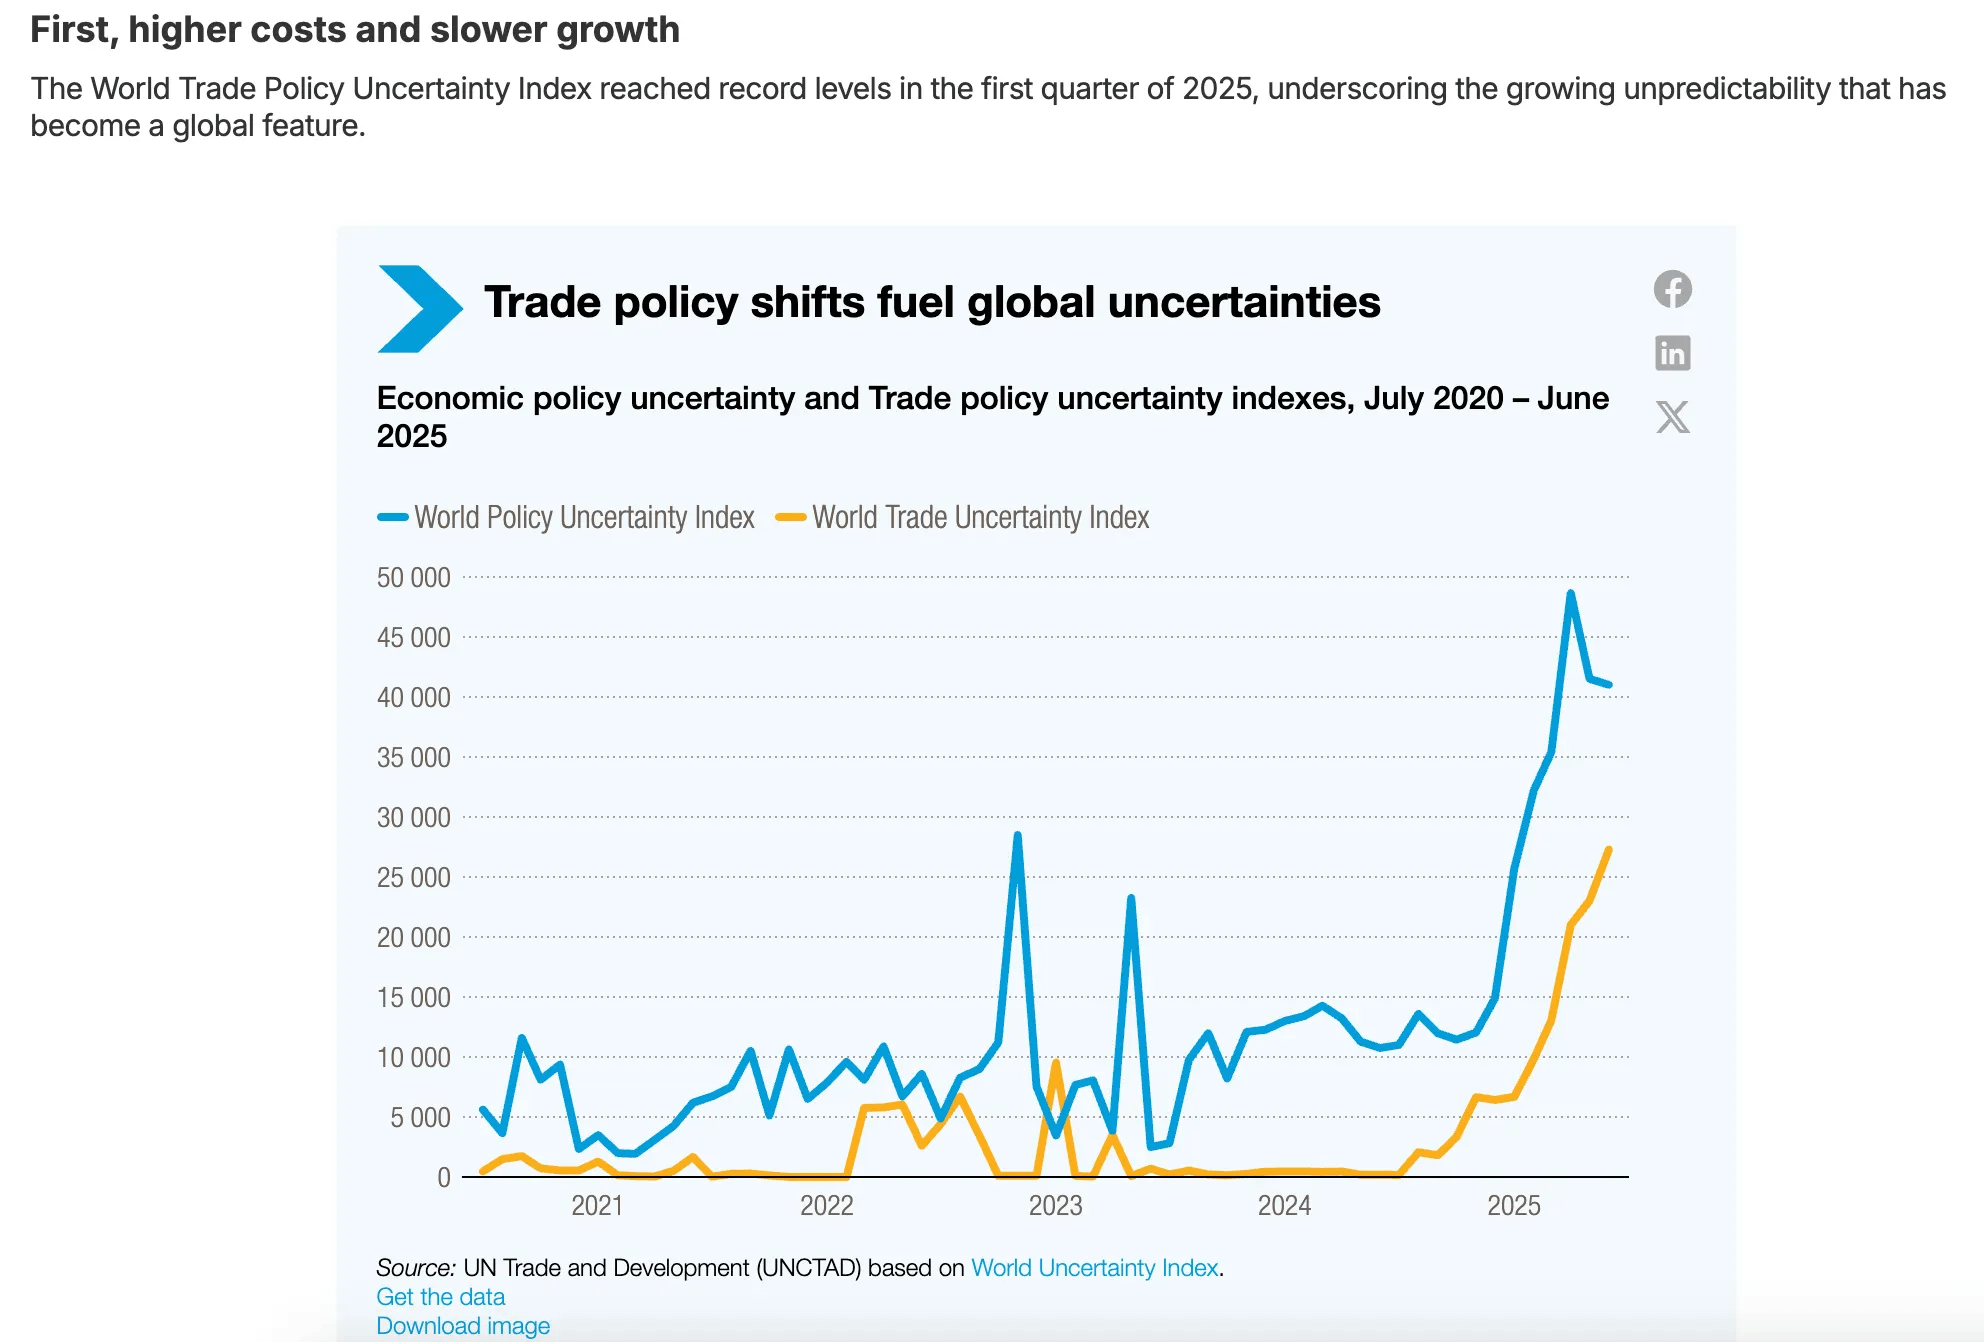
One final factor: uncertainty tends to correlate with rising freight prices. Global trade uncertainty, geopolitical tensions, and sanctions create inefficiencies that benefit ship owners through:
Longer voyage distances (sanctions rerouting)
Port congestion and delays
Customers willing to pay premiums for reliable capacity
The global environment in 2023-2025 was highly uncertain, which paradoxically supported freight rates and vessel utilization.
Baltic rates increasing
Confidence Assessment
So how sure was I?
High confidence factors:
✓ Quantitative screening criteria all met
✓ Trading below liquidation value with significant margin of safety
✓ Dilution risk modeled and manageable
✓ 65.8% insider ownership suggesting alignment
✓ Fleet expansion providing visible earnings catalyst
✓ Supply constraints supporting rates through 2026
✓ Multiple valuation approaches all pointing to significant value gap
Medium confidence factors:
⚠ Mixed demand picture (crude positive, coal/grain neutral-to-negative)
⚠ H1 2025 revenue decline showing rate pressure
⚠ Execution risk on fleet expansion and financing
Known risks:
⚠ 2027 orderbook threatening rate environment
⚠ Cyclical industry with history of value traps
⚠ Small-cap liquidity constraints
The probability of achieving the conservative $5.20 target is high—the company would have to operate in truly depressed conditions for an extended period to not reach that level, and the asset backing provided protection.
The valuation at $10 based on prevailing rates felt less certain. This required current rates to hold and the market to recognize the earnings growth from fleet expansion.
But importantly, I saw limited downside risk. The combination of cash, insider ownership, and tangible assets created a margin of safety that made the risk-reward attractive.
🔑 How Long Till You Get Them Out?
Time is the enemy of returns. Even a great investment becomes mediocre if it takes too long to realize. With IMPP, I needed to map out the timeline for value realization and identify the optimal exit window.
The Earnings Catalyst Timeline
The investment thesis hinged on the market recognizing IMPP’s improving earnings as the fleet expanded. This meant understanding when results would hit quarterly reports and drive re-rating.
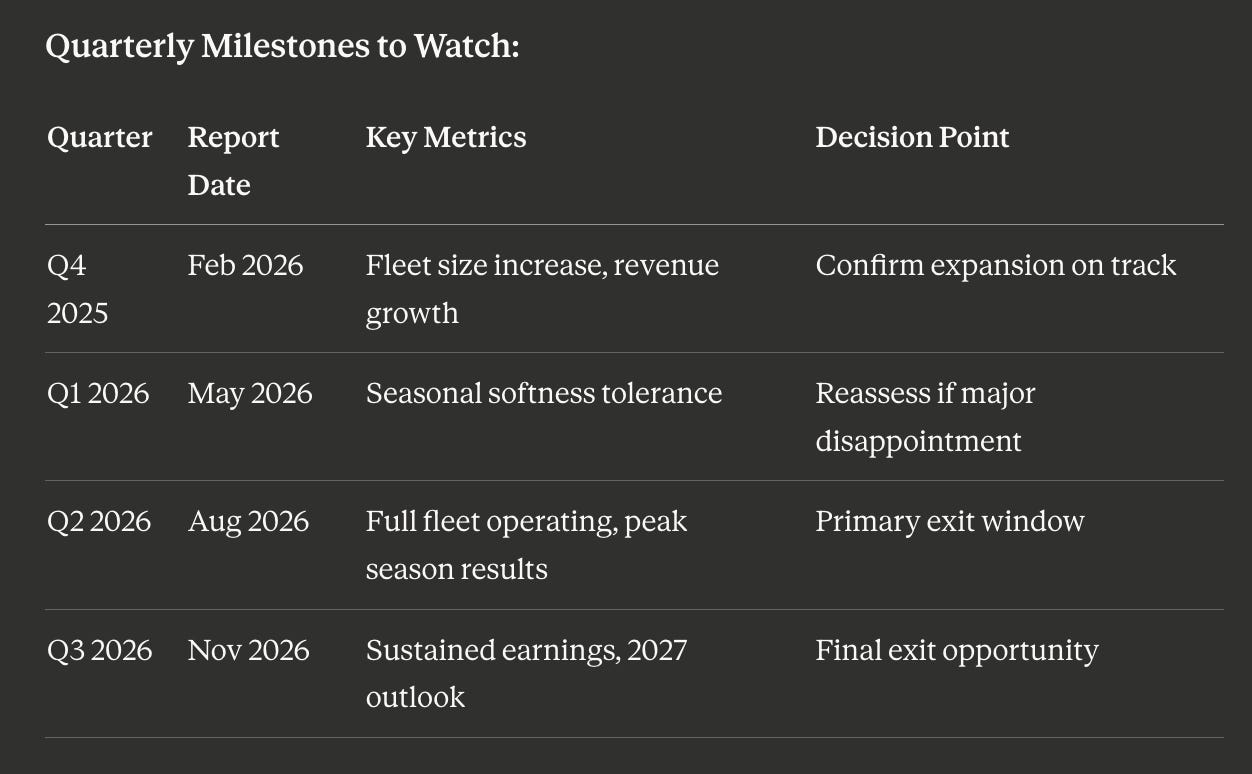
Q4 2025 Results (Reported February 2026):
Would show impact of increased fleet size
Oil supply increases reducing shipping costs while increasing volumes of oil shipped
First major data point showing earnings growth trajectory
Market attention on whether management was executing the fleet expansion on schedule
Q1 2026 Results (Reported May 2026):
Q1 is historically weak for shipping (post-holiday slowdown, weather disruptions)
Flat or declining sequential results would be normal seasonally but could trigger investor concern
Heavy dependence on the fleet expansion to offset seasonal weakness
Margin of safety here was low—any disappointment could trigger selling
Dry-bulk rates facing pressure (held up somewhat by crude oil demand)
Q2 2026 Results (Reported August 2026):
Critical inflection point: all 3 new vessels delivered by August 2026
Q2 is typically a strong shipping period (peak summer demand)
These results would reflect the full expanded fleet operating at high utilization
High earnings print here would validate the thesis and drive re-rating
This represented the optimal time to assess whether to hold or exit
The 2027 Wall: When to Exit
While Q2 2026 represented the peak opportunity, I needed to think about the medium-term picture. The orderbook analysis made one thing clear: exit before 2027.
Why 2027 was the deadline:
Massive wave of newbuilding deliveries (orders placed in 2024-2025)
New tanker capacity would pressure rates across all segments
Market anticipation of oversupply would start affecting valuations 6-12 months before deliveries
Historical shipping cycles showed rates could collapse quickly once oversupply emerged
Optimal Exit Windows:
Conservative Exit: Before February 2026
Lowest risk approach
Exit before Q1 2026 results (seasonal weakness risk)
Lock in gains from Q4 2025 strength
Miss Q2 2026 peak, but avoid execution risk
Balanced Exit: August-September 2026
Wait for Q2 2026 results showing full fleet expansion impact
Capture peak summer shipping season earnings
Exit well before 2027 orderbook concerns affect valuations
Optimal risk-reward timing if thesis played out
Aggressive Hold: Through Q4 2026
Ride full year of expanded fleet earnings
Risk that market starts pricing in 2027 oversupply concerns
Could face multiple compression even with strong earnings
Only justified if rates remained exceptionally strong
The Time Value Consideration
At entry ($3.50), the conservative target ($5.20) represented a 49% gain. If achieved by August 2026 (21 months), this equated to roughly 28% annualized returns.
The optimistic target ($10) represented a 186% gain over the same period, or approximately 134% annualized.
These return profiles were attractive enough to justify the holding period, provided the thesis remained intact. The key was monitoring quarterly results and being prepared to exit early if:
Fleet expansion faced delays or financing issues
Charter rates deteriorated faster than the historical pattern suggested
Management took actions that weren’t shareholder-aligned
Market started pricing in 2027 oversupply ahead of schedule
That being said, in value investing, i always believe that it is a high risk and a poor decision to time the market. Getting involved in LEAPs exposes you to a significant time risk which you have no choice but to speculate to a certain extent on the timing that intrinsic value is discovered. If I had the choice, I would not time the market.
The Timeline Summary
The investment had a clear life cycle:
Entry: November 2023 at $3.50
Catalyst building period: Q4 2025 - Q1 2026 (fleet expansion completion)
Peak value realization: Q2 2026 (full fleet operational, strong seasonal results)
Exit deadline: Before Q4 2026 / Early Q1 2027 (ahead of orderbook impact)
This gave a 15-21 month holding period to capture the value as the market recognized the earnings growth from fleet expansion, then exit before the shipping cycle inevitably turned.
The birds were in the bush at $5.20-$10. I was reasonably confident based on the asset backing and insider ownership. And I knew approximately when to collect them: summer 2026, before the 2027 orderbook wave arrived.
Now it was just a matter of execution—and trusting that the people holding the bush would act in good faith.
🔑 Conclusion - What Actually Happened: The $60 Million Betrayal
The thesis was sound. The numbers checked out. The margin of safety was real. But I had made a critical error in judgment—one that Warren Buffett had warned about for decades.
The Dilution Bomb
Harry Vafias—the very insider whose 65.8% ownership stake I had viewed as alignment—executed a $60 million direct offering. This wasn’t a modest capital raise to fund the fleet expansion we already knew about. This was a massive equity issuance that fundamentally reset the entire investment equation.
The offering included not just new common shares, but also two additional classes of warrants. The total dilution of shares to be issued from the $60 million raise was approximately equal to the existing shares outstanding—effectively doubling the share count. Worse, the pricing implied an intrinsic value of just $2 per share.
Let me repeat that: $2 per share.
All those careful dilution analyses I had done? The worst-case scenario where I calculated $6.93 per share even after full warrant exercise? Obsolete. Vafias had simply created a new worst-case scenario by issuing equity at prices that destroyed existing shareholder value.
The market’s reaction was swift and brutal. The stock price collapsed as investors processed what this meant. The 65.8% ownership stake I had viewed as proof of alignment was actually proof of control—control that could be wielded to raise cheap capital at the expense of minority shareholders.
The Buffett Wisdom I Should Have Weighted More Heavily
Warren Buffett has said it countless times, in countless ways, but perhaps most directly: “You can’t do good business with bad people.” Period. No caveats. No exceptions.
Charlie Munger had another quote which i should have paid more attention to: “A lot of people with high IQs are terrible investors because they’ve got terrible temperaments. And that is why we say that having a certain kind of temperament is more important than brains. You need to keep raw irrational emotion under control.”
A short transparent note: if you had realised, the research was also done in November 2023 but my entry price was about $3.5 (whilst November was around $1.7. This is because i made a massive mistake prior to this entry. And that was because i had poor temperament and was still influenced by FOMO which resulted in exposure to greater time risk with shorter term options - this is also why, i now never take a option position that is shorter than 2 years (which makes my checklist even harder to fulfill for subsequent plays) - note that it is better to avoid time based plays tho
How Margin of Safety Saved Me
Yet here’s the twist: I still made money
Despite everything—despite the dilution bomb, despite being fundamentally wrong about management alignment, despite Harry Vafias proving to be exactly the kind of operator Buffett warns against—I exited in December 2025 with approximately $30,000 from my initial $10,000 investment. A 3x return, or about 73% annualised - I exited when the business was selling at about $4.5 per share (which dropped from $6.5 which i should have exited).
How?
Margin of safety.
The stock had been so absurdly cheap at c.$3—trading below cash, below liquidation value, below any rational measure of intrinsic worth—that even a dilutive capital raise couldn’t completely destroy the value proposition. The assets were real. The cash flow was real. The fleet expansion was real.
As Buffett teaches: “The three most important words in investing are margin of safety.” And as Ben Graham before him emphasized, margin of safety is the difference between the price you pay and the value you receive—protection against error, misfortune, and yes, bad management.
My error was in management assessment. My misfortune was in trusting ownership percentages over character evaluation. But my margin of safety—buying at c.$3 when the assets were worth $5.20-$10—gave me room to be wrong and still profit.
The stock did rally before the December 2025 dilution. The fleet expansion materialized. Earnings did improve as vessels came online. The shipping market dynamics I had analyzed played out roughly as described. The market did begin to recognize the value. I was able to exit when another dilution event telegraphed that the pattern would repeat.
The Uncomfortable Truth
Here’s what makes this case study uncomfortable: I made money despite being wrong about the most important thing.
In investing, you can get rich being right for the wrong reasons, or lucky at the right time. But as Buffett warns: “It’s only when the tide goes out that you discover who’s been swimming naked.” I was lucky that my margin of safety was so extreme that even management malfeasance couldn’t sink the position entirely.
But this is exactly why Buffett and Munger harp on management quality so relentlessly especially in smaller cap companies. If the shipping market had turned negative, if the fleet expansion had hit delays, if any number of things had gone differently—my margin of safety might not have been enough to overcome a CEO actively working against shareholder interests through serial dilution.
The Iron Law: No Exceptions
So what’s the takeaway after 2 years, $20,000 in gains, hours of research, and a fundamental misreading of management?
Warren Buffett is right. You can’t do good business with bad people. There are no exceptions.
The margin of safety saved me this time. The extreme cheapness of the entry point, combined with real asset backing and improving fundamentals, created enough cushion to profit despite management extraction. But this is not a repeatable strategy. This is not edge. This is luck masquerading as skill.
The harder truth: I should have walked away the moment I couldn’t confidently answer the question: “Would I trust this person to manage my money?”
No amount of net-net discount, no level of insider ownership, no pile of cash or fleet of ships is worth partnering with someone whose incentives don’t align with yours. Because as Munger teaches: “Show me the incentive and I’ll show you the outcome.”
Looking in the rearview mirror now, the pattern is obvious: an operator with supermajority control who raises dilutive capital despite sitting on massive cash reserves isn’t building shareholder value—he’s building an empire at shareholder expense. The 65.8% ownership wasn’t a sign of alignment; it was a sign that he could afford to dilute because he’d capture most of the new shares issued anyway.
The Actual Lesson - The lesson isn’t “margin of safety makes up for bad management.” The lesson is: “Margin of safety can save you when you make mistakes, but you should avoid making the mistake in the first place.”
Ben Graham gave us margin of safety as a tool for inevitable errors in judgment, unexpected market changes, and the general uncertainty of valuation. It’s not a license to ignore red flags in management quality. It’s a cushion for when you miss something, not an excuse for ignoring what’s in front of you.
And lastly, as Warren Buffett reminds us: “You can’t do good business with bad people.” Period. No exceptions. Not even if you get lucky and make 3x your money anyway.
The $20,000 profit from IMPP sits in my brokerage account. But the real return was the lesson: margin of safety protects you from your mistakes, but wisdom means not making the mistake in the first place. Everyone talks about losses and the big lessons they’ve learnt from them (fair enough, because i have my fair share of massive losses in the past and they have taught me a ton too), but sometimes the most expensive lesson is the one you profit from—because it can teach you that you were right for the wrong reasons, and that’s the most dangerous lesson of all. I got lucky from this to be honest, and this taught me a great lesson.
References
Macrotrends — financial data and historical ratios
https://www.macrotrends.net/AXSMarine Blog — The Aging Global Tanker Fleet: Causes, Market Impact, and What Comes Next
https://public.axsmarine.com/blog/the-aging-global-tanker-fleet-causes-market-impact-and-what-comes-nextAXSMarine Blog — Tanker Fleet Rebounding: Revealing Latest Orderbook Trends
https://public.axsmarine.com/blog/tanker-fleet-rebounding-revealing-latest-orderbook-trendsShippingWatch — Shortage of vessels in 2023 caused spike in tanker rates in 2024
https://shippingwatch.com/carriers/Tanker/article16282278.eceShippingWatch — Ship owners increasing container ship orders as rates rise
https://shippingwatch.com/carriers/Container/article18506756.eceOilPrice.com — What’s the Real Reason Behind OPEC’s Surprise Oil Production Boost?
https://oilprice.com/Energy/Crude-Oil/Whats-The-Real-Reason-Behind-OPECs-Surprise-Oil-Production-Boost.htmlDiscovery Alert — Power of Siberia 2 Pipeline (2025) and Its Global Energy Significance
https://discoveryalert.com.au/news/power-of-siberia-2-pipeline-2025-significance/International Energy Agency (IEA) — Global Natural Gas Demand Growth Set to Accelerate in 2026 as More LNG Supply Comes to Market
https://www.iea.org/news/global-natural-gas-demand-growth-set-to-accelerate-in-2026-as-more-lng-supply-comes-to-marketInternational Energy Agency (IEA) — Coal Mid-Year Update 2025
https://www.iea.org/reports/coal-mid-year-update-2025/overviewUnited States Department of Agriculture (USDA) — World Agricultural Supply and Demand Estimates (WASDE), August 2025
https://www.usda.gov/oce/commodity/wasde/wasde0825.pdfUnited Nations Conference on Trade and Development (UNCTAD) — Uncertainty: New Tariff Costing Global Trade and Hurting Developing Economies
https://unctad.org/news/uncertainty-new-tariff-costing-global-trade-and-hurting-developing-economiesYahoo Finance — A Look at Imperial Petroleum (IMPP) Valuation
https://finance.yahoo.com/news/look-imperial-petroleum-impp-valuation-150842668.htmlGeneral shipping valuation concepts referenced implicitly:
Asset specificity coefficient (CAS)
Chapter 11 liquidation appraisal studies
PP&E recovery rate literature (transportation sector benchmarks)
Levinson, Marc — The Box: How the Shipping Container Made the World Smaller and the World Economy Bigger
George, Rose — Ninety Percent of Everything: Inside Shipping, the Invisible Industry That Puts Clothes on Your Back, Gas in Your Car, and Food on Your Plate
Bow, John McPhee (commonly referenced as “The Shipping Man” in shipping-investment circles) — The Shipping Man
(Often cited informally in shipping investment discussions as a narrative reference to tanker economics and shipping cycles)